Predictive Analysis Using Linear Regression With SAS
In SAS, PROC REG can be used for linear regression to find the relationship between two variables. It is one of the most-used predictive technologies.
Join the DZone community and get the full member experience.
Join For FreeLinear regression is used to establish the relationship between a scalar dependent variable and one or more independent variables (explanatory variables). Linear regression consists of finding the best-fitted straight line through the points. This is known as a regression line. It is one of the most-used predictive technologies.
For example, if you want to predict the weight of person depending on their height, then the weight will be the dependent variable, as it needs to predict, and the height is the independent variable.
In SAS, PROC REG is used for linear regression to find the relationship between two variables.
Syntax
PROC REG DATA = dataset;
MODEL var1 = var2;datasetis the name of the dataset.var1andvar2are the variables' names in the dataset used to find the correlation.
Here, you need to check for the P value and R-squared value.
If the R-squared Value is greater than 0.7, then your model is good.
If the P value is greater than 0.05, then the null hypothesis (h0) will be accepted. Otherwise, we will go for alternate hypothesis.
Simple Linear Regression
Modeling and establishing the relationship between one dependent variable and one independent variable is known as Simple Linear Regression.
y = β0 + β1x1 + ϵ
x1 is the independent variable.
y is the dependent variable.
β0 is constant.
β1 is the regression coefficient.
ϵ is an error.
Data Person_Data ;
input weight height;
datalines;
30 130
40 140
45 145
50 160
55 170
60 172
;
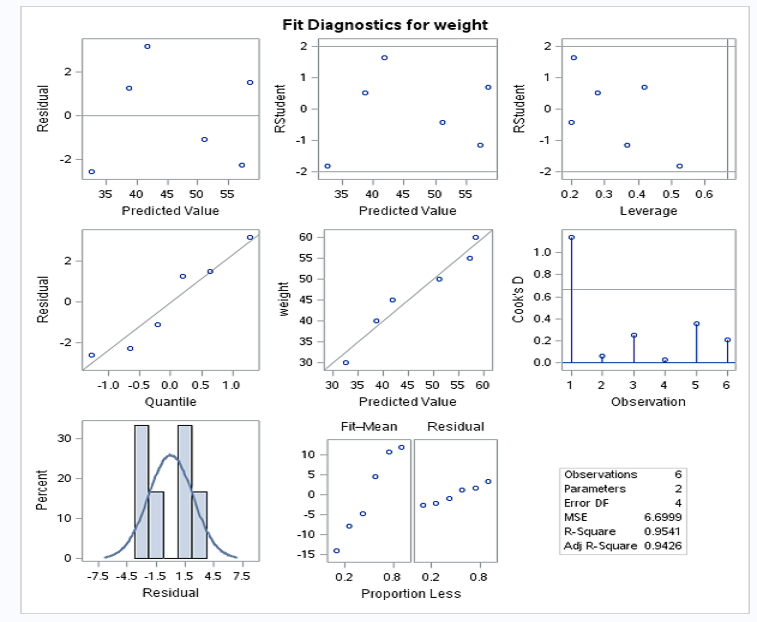
proc reg data=work.person_data alpha=0.05 plots(only)=(diagnostics residuals observedbypredicted);;
model weight=height;
output out=WORK.Reg_stats p=p_ lcl=lcl_ ucl=ucl_ rstudent = r ;
run;
quit;weightis the dependent variable.heightis the independent variable.
Output
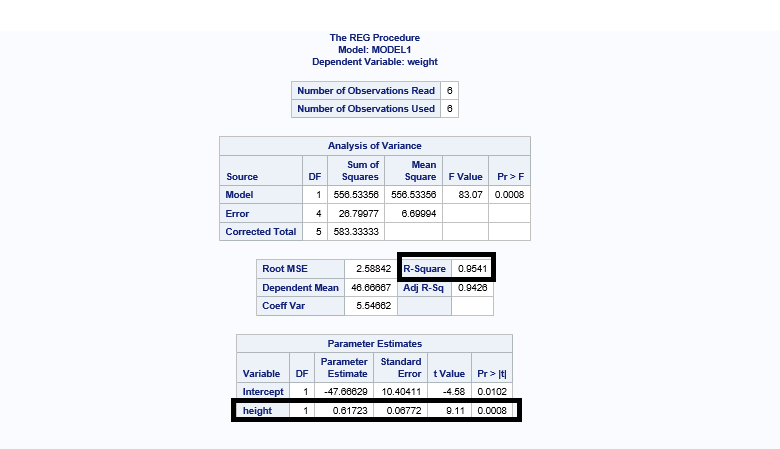
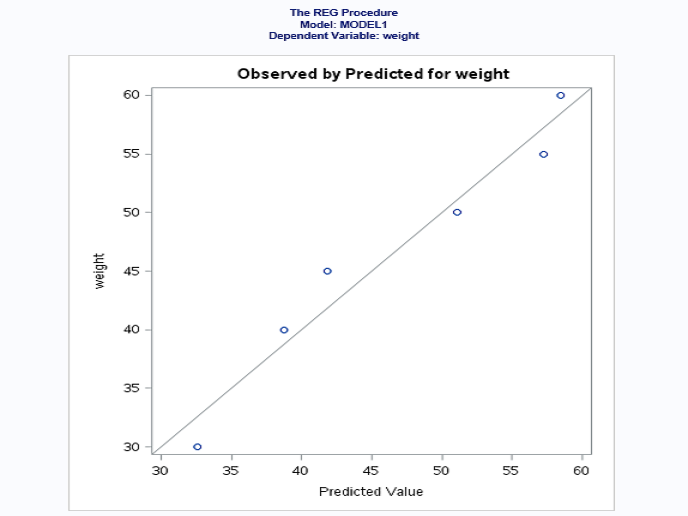
R-squared value is 0.9541 (95.41%) > 0.7 (70%). This means that your model is a good fit.
P value is 0.0008 < 0.05. This means that the height is a significant variable in your model.
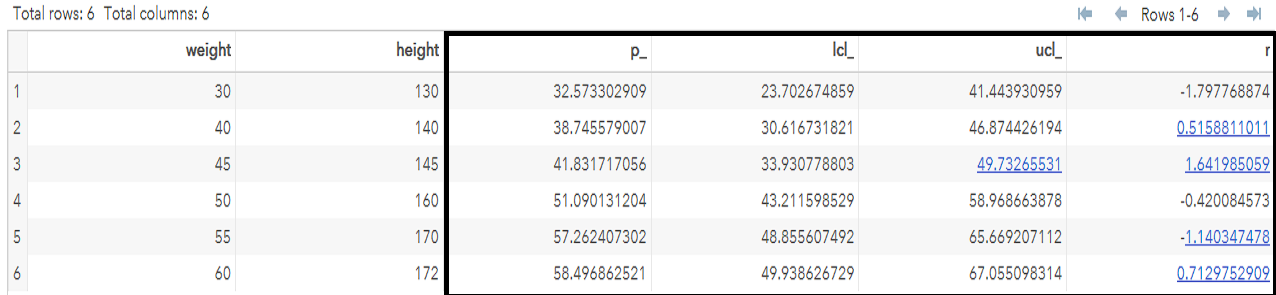
The value of r is calculated to know if there are any outliers in any observations. If the value of r is greater than 2 and less than -2, then that observation has outliers. (Note: -2 < r < 2.)
In this case, there is no observation that falls under the outliers range. ucl is upper confidence limit and lcl is lower confidence limit.
Final Conclusion
The weight of the person is explained 95% by a significant variable (height).
Multiple Linear Regression
Modeling and establishing the relationship between one dependent variable and two or more independent variables is known as Multiple Linear Regression.
y = β0 + β1x1 + β2x2 + β3x3 + ϵ
x1, x2,and x3 are independent variables.
y is a dependent variable.
β0 is constant.
β1, β2, and β3 are regression coefficients.
ϵ is an error.
Data realstate_data ;
input sales_price no_of_bedroom no_of_flats no_of_garrage;
datalines;
300000 1 10 2
400000 1 10 3
600000 2 5 2
800000 3 3 2
1000000 4 3 2
;
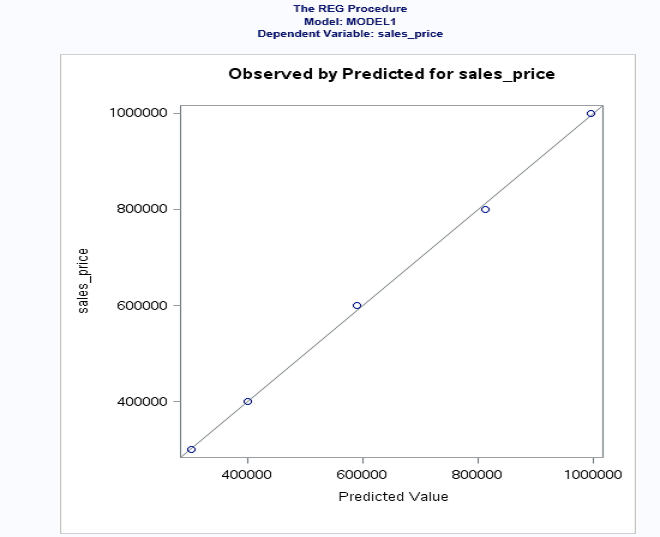
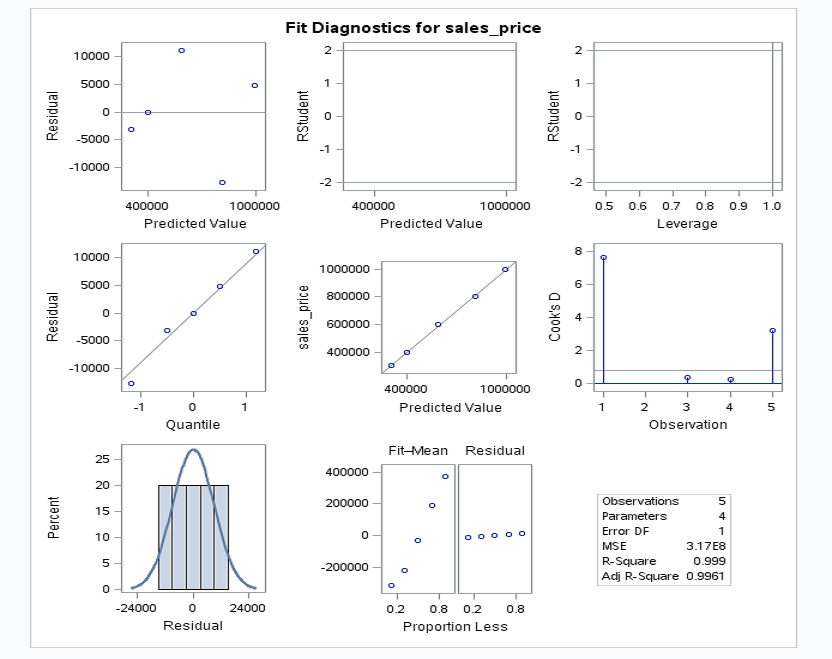
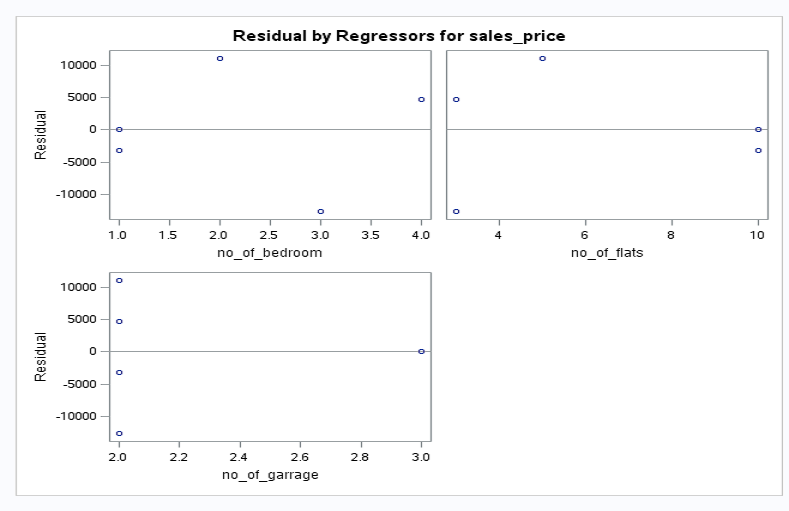
proc reg data=work.realstate_data alpha=0.05 plots(only)=(diagnostics residuals observedbypredicted);;
model 'sales_price'n='no_of_bedroom'n 'no_of_flats'n 'no_of_garrage'n /;
output out=WORK.realstate_data_stats p=p_ lcl=lcl_ ucl=ucl_ rstudent = r ;
run;
quit;sales_priceis the dependent variable.no_of_bedroom,no_of_flats, andno_of_garrageare independent variables.
Output
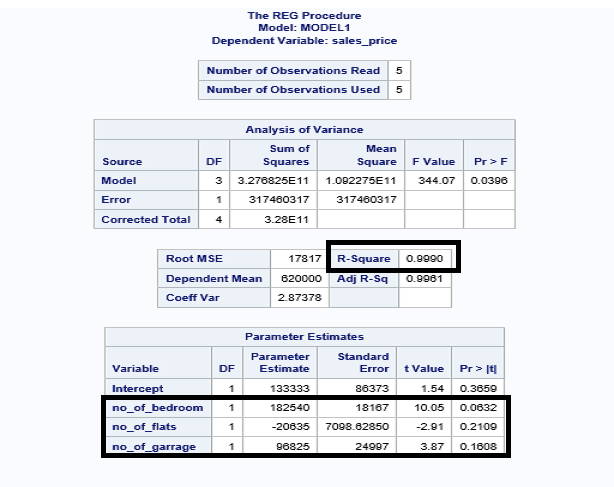
The value of R-squared is 0.9990 (99.99%) > 0.7 (70%). This means that your model is a good fit.
The value of P for all independent variables is > 0.05, so there's no significant variable in your model.
I hope this article gives you understanding for implementing linear regression with SAS.
Opinions expressed by DZone contributors are their own.
Comments