Beyond Static Thresholds: Building Self-Healing Systems via Context-Aware Control Loops
Static thresholds fail in complex distributed systems. This article introduces a context-aware control loop architecture to isolate failures and automate recovery.
Join the DZone community and get the full member experience.
Join For FreeAbstract
Modern distributed systems rarely fail in isolation — they degrade across multiple execution steps. This article presents a control-loop-based architecture for building self-healing systems that detect anomalies early, precisely isolate failures, and automatically recover using context-aware decisions.
Introduction
Modern distributed systems are large-scale platforms built on service-oriented architecture. In such systems, an individual request — the unit of execution — typically flows through multiple services, including clients (request initiators), orchestrators, enrichment layers, validation or policy-evaluation systems, routing layers, downstream dependencies, state management systems, reconciliation processes, and notification systems.
Each service in this chain introduces latency, retries, dependencies, and failure modes. Because of this, failures in distributed systems rarely appear as clean, isolated events. Instead, they emerge as a sequence of interacting issues that create a cascading effect across the system. For example, a downstream dependency may become slow in a specific region. This increases retries, which in turn increases queue depth. The growing queue depth puts pressure on the orchestrator, eventually causing it to fail unrelated requests due to resource saturation. What initially was a local dependency problem rapidly turned into a widespread degradation of workflow.
This problem is particularly difficult in asynchronous systems, where failures are not always instantly visible. A request may not fail instantly — it may remain pending, miss its expected execution window, be delayed in execution, get stuck in an intermediate state, or lose coordination between system components. When the operator detects the issue, the impact could already be large enough. However, traditional protection mechanisms such as fixed failure thresholds, static alerts, and global circuit breakers are often too coarse-grained for these scenarios. A localized dependency failure should not halt the entire system. At the same time, localized issues must not be allowed to trigger storms or cascade into otherwise healthy execution paths.
The goal, therefore, is to build a self-healing control system that can detect anomalies at the level of individual requests, aggregate signals across execution and system dimensions, isolate only the affected scope, and recover gradually based on real-time evidence. This post presents such a system. It is designed to provide predictive anomaly detection, hierarchical aggregation, scoped and global kill switches, adaptive leaky-bucket flow control, observability, and AI-assisted investigation and escalation.
| feature | static thresholds (old way) | context-aware loops (new way) |
|---|---|---|
| Detection | Static Thresholding | Predictive Anomaly Detection |
| Containment | Global | Scoped |
| Control | Binary Shutdown | Adaptive Flow Control |
| Recovery | Manual | Evidence-Based Self-Healing |
Why Traditional Systems With Static Thresholds Won’t Work
Most distributed systems rely on mechanisms like retries, dead-letter queues, alerts, and circuit breakers. These are useful but not enough for complex async workflows as they depend on static thresholds, which are context-blind by nature.
A rule like “trigger an alert when failures exceed X%” cannot distinguish between fundamentally different types of failures:
- Logical failures, where a request completes but produces an incorrect result due to issues in input, configuration, or application logic
- Execution failures, where a request produces no result due to delays, retries, or loss of coordination across system components
For example, in an AI inference system, a request may return an incorrect response due to model configuration issues (logical failure), or it may be accepted but never complete due to stalled execution in downstream components (execution failure).
Static thresholds treat both cases uniformly, even though they require very different responses. As a result, systems either overreact to expected failures or miss critical anomalies such as stuck or silently failing requests. Failure volume alone is also a weak signal. A small number of failures could be highly significant if those requests were anticipated to be successful. For instance, if requests following the same execution path have historically resulted in high reliability, even a few failures in that cohort can imply a serious issue.
Static thresholds also lack scope awareness. A local failure example, requests routed through a particular execution path, dependency, or region, should not cause a global shutdown. However, a pattern of small anomalies across different paths, regions, or request classes could indicate a larger systemic problem, even if no single threshold is crossed. For instance, in an inference system, requests served by a specific model variant may observe increased latency or degraded outputs due to recent changes to configurations or parameters, while other models and request paths continue to function normally.
These limitations are amplified in asynchronous systems, where failures are not always specific. Coordination gaps can cause requests to be stuck, delayed, retried multiple times, or enter into inconsistent states. This leads to higher latency, missed completion signals, or repeated retries with no progress. These weaknesses are further revealed during recovery. AI Agents or operators have to manually inspect logs and dashboards to determine when to resume traffic, resulting in inconsistent performance, slowness, and reactive recovery. In summary, these challenges demonstrate that static thresholding is not sufficient for modern distributed systems. What is needed is a system that understands request context, expected behavior, and the scope of the anomaly. This leads to a fundamental shift in system design:
- Static thresholding → Predictive anomaly detection
- Global containment → Scoped containment
- Binary shutdown → Adaptive flow control
- Manual recovery → Evidence-based self-healing
Instead of asking: Are requests failing?
The system should ask: Are requests behaving as expected within their defined SLA, given their execution context and expected outcomes?
System Architecture as a Control Loop
The system functions as a control loop during request execution. It does not replace the execution path. Instead, it constantly monitors the system's behavior, predicts expected outcomes, identifies deviations, and makes control decisions based on real-time signals.
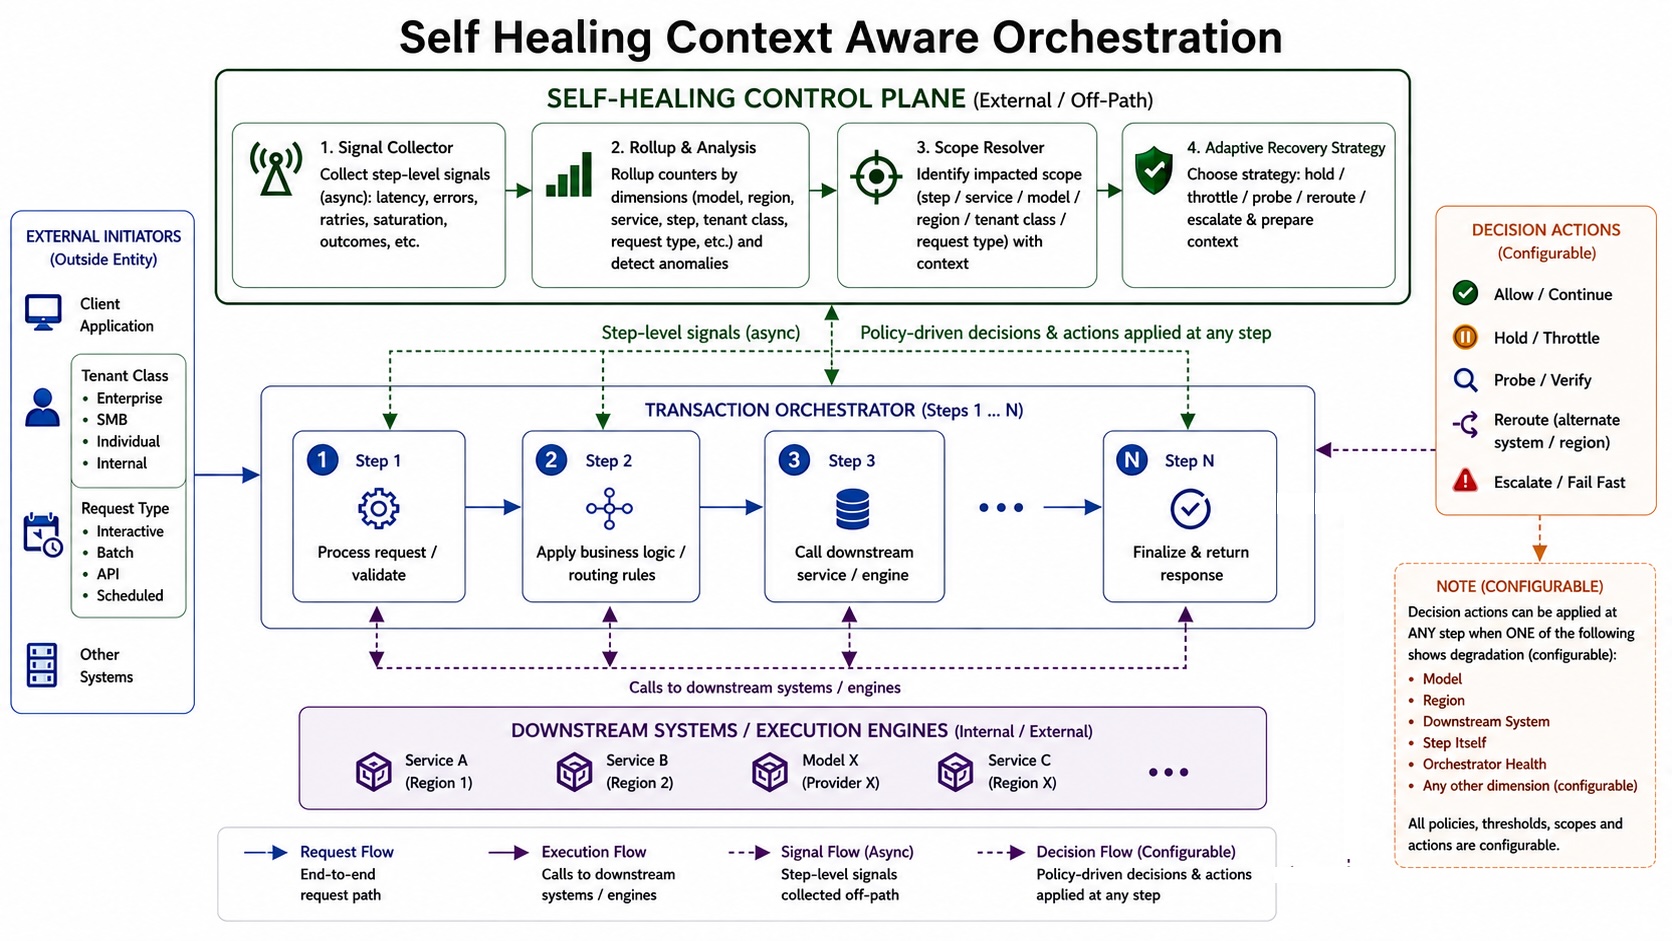
Orchestrated Execution With Continuous Monitoring
A primary orchestrator drives the system. It executes each request through a series of steps. At each step, the orchestrator calls on one or more downstream systems, either synchronously or asynchronously. These downstream systems may have their own dependencies. As the request moves forward, it carries contextual metadata like tenant class, region, request type, execution path, and routing decisions. This context defines how the request should behave at each step or at a specific point. While the orchestrator manages execution, anomaly detection serves as a continuous control layer throughout these steps. It tracks the outcome of each phase to ensure that the request moves forward as expected and that the contextual integrity remains intact.
Context Preservation and Signal Collection
At every step, the system captures signals such as latency, retries, routing decisions, execution status, and downstream responses. It also augments the request with derived attributes such as execution path identifiers and historical behavior patterns. This ensures that each request is evaluated relative to similar cohorts, and more importantly, allows the system to identify where deviations occur within the execution flow — not just whether the request ultimately fails.
Success Prediction Engine
Intuition: The system learns what 'normal' looks like for similar requests and uses that to estimate expected outcomes. The system estimates how likely a request is to succeed based on its context and historical behavior. For each request i, the expected success is computed as:
P_i = P(success | x_i)

Where:
x_i = request features (context, routing path, system state)
P_i = expected probability of success
This establishes what should happen at different stages of execution, allowing the system to detect deviations between expected and actual outcomes throughout the request lifecycle.
Step-Level Anomaly Detection
Unlike traditional systems that evaluate only final success or failure, this system continuously monitors each critical step of execution. A request may:
- Be accepted but delayed
- Be routed to an unexpected path
- Experience retries at a specific step
- Produce degraded output
- Fail to progress beyond a step
By evaluating these signals against expected behavior for that request’s context, the system can detect anomalies early and pinpoint the exact step where deviation occurs.
Inference Example (Grounding)
For example, in an inference system, the orchestrator can direct a request from a certain tenant class to a summarization model in a certain subnet of a region. If that subnet/region experiences network latency, requests may still be accepted and processed, but exhibit higher latency or delayed responses. In this case, the orchestrator continues execution, but a specific step — model execution in that region — is deviating from expected behavior. Other models or regions may continue to function normally.
Hierarchical Roll-up Counters
The hierarchical roll-up model aggregates anomalies across multiple contextual dimensions. When a request deviates from expected behavior at any step, the system updates counters across relevant dimensions such as dependency, execution path, tenant class, and region.
Example roll-ups:
(dependency, request_type)
(dependency,request_type, tenant_class)
(dependency, region)
(execution_path, request_type)
(global)
A single anomalous request may update multiple roll-ups simultaneously. For example, a request routed to a summarization model in a latency-affected region may update:
(summarizer_model, tenant_class_A, region_us_west)
(summarizer_model, region_us_west)
(summarizer_model, tenant_class_A)
(global)
This multi-dimensional view allows the system to isolate issues precisely while still capturing broader systemic patterns.
Roll-Up Configuration Model
Each roll-up is independently configurable, allowing the system to adapt thresholds and behavior based on the criticality of different execution paths and request classes.
Example configuration:
{
  "roll-up_id": "dependency_request_type_region",
  "dimensions": ["dependency", "request_type", "region"],
  "threshold": 25,
  "tumbling_window": "30m",
  "parent_roll-up_ids": [
    "dependency_region",
    "dependency_request_type",
    "dependency",
    "global"
  ],
  "control_action": "HOLD_AND_PROBE"
}
Key Fields
- dimensions → define how the rollup key is constructed
- threshold → anomaly count required to trigger
- tumbling_window → fixed evaluation window (e.g., 30 minutes)
- parent_rollup_ids → defines relationships across rollups
- control_action → action applied when this rollup becomes the resolved scope
Hierarchical Rollup Model (DAG)
The hierarchy is modeled as a directed acyclic graph (DAG). This allows a granular rollup to contribute to multiple parent views. For example:
(dependency=D1, request_type=TYPE_A, region=EU)
    → (dependency=D1, region=EU)
    → (dependency=D1, request_type=TYPE_A)
    → (dependency=D1)
    → (global)
A single anomalous request may update multiple rollups simultaneously, including both child and parent scopes.
Rollup Runtime State
At runtime, each rollup key maintains its own state within a tumbling window:
Rollup: (dependency, region)
Key: D1:EU
Window: 30 mins
Anomaly Count: 35
Threshold: 25 → FIRED
Each rollup evaluates independently:
- A child rollup may fire without the parent firing
- A parent rollup may fire when anomalies are distributed across multiple children
Parent Roll-up Escalation Guard
Since parent roll-ups aggregate signals, the system must prevent escalation caused by a single noisy child. Instead of maintaining a full child-level state, each parent tracks lightweight signals:
parent_anomaly_countimpacted_child_countmax_child_contribution_ratio
A parent roll-up is considered impacted only when:
parent_anomaly_count >= parent_threshold
AND impacted_child_count >= min_required_children
AND max_child_contribution_ratio <= max_allowed_ratio
Example: Do not escalate at the parent level if only the request Type_A is failing.
TYPE_A = 100 anomalies
TYPE_B = 0
TYPE_C = 0

Parent count = 100
Impacted children = 1
→ Keep control at child level
Example: Escalate.
TYPE_A = 40
TYPE_B = 35
TYPE_C = 25

Parent count = 100
Impacted children = 3
→ Escalate to parent scope
Why This Matters
This ensures:
- Localized issues remain scoped
- Distributed anomalies are escalated correctly.
- Noisy signals do not trigger unnecessary global actions
Anomaly Detection Engine
The anomaly detection engine identifies unexpected deviations by comparing predicted outcomes and actual results and propagates these signals to rollup counters. A request is marked anomalous only if it was expected to succeed but deviates from expected behavior:
Anomaly_i = 1 if P_i ≥ τ AND Y_i deviates from expected outcomeWhere:
- Pi = predicted success probability
- Yi = observed outcome (failure, delay, degraded output, etc.)
Each anomalous request updates multiple rollups across dimensions such as dependency, region, request type, and tenant class. The system evaluates all rollups that breach their thresholds and resolves the appropriate control scope.
It then:
- Deduplicates overlapping signals
- Selects the highest meaningful level in the hierarchy
- Avoids redundant or conflicting controls
This ensures:
- Localized issues remain scoped
- Correlated anomalies are elevated appropriately
- Duplicate control actions are avoided
Kill Switch Controller
The kill switch controller enforces control actions at the resolved anomaly scope. Based on severity and scope, it determines whether to:
- Stop new incoming requests within the scope
- Hold in-progress requests before critical downstream steps
- Allow controlled traffic via throttling or probing
Control Actions
ALLOW     → continue processing
HOLD      → pause new and in-progress requests
THROTTLE  → limit request rate
PROBE     → allow controlled traffic
REROUTE   → send via alternate path
ESCALATE  → trigger alerts / human intervention
The controller applies actions consistently across the resolved scope, ensuring full containment without partial or conflicting behavior.
Adaptive Recovery Strategy
Once a control action is applied, the system does not immediately resume normal traffic. Instead, it gradually reintroduces traffic using a probing strategy. For example:
Step 1: allow 1 request
Step 2: if successful (actual outcome == predicted outcome, allow 2
Step 3: if stable, allow 5
Step 4: gradually increase
Step 5: if failures reappear, reduce or stop
Recovery is guided by:
Recovery_G = Successful_G / Released_GWhere: G = impacted roll-up scope
This ensures:
- Safe and gradual recovery
- Avoidance of sudden failure spikes
- Validation of real system behavior
Observability and Audit Layer
The system captures all signals across execution:
- Predicted outcome
- Actual outcome
- Anomaly classification
- Impacted rollups
- Resolved scope
- Control action
- Recovery state
These signals provide visibility into:
- Anomaly trends
- Active control scopes
- Held vs released requests
- Recovery progress
This ensures full transparency, debuggability, and auditability.
AI Control Plane
The AI control plane operates outside the execution path and complements deterministic control logic. It consumes:
- Anomaly signals
- Roll-ups
- Deployment changes
- System health
- Control decisions
It performs:
- Investigation → correlates anomalies with systems or changes
- Automated remediation → triggers safe rollback
- Escalation → notifies relevant teams
- Summarization → generates incident insights
Key Separation
Decision Plane → deterministic (prediction, anomaly detection, control)
AI Control Plane → intelligent (analysis, remediation, escalation)
Conclusion
Modern distributed systems cannot rely on static thresholds and reactive controls. Failures are often contextual, asynchronous, and distributed across multiple execution paths. This architecture introduces a fundamental shift:
- From failure counting → context-aware detection
- From global shutdown → scoped containment
- From reactive response → adaptive, evidence-based recovery
By combining prediction, hierarchical rollups, scoped control, and adaptive recovery, the system can precisely isolate deviations, minimize impact, and restore stability safely.
The core idea is simple but powerful: Systems should not just detect failures — they should continuously understand system behavior, localize deviations in context, and adapt in real time to maintain reliability.
What’s Next: From Architecture to Code
Designing the architecture is only the first step. In the next post, we move from the blueprint to the technical implementation, diving deep into:
- The State Machine: Managing high-cardinality counters without latency and affecting execution path.
- The Escalation Guard: Pseudo-code to prevent "noisy neighbor" failures.
- Adaptive Recovery: The logarithmic logic for safe traffic re-introduction.
Stay tuned for the implementation deep-dive.
Case Study: Applying the Control Loop to a Multi-Region Inference System
End-to-end Example: Inference system with scoped control and adaptive recovery
This example illustrates how anomalies propagate, how scope is resolved, and how control and recovery are applied in an inference system.
Step 1: Incoming Requests
Requests are routed by the orchestrator to model services in the DUB region:
(model=summarizer_v2, tenant_class=A, region=DUB)
(model=translator_v1, tenant_class=A, region=DUB)
(model=qa_model_v3, tenant_class=A, region=DUB)
Predicted success:
Pi≈0.95+
Step 2: Deviations → Anomalies
Due to network degradation in DUB, requests begin to show:
- increased latency
- delayed responses
- occasional degraded outputs
Yi deviates and Pi≥τ⇒Anomalyi=1Y_i \text{ deviates and } P_i \geq \tau \Rightarrow Anomaly_i = 1.
Step 3: Roll-up Updates
Each anomalous request updates multiple rollups:
(summarizer_v2, tenant=A, DUB) → 40
(translator_v1, tenant=A, DUB) → 35
(qa_model_v3, tenant=A, DUB) → 25
(region=DUB)                 → 100
Step 4: Parent Escalation Guard
parent_count = 100
impacted_child_count = 3
max_child_ratio ≈ 40%
Since anomalies are distributed across multiple models, not concentrated in one:
→ Escalate to (region=DUB)
Step 5: Impact Resolution
Fired roll-ups:
(summarizer_v2, tenant=A, DUB)
(translator_v1, tenant=A, DUB)
(qa_model_v3, tenant=A, DUB)
(region=DUB)
Resolved scope:
(region=DUB)
Child rollups are de-duplicated and consolidated under the parent scope.
Step 6: Control (Scoped Isolation + Reroute + Local Probing)
Action:
HOLD_AND_PROBE + REROUTE
Effect:
- Throttle or hold most requests routed to DUB
- Reroute the majority of traffic to FRA only after verifying that the region has sufficient available capacity and is operating within stable limits.
- Allow a small number of low-impact requests to continue via DUB as probes
These probe requests validate whether the issue is transient or persistent without exposing the system to large-scale risk.
Step 7: Adaptive Recovery
Traffic is managed dynamically:
DUB (probe path): 1 → 2 → 5 → gradual increase
FRA (rerouted path): handles majority of traffic
Recovery signal:
RecoveryG = SuccessfulGReleasedGRecovery_G = \frac{Successful_G}{Released_G}
- If probe requests via DUB succeed → gradually restore DUB traffic
- If failures persist → continue routing to FRA and reduce DUB probes
Step 8: AI Control Plane
Based on observed signals:
- Regional network issue → continue routing to FRA
- Model deployment issue → rollback model version
- Infrastructure saturation → rebalance across regions
- Transient degradation → generate summary without escalation
Key Takeaways
- Failures are localized but distributed across models
- Control is applied at the correct scope (region-level)
- System avoids global shutdown
- Recovery is validated through controlled probing
- Traffic is dynamically rerouted and restored
The system does not simply stop traffic-it isolates the impacted scope, reroutes intelligently, and verifies recovery through controlled probing before storing normal behavior.
Opinions expressed by DZone contributors are their own.
Comments