Server Log Analysis: It's More Important Than Google Analytics
This article discusses the significance of analyzing the server logs. The author also demonstrates a server log dashboard created using the open source ELK Stack of Elasticsearch, Logstash, and Kibana.
Join the DZone community and get the full member experience.
Join For Free

this little script changed the world in november 2005:
![]()
why? as online marketing was becoming more and more popular with the increasing use of websites and online communities (as well as social media networks in the not-too-distant future), people needed to understand what was going on.
google had already released the advertising platform adwords in 2000 and had surpassed yahoo! in terms of search engine market share. now, google needed a way to tell people the exact sources of traffic to their websites as well as what the visitors were doing. enter google analytics . (of course, google offered this data in exchange for being able to collect certain information for the company’s own use.)
today, google analytics offers a lot of functionalities including e-commerce transaction information, campaign-specific utm parameters, and behavioral demographics. but in the end, google analytics still depends on that little script executing every time that a page is requested from a server.
and, as i explained at a presentation at mozcon in september 2016 as a regular marketing speaker , that does not always happen.
rates of analytics script blocking
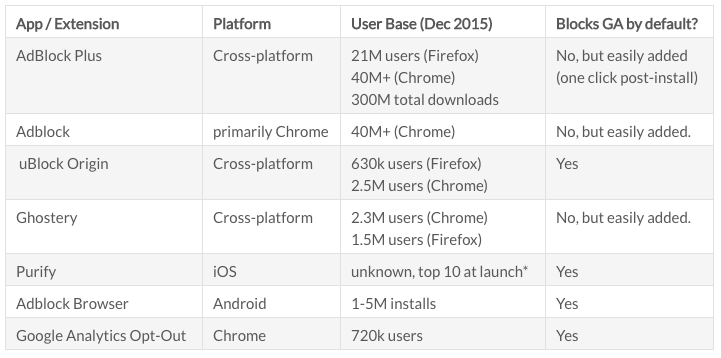
jason packer, the principal consultant at quantable, analyzed the issue in december 2015 and again in june 2016 and found the following:

just to summarize the data: more than 70 million people are estimated to be using at least one advertising blocker that either blocks google analytics by default or can be easily configured to do so. (plus, there are many other blockers in addition to these, the rates of ad block usage can be far higher for certain demographics, and packer notes that many browsers have a “do not track” http request header as well.)
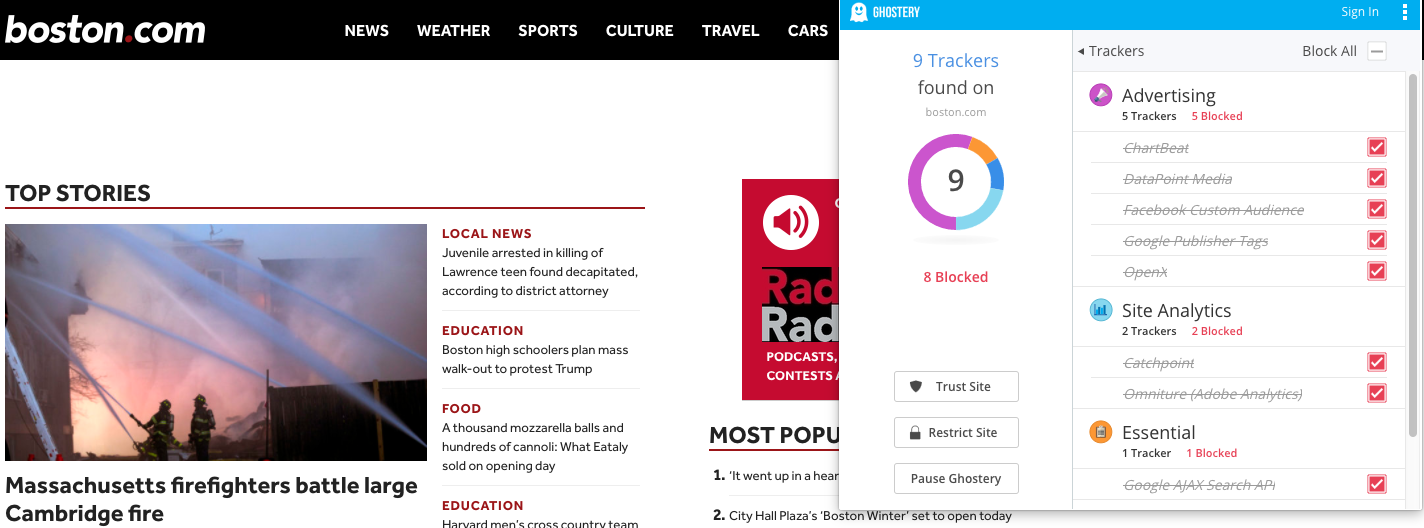
and it’s not only google analytics. take a look at the advertising and analytics scripts that are blocked by ghostery when i visit boston.com:

in short, the use of such platforms will become less and less effective as more and more people use ad and script blockers. (as i like to say, people tolerate offline advertising but hate online advertising.) plus, these analytics packages were never enough to monitor complete server activity in the first place.
the solution is to forget about the front end and go to the back end. the server log contains the only data that is one-hundred percent accurate in terms of how people — and even bots such as googlebot — are using your website and accessing your server.
server logs, not analytics scripts
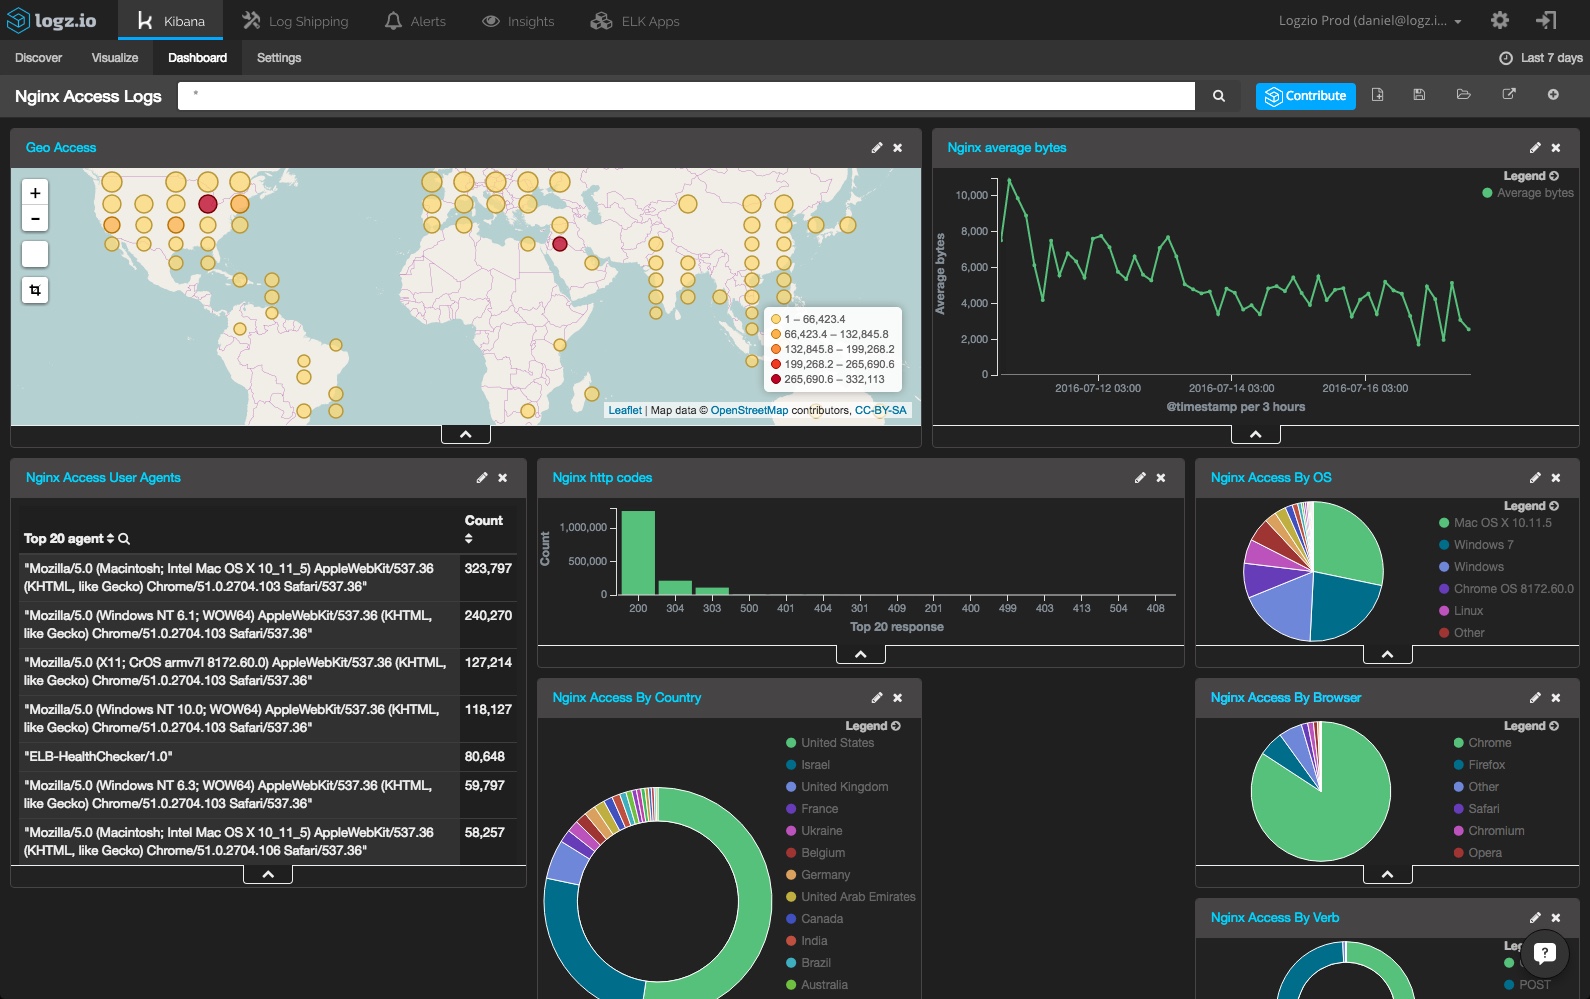
for our own purposes and to make sure that we have the correct analytics for our own website and server, we created a server log dashboard using the open source elk stack of elasticsearch, logstash, and kibana:

logstash collects our server logs and ships them into elasticsearch , which is a searchable database. then, kibana visualizes the data in elasticsearch as shown above.
for those who want to use the open source elk stack to monitor their server logs, we have created resources on apache , iis , and nginx log analysis with elk in addition to a guide to aws log analysis . these dashboards can track website and server activity that google analytics misses. in addition, we have free, pre-made dashboards for server log analysis in our elk apps library .
every time that a web browser requests something from a server, a log entry is created. here’s what one generally looks like:

a quick reference:
- white — the ip address in question
- blue — the timestamp of the specific log
- green — the access method (usually to “get” something such as an image file or to “post” something such as a blog post comment)
- red — the uniform resource identifier (uri) that the browser is requesting (this is usually a url)
- orange — the http status code (also called a response code)
- white — the size of the file returned (in this case, it is zero because no number is shown)
- purple — the browser and the user-agent that is making the request (in this instance, it is googlebot)
if your website receives 50,000 visitors a day and each person or bot views an average of ten pages, then your server will generate 500,000 log entries within a single log file every single day.
regardless of how you choose to monitor all of this server log data, here is a list of some of the items to check in terms of server and website performance. as you’ll see, a lot of the information is what google analytics purports to show — but the server log data will be a lot more complete and accurate.
server statistics to monitor
- visits, unique visitors, and visit duration
- times and dates of visits
- last crawl dates
- visitor locations
- the operating systems and browsers used
- response codes
business intelligence issues to check
advanced server monitoring can provide insights for business intelligence purposes:
- search-engine bot traffic. if the number of times that googlebot (or any other search-engine bot) suddenly drops, that could result in fewer indexed pages in search results and then in fewer visitors from organic search. check your robots.txt file and your meta-robots tags to see if you are inadvertently blocking these bots.
- crawl priorities. which pages and directories of your website get the most and least attention from search-engine bots and human visitors? does that match your business priorities? you can influence bot-crawl priorities in your xml sitemap and human navigation through your internal linking structure. you can move pages and directories that you want crawled more often closer to the home page, and you can have more internal links going there from the home page.
- last crawl date. if a recently published or updated page is not appearing in google search results, check for when google last visited that url in the server logs. if it has been a long time, try submitting that url directly in google search console.
- crawl budget waste. google allocates a crawl budget to every website. if googlebot hits that limit before crawling new or updated pages, it will leave the site without knowing about them. the use of url parameters often results in crawl budget waste because google crawls the same page from multiple urls. there are two solutions: block google in the robots.txt file from crawling all urls with any defined tracking parameters and use the url parameters tool in google search console to do the same thing.
- monitoring salesforce. although salesforce data is separate from server log data, salesforce information can be analyzed to monitor cross-team sales metrics for bi uses.
the point to remember: if you rely only on google analytics or any other platform that relies on front-end scripts, then you are seeing only part of the story as a result of the increasing use of script blockers. to analyze your complete server and website activity properly, you need to monitor your server log files directly.
Published at DZone with permission of Samuel Scott, DZone MVB. See the original article here.
Opinions expressed by DZone contributors are their own.

Comments