

Debugging a Spark Driver Out of Memory (OOM) Issue With Large JSON Data Processing
This article draws on real-world debugging experience and aims to provide insights into Spark's memory management challenges.
 ·
·
Join the DZone community and get the full member experience.
Join For FreeAs a data engineer, I recently encountered a challenging scenario that highlighted the complexities of Apache Spark memory management and Spark internal processing. Despite working with what seemed like a moderate dataset (25 GB), I experienced a driver Out of Memory (OOM) error that halted my data replication job.
In this article, I will discuss Spark's internal processing complexity and memory management that can help us build a resilient data replication solution.
Scenario
Let’s jump into the code snippet that is causing the OOM issue.
//Read all data files
val df = spark.read.json(allFiles: _*)

//Create DDBRecord dataset
val recordsDS: Dataset[DDBRecord] = df.map(
      row => Record.fromRow(row, dynamoDBPartitionKey, Option(dynamoDBSortKey)))

//Aggregate using custom aggregrator
val aggregatedDS = recordsDS.groupByKey{
    r => (r.ddbPartitionKey.orNull, r.ddbSortKey.orNull)
    }.agg(aggregator.toColumn.name("result"))

//Convert back to dataFrame from the transformed dataset
val resultDf = aggregatedDS.map(r => r._2.toRow)(RowEncoder.apply(df.schema))

if (resultDf.isEmpty) {
    return
}
//apply the net changes in the Apache Iceberg target
Our data file is DynamoDB exported data, which typically has rows containing Metadata, Keys, OldImage and NewImage. Our goal is to apply the net changes to the Apache Iceberg target. The objective of the code above is to determine net changes by keeping track of the oldest and newest images in the data files. For example, if there are multiple updates, we need to keep only the oldest (OldImage) and the latest (NewImage) data. We are using a custom model class (DDBRecord) and a custom aggregator to achieve this task.
Here are additional details about the data and infrastructure.
- Dataset: 25 GB of DynamoDB exported JSON data
- Cluster: 9-machine Glue Spark cluster (G.8X)
- Cluster Configuration:
- 32 vCPU per machine
- 128 GB memory per machine
The Unexpected Challenge
Surprisingly, while performing a simple isEmpty() operation on a transformed DataFrame, the Spark driver immediately threw an Out of Memory error. This was unexpected, given the seemingly modest data size and powerful cluster configuration.
As we know that Spark defers the execution of transformations until an action is called. In this scenario, Spark starts the execution when the action df.isEmpty is triggered. The driver is throwing an OOM error as part of executing this action.
Dive Deep
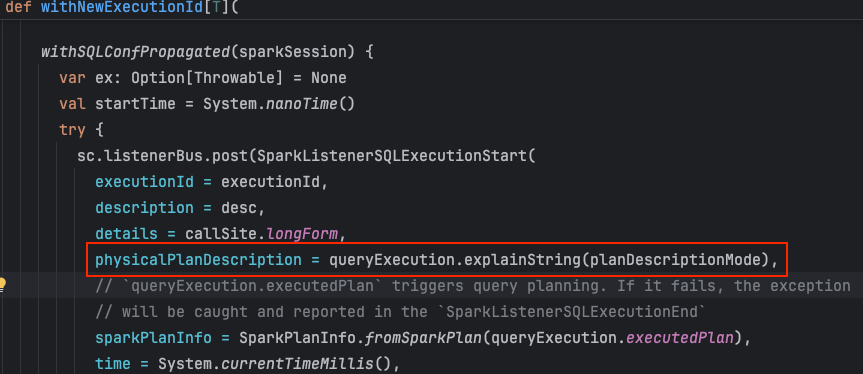
Below is a typical stack trace for an OOM issue where Spark experiences low memory and ultimately OOM when it tries to execute the action. As is evident from the stack trace, Spark calls explainString method to generate a plain text of the whole plan. It uses plain text for Spark events and logging purposes. You can control the plain text generation by setting config spark.sql.explain.mode to Simple, Formatted, Extended, etc.
Caused by: java.lang.OutOfMemoryError
    at java.lang.AbstractStringBuilder.hugeCapacity(AbstractStringBuilder.java:161)
    at java.lang.AbstractStringBuilder.newCapacity(AbstractStringBuilder.java:155)
    at java.lang.AbstractStringBuilder.ensureCapacityInternal(AbstractStringBuilder.java:125)
    at java.lang.AbstractStringBuilder.append(AbstractStringBuilder.java:448)
    at java.lang.StringBuilder.append(StringBuilder.java:141)
    at scala.collection.mutable.StringBuilder.append(StringBuilder.scala:203)
    at scala.collection.immutable.Stream.addString(Stream.scala:691)
    at scala.collection.TraversableOnce.mkString(TraversableOnce.scala:377)
    at scala.collection.TraversableOnce.mkString$(TraversableOnce.scala:376)
    at scala.collection.immutable.Stream.mkString(Stream.scala:760)
    at org.apache.spark.sql.catalyst.util.package$.truncatedString(package.scala:179)
    at org.apache.spark.sql.catalyst.expressions.Expression.toString(Expression.scala:307)
    at java.lang.String.valueOf(String.java:2994)
    at java.lang.StringBuilder.append(StringBuilder.java:136)
    at org.apache.spark.sql.catalyst.expressions.If.toString(conditionalExpressions.scala:105)
    at java.lang.String.valueOf(String.java:2994)
    at java.lang.StringBuilder.append(StringBuilder.java:136)
    at org.apache.spark.sql.catalyst.expressions.Alias.toString(namedExpressions.scala:213)
    at org.apache.spark.sql.catalyst.trees.TreeNode.formatArg(TreeNode.scala:918)
    at org.apache.spark.sql.catalyst.trees.TreeNode.$anonfun$formatArg$1(TreeNode.scala:911)
    at scala.collection.immutable.List.map(List.scala:297)
    at org.apache.spark.sql.catalyst.trees.TreeNode.formatArg(TreeNode.scala:911)
    at org.apache.spark.sql.catalyst.trees.TreeNode.$anonfun$argString$1(TreeNode.scala:931)
    at scala.collection.Iterator$$anon$11.nextCur(Iterator.scala:486)
    at scala.collection.Iterator$$anon$11.hasNext(Iterator.scala:492)
    at scala.collection.Iterator.foreach(Iterator.scala:943)
    at scala.collection.Iterator.foreach$(Iterator.scala:943)
    at scala.collection.AbstractIterator.foreach(Iterator.scala:1431)
    at scala.collection.AbstractIterator.addString(Iterator.scala:1431)
    at scala.collection.TraversableOnce.mkString(TraversableOnce.scala:377)
    at scala.collection.TraversableOnce.mkString$(TraversableOnce.scala:376)
    at scala.collection.TraversableOnce.mkString$(TraversableOnce.scala:379)
    at scala.collection.AbstractIterator.mkString(Iterator.scala:1431)
    at org.apache.spark.sql.catalyst.trees.TreeNode.argString(TreeNode.scala:949)
    at org.apache.spark.sql.catalyst.trees.TreeNode.simpleString(TreeNode.scala:956)
    at org.apache.spark.sql.catalyst.plans.QueryPlan.simpleString(QueryPlan.scala:402)
    at org.apache.spark.sql.catalyst.plans.QueryPlan.verboseString(QueryPlan.scala:404)
    at org.apache.spark.sql.catalyst.trees.TreeNode.generateTreeString(TreeNode.scala:1070)
    at org.apache.spark.sql.catalyst.trees.TreeNode.generateTreeString(TreeNode.scala:1098)
    at org.apache.spark.sql.catalyst.trees.TreeNode.generateTreeString(TreeNode.scala:1098)
    at org.apache.spark.sql.catalyst.trees.TreeNode.generateTreeString(TreeNode.scala:1098)
    at org.apache.spark.sql.catalyst.trees.TreeNode.treeString(TreeNode.scala:991)
    at org.apache.spark.sql.catalyst.plans.QueryPlan$.append(QueryPlan.scala:657)
    at org.apache.spark.sql.execution.QueryExecution.writePlans(QueryExecution.scala:284)
    at org.apache.spark.sql.execution.QueryExecution.toString(QueryExecution.scala:313)
    at org.apache.spark.sql.execution.QueryExecution.org$apache$spark$sql$execution$QueryExecution$$explainString(QueryExecution.scala:267)
    **at org.apache.spark.sql.execution.QueryExecution.explainString(QueryExecution.scala:246)**
    at org.apache.spark.sql.execution.SQLExecution$.executeQuery$1(SQLExecution.scala:107)
    at org.apache.spark.sql.execution.SQLExecution$.$anonfun$withNewExecutionId$7(SQLExecution.scala:139)
    at org.apache.spark.sql.catalyst.QueryPlanningTracker$.withTracker(QueryPlanningTracker.scala:107)
    at org.apache.spark.sql.execution.SQLExecution$.withTracker(SQLExecution.scala:224)
    at org.apache.spark.sql.execution.SQLExecution$.$anonfun$withNewExecutionId$6(SQLExecution.scala:139)
    at org.apache.spark.sql.execution.SQLExecution$.withSQLConfPropagated(SQLExecution.scala:245)
    at org.apache.spark.sql.execution.SQLExecution$.$anonfun$withNewExecutionId$1(SQLExecution.scala:138)
    at org.apache.spark.sql.SparkSession.withActive(SparkSession.scala:779)
    at org.apache.spark.sql.execution.SQLExecution$.withNewExecutionId(SQLExecution.scala:68)
    at org.apache.spark.sql.Dataset.withAction(Dataset.scala:3920)
    at org.apache.spark.sql.Dataset.isEmpty(Dataset.scala:3201)
    ... 16 more
But why does Spark explain the plan during execution?
Spark needs to generate a plan string representation for logging, Spark UI, optimization, and debugging purposes. Spark has an internal event bus where this information is sent for other components to act on. For example, Spark UI listens to the event bus and uploads the event for Spark UI rendering. Whenever an action is invoked, Spark materializes the logical plan and determines the corresponding physical plan for execution.
The code block below shows that Spark calls explainString to send it to the event bus.
Why would a plan string representation cause OOM?
On a further deep dive, we find that the generated plan spans multiple pages. There are two factors contributing to the massive plan. First, the schema size, and second, the dataset created from the DataFrame.
In our implementation, we are creating a dataset from a dataframe to produce net changes. The Spark dataset is a distributed collection of data that combines the benefits of RDDs and DataFrames. Since DataSet has schema + type safety, Spark adds null safety for every field. If we have nested attributes this type safety check is applied recursively making the whole plan a giant string. Below is a typical part of the plan when an attribute Key from dataframe is used to represent the same in a dataset. Type safety checks make the plan string representation bigger.
createexternalrow(if (isnull(Keys#786)) null else createexternalrow(if (Keys#786.isNullAt) null else if (isnull(Keys#786.uuid)) null else createexternalrow(if (Keys#786.uuid.isNullAt) null else Keys#786.uuid.S.toString, StructField(S,StringType,true)), StructField(uuid,StructType(StructField(S,StringType,true)),true))
It is fine to generate a plan. However, storing the plain-text representation of the plan is expensive and causes memory issues when the source schema itself is big. The Spark Jira issue mentions the same OOM issue that we are facing.
In Spark, there are two properties to control the plan generation maxToStringFields or maxPlanStringLength. These properties only affect the formatting or truncate output; they don’t control the traversal itself.
Deep Dive Conclusion: Spark plan text representation is massive due to dataset internal representation and Spark traversal of generating a plan. This is contributing to a significant memory drop and, in some cases, OOM.
What Is the Fix?
Our investigation indicates that the current implementation creates a DataSet from a DataFrame, and its internal representation is massive when Spark represents the plan as a plain string. We have a couple of options to reduce the memory footprint to address the issue.
We need a plan for debugging purposes, but not at the cost of compromising the functionality. We would prefer to turn the explain plan off to address the low memory issue. However, this feature is not available in Spark. This pull request talks about having Off mode.
We work on optimizing our implementation, where we will not create a DataSet because the DataSet's internal representation is contributing to the massive string representation of the plan. Below is the equivalent code to compute the net changes using dataframe operations only. Essentially, we group records by key (sorted by timestamp) and pick the oldImage and newImage for net changes.
//Instead of using dataset, perform dataframe aggregation only.
val df = spark.read.json(allFiles: _*)

df.groupBy(keyColumns: _*)
.agg(
  min_by(col("OldImage"), col("_write_ts")).as("_earliest_old"),
  max_by(col("NewImage"), col("_write_ts")).as("_latest_new"),
  max_by(col("Keys"), col("_write_ts")).as("_final_keys"),
  max_by(col("Metadata"), col("_write_ts")).as("_final_metadata")
      )
if (df.isEmpty) {
    return
}
//proceed with the rest
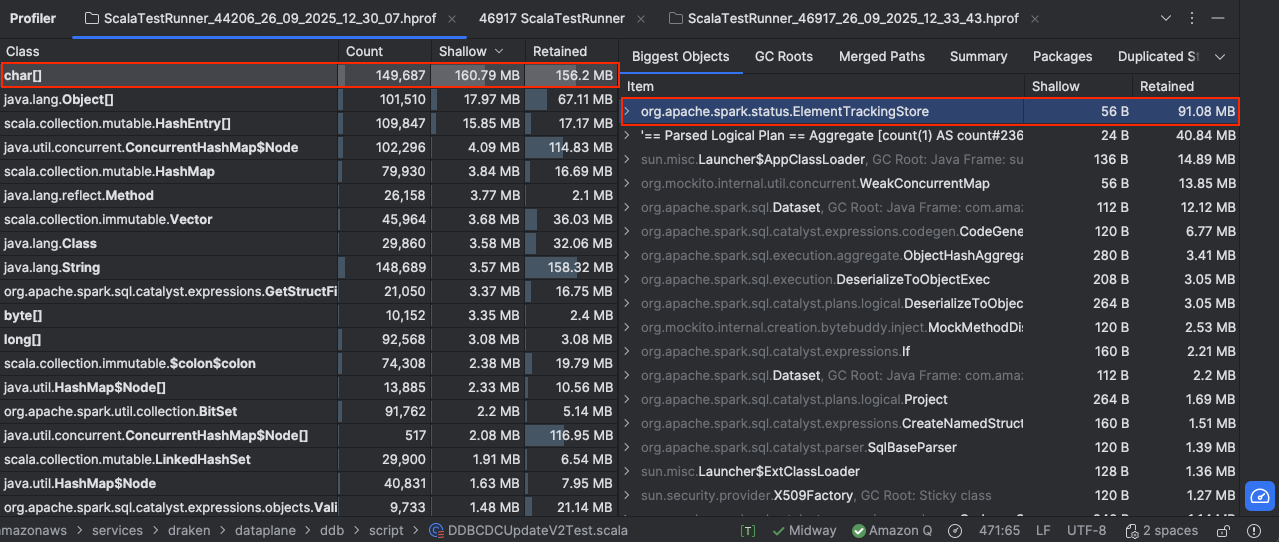
My local testing clearly shows significant improvement in memory consumption after the fix.
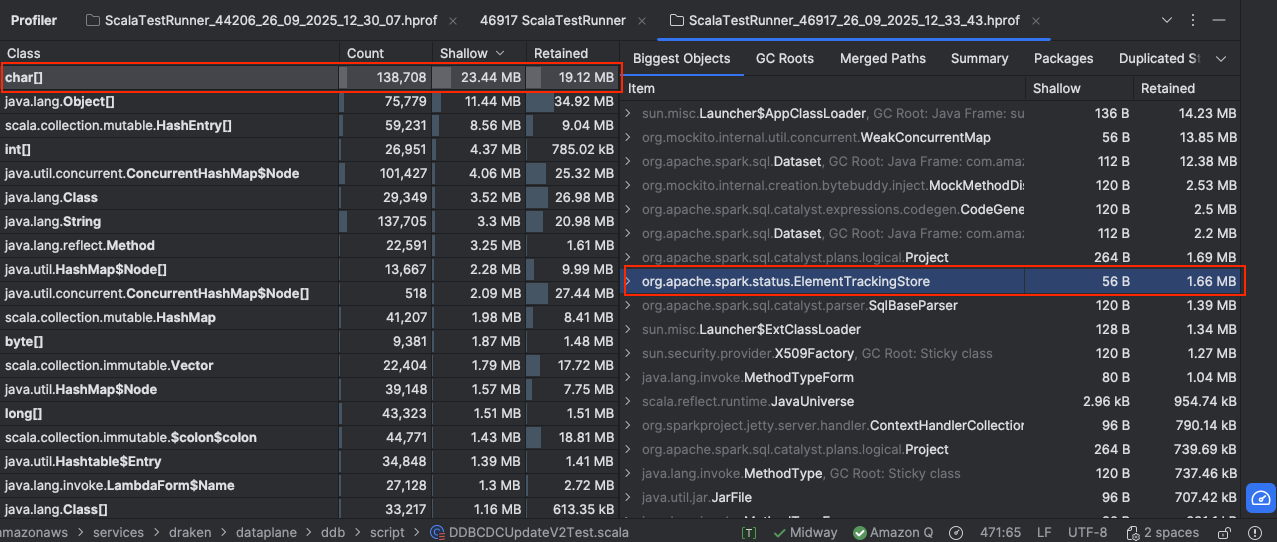
The image below shows the object size during execution.
After the fix, the object size has reduced drastically.
Quick Rules of Thumb for OOM
- Driver → User Memory risk:
- Anything that pulls results back (
collect,show,takelarge n). - Anything that expands metadata (schema explosion, file listing).
- Anything that pulls results back (
- Executor → Unified Memory risk:
- Anything that redistributes data (
join,groupBy, shuffle). - Caching or broadcast of large datasets.
- Anything that redistributes data (
The table below helps you narrow down the investigation.
| Aspect | Driver | Executor |
|---|---|---|
| Schema, Logical/Physical Plans | Lives in User Memory | Not relevant |
| File Metadata (S3 file listing, partition info) | User Memory | Not relevant |
| Task Scheduling Metadata | User Memory | Not relevant |
Row Collection (collect(), count(), isEmpty()) |
Results land in User Memory | Executors compute them |
| Shuffle Buffers, Joins, Aggregations | Minimal at driver (control plane only) | Unified Memory |
| Caching (persist, broadcast) | Broadcasts take Storage Memory | Cached data in executors takes Storage Memory |
| UDF Execution | Rare (only if driver executes an action locally) | Executors run UDFs in Execution/User Memory |
| OOM Cause | Often schema explosion, collect(), file listing, huge plan | Often shuffle/join spill, skew, insufficient execution memory |
Conclusion
Memory management in Spark is nuanced. Even seemingly simple operations can lead to unexpected memory challenges. I would advise keeping track of memory usage and using appropriate configuration and improvements to make a reliable data processing solution.
Opinions expressed by DZone contributors are their own.
Comments