DZone
Thanks for visiting DZone today,
Edit Profile
  • Manage Email Subscriptions
  • How to Post to DZone
  • Article Submission Guidelines
Sign Out View Profile
  • Post an Article
  • Manage My Drafts
Over 2 million developers have joined DZone.
Log In / Join
Refcards Trend Reports
Events Video Library
Refcards
Trend Reports

Events

View Events Video Library

Zones

Culture and Methodologies Agile Career Development Methodologies Team Management
Data Engineering AI/ML Big Data Data Databases IoT
Software Design and Architecture Cloud Architecture Containers Integration Microservices Performance Security
Coding Frameworks Java JavaScript Languages Tools
Testing, Deployment, and Maintenance Deployment DevOps and CI/CD Maintenance Monitoring and Observability Testing, Tools, and Frameworks
Culture and Methodologies
Agile Career Development Methodologies Team Management
Data Engineering
AI/ML Big Data Data Databases IoT
Software Design and Architecture
Cloud Architecture Containers Integration Microservices Performance Security
Coding
Frameworks Java JavaScript Languages Tools
Testing, Deployment, and Maintenance
Deployment DevOps and CI/CD Maintenance Monitoring and Observability Testing, Tools, and Frameworks

Last call! Secure your stack and shape the future! Help dev teams across the globe navigate their software supply chain security challenges.

Modernize your data layer. Learn how to design cloud-native database architectures to meet the evolving demands of AI and GenAI workloads.

Releasing software shouldn't be stressful or risky. Learn how to leverage progressive delivery techniques to ensure safer deployments.

Avoid machine learning mistakes and boost model performance! Discover key ML patterns, anti-patterns, data strategies, and more.

Related

  • Smart Routing Using AI for Efficient Logistics and Green Solutions
  • Revolutionizing Healthcare Decision-Making Through Explainable AI
  • Concurrency-Safe Execution Using Ballerina Isolation
  • SQL Phenomena for Developers

Trending

  • Breaking Bottlenecks: Applying the Theory of Constraints to Software Development
  • Unlocking AI Coding Assistants Part 3: Generating Diagrams, Open API Specs, And Test Data
  • Integrating Security as Code: A Necessity for DevSecOps
  • Unlocking the Potential of Apache Iceberg: A Comprehensive Analysis
  1. DZone
  2. Data Engineering
  3. Databases
  4. Spotting Outliers With Isolation Forest Using sklearn

Spotting Outliers With Isolation Forest Using sklearn

In this post we take a look at how to detect outliers in your data using the isolation forest algorithm. Read on for the details!

By 
Giuseppe Vettigli user avatar
Giuseppe Vettigli
·
Oct. 10, 17 · Tutorial
Likes (2)
Comment
Save
Tweet
Share
28.2K Views

Join the DZone community and get the full member experience.

Join For Free

Isolation forest is an algorithm to detect outliers. It partitions the data using a set of trees and provides an anomaly score looking at how isolated the point is in the structure found. The anomaly score is then used to tell apart outliers from normal observations. In this post we will see an example of how IsolationForest behaves in simple case. First, we will generate one-dimensional data from bimodal distribution, then we will compare the anomaly score with the distribution of the data and highlighting the regions considered where the outliers fall.

To start, let's generate the data and plot the histogram:

import numpy as np
import matplotlib.pyplot as plt

x = np.concatenate((np.random.normal(loc=-2, scale=.5,size=500), 
                    np.random.normal(loc=2, scale=.5, size=500)))

plt.hist(x, normed=True)
plt.xlim([-5, 5])
plt.show()

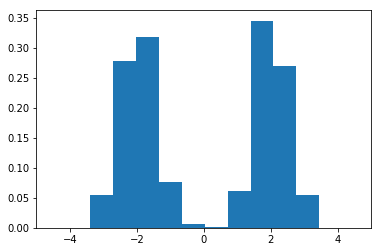
Here, we note that there are three regions where the data has low probability to appear: one on the right side of the distribution, another one on the left, and another around zero. Let's see if using IsolationForest we are able to identify these three regions:

from sklearn.ensemble import IsolationForest

isolation_forest = IsolationForest(n_estimators=100)
isolation_forest.fit(x.reshape(-1, 1))

xx = np.linspace(-6, 6, 100).reshape(-1,1)
anomaly_score = isolation_forest.decision_function(xx)
outlier = isolation_forest.predict(xx)

plt.plot(xx, anomaly_score, label='anomaly score')
plt.fill_between(xx.T[0], np.min(anomaly_score), np.max(anomaly_score), 
                 where=outlier==-1, color='r', 
                 alpha=.4, label='outlier region')
plt.legend()
plt.ylabel('anomaly score')
plt.xlabel('x')
plt.xlim([-5, 5])
plt.show()

In the snippet above, we have trained our IsolationForest using the data generated, computed the anomaly score for each observation, and classified each observation as an outlier or non-outlier. The chart shows the anomaly scores and the regions where the outliers are. As expected, the anomaly score reflects the shape of the underlying distribution and the outlier regions correspond to low probability areas.

Forest (application) Isolation (database systems)

Published at DZone with permission of Giuseppe Vettigli, DZone MVB. See the original article here.

Opinions expressed by DZone contributors are their own.

Related

  • Smart Routing Using AI for Efficient Logistics and Green Solutions
  • Revolutionizing Healthcare Decision-Making Through Explainable AI
  • Concurrency-Safe Execution Using Ballerina Isolation
  • SQL Phenomena for Developers

Partner Resources

×

Comments

The likes didn't load as expected. Please refresh the page and try again.

ABOUT US

  • About DZone
  • Support and feedback
  • Community research
  • Sitemap

ADVERTISE

  • Advertise with DZone

CONTRIBUTE ON DZONE

  • Article Submission Guidelines
  • Become a Contributor
  • Core Program
  • Visit the Writers' Zone

LEGAL

  • Terms of Service
  • Privacy Policy

CONTACT US

  • 3343 Perimeter Hill Drive
  • Suite 100
  • Nashville, TN 37211
  • support@dzone.com

Let's be friends: