Detecting Plan Regression in SQL Server Using Query Store
A practical weighted baseline approach for detecting regressions by comparing recent workload performance against historical execution patterns.
Join the DZone community and get the full member experience.
Join For FreeWeighted Baseline Regression Pattern for Query Store
Plan regression in SQL Server usually shows up quietly. A query that has been stable for a long time suddenly becomes slower, even though there were no deployments, schema changes, or obvious infrastructure problems. In many cases, the issue is tied to an execution plan change caused by statistics updates, parameter sensitivity, changing data distribution, or normal optimizer behavior.
Problem
A common starting point is comparing "yesterday vs today" using average duration. While quick, this approach often does not reflect the full behavior of the workload
Query Store data is already summarized. By the time you hit sys.query_store_runtime_stats, SQL Server has grouped executions into time windows.
So a few things get lost pretty easily:
- A couple of bad executions don’t stand out
- Low traffic queries can look more important than they are
- Plan changes get mixed with normal variation
There are cases where the average duration appears stable, but individual executions show spikes of 20-30x. You won't see that unless you dig deeper.
Another thing — multiple plans don’t automatically mean trouble. This is normal behavior in SQL Server. Statistics updates, parameter sniffing, and memory pressure can all introduce plan changes without indicating a regression. The key question is whether performance actually degraded after a plan change.
Detection Pattern
The approach is to compare recent performance against a historical baseline, while filtering out low-frequency noise.
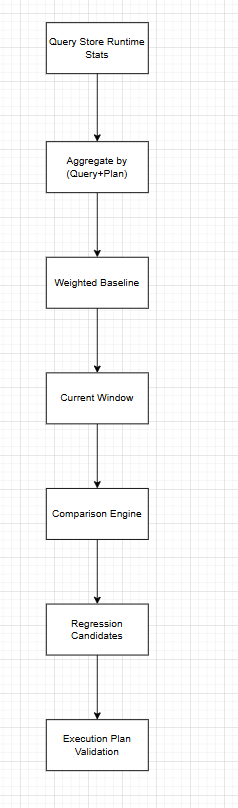
Architecture View
Start by looking at older data as your baseline:
SELECT
    q.query_id,
    p.plan_id,
    SUM(rs.avg_duration * rs.count_executions) * 1.0/ NULLIF(SUM(rs.count_executions), 0) AS baseline_duration
FROM sys.query_store_runtime_stats rs
JOIN sys.query_store_plan p ON rs.plan_id = p.plan_id
JOIN sys.query_store_query q ON p.query_id = q.query_id
WHERE rs.last_execution_time >= DATEADD(day, -7, getdate())
  AND rs.last_execution_time < DATEADD(day, -1, getdate())
GROUP BY q.query_id, p.plan_id
Then compare that with what’s happening now:
SELECT
    q.query_id,
    p.plan_id,
    SUM(rs.avg_duration * rs.count_executions) * 1.0/ NULLIF(SUM(rs.count_executions), 0) AS current_duration,
    SUM(rs.count_executions) AS exec_count
FROM sys.query_store_runtime_stats rs
JOIN sys.query_store_plan p ON rs.plan_id = p.plan_id
JOIN sys.query_store_query q ON p.query_id = q.query_id
WHERE rs.last_execution_time >= DATEADD(day, -1, getdate())
GROUP BY q.query_id, p.plan_id;
And then just combine the two queries and look for queries that got significantly slower:
WITH baseline AS
(
 		SELECT
        q.query_id,
        p.plan_id,
        SUM(rs.avg_duration * rs.count_executions) * 1.0/ NULLIF(SUM(rs.count_executions), 0) AS baseline_duration,
        SUM(rs.count_executions) AS baseline_exec_count,
        SUM(rs.avg_duration * rs.count_executions) AS baseline_total_duration
    FROM sys.query_store_runtime_stats rs
    JOIN sys.query_store_plan p
        ON rs.plan_id = p.plan_id
    JOIN sys.query_store_query q
        ON p.query_id = q.query_id
    WHERE rs.last_execution_time >= DATEADD(day, -7, getdate())
      AND rs.last_execution_time < DATEADD(day, -1, getdate())
    GROUP BY q.query_id, p.plan_id
),
current_perf AS
(
    SELECT
        q.query_id,
        p.plan_id,
        SUM(rs.avg_duration * rs.count_executions) * 1.0/ NULLIF(SUM(rs.count_executions), 0) AS current_duration,
        SUM(rs.count_executions) AS current_exec_count,
        SUM(rs.avg_duration * rs.count_executions) AS current_total_duration
    FROM sys.query_store_runtime_stats rs
    JOIN sys.query_store_plan p
        ON rs.plan_id = p.plan_id
    JOIN sys.query_store_query q
        ON p.query_id = q.query_id
    WHERE rs.last_execution_time >= DATEADD(day, -1, getdate())
    GROUP BY q.query_id, p.plan_id
)
SELECT
    c.query_id,
    c.plan_id,
    b.baseline_duration,
    c.current_duration,
    CAST(c.current_duration * 1.0 / NULLIF(b.baseline_duration, 0) AS DECIMAL(10,2)) AS slowdown_factor,
    b.baseline_exec_count,
    c.current_exec_count,
    b.baseline_total_duration,
    c.current_total_duration
FROM current_perf c
JOIN baseline b
    ON c.query_id = b.query_id
   AND c.plan_id = b.plan_id
WHERE
    c.current_duration > b.baseline_duration * 1.5
    AND c.current_exec_count > 20
    AND c.current_total_duration > 100000
ORDER BY slowdown_factor DESC;
Check the Plans
Once a query is identified, the next step is to verify whether the execution plan has changed.
SELECT
    q.query_id,
    p.plan_id,
    p.last_execution_time
FROM sys.query_store_plan p
JOIN sys.query_store_query q
    ON p.query_id = q.query_id
ORDER BY p.last_execution_time DESC;
If a new plan appears around the same time the performance degradation began, it is often the root cause.
Real-World Example
I've seen this in reporting systems. Query runs fine for weeks, around 150 ms.
Stats update happens, nothing else changes, and suddenly it’s over a second.
Same query, just a different plan. Query Store showed a join strategy change and worse estimates.
Forcing the old plan fixed it immediately. Then we went back and checked why stats pushed the optimizer in that direction.
EXEC sp_query_store_force_plan
    @query_id = 42,
    @plan_id = 10;
Conclusion
You don't really need a complex setup for this.
If you understand baseline vs current, and you actually look at execution plans instead of just averages, most regressions are pretty easy to spot.
Query Store already has everything. The key is to avoid overinterpreting simple averages and focus on meaningful workload changes.
Opinions expressed by DZone contributors are their own.
Comments