Tackling Production Issues in the Ballerina GraalVM Executable
This article is written using Ballerina Swan Lake Update 7(2201.7.0). We will explore how to engage standard tools to tackle production issues.
Join the DZone community and get the full member experience.
Join For FreeThe Ballerina GraalVM image, a performance-enhanced version of a Ballerina application that can be run as a native executable, offers improved performance and reduced memory consumption. However, like any application in production, issues can arise that impact its performance and reliability. In this article, we will explore how to analyze and resolve production issues that can occur with the Ballerina GraalVM image by delving into essential tools. We will discuss generating heap dumps and connecting a Ballerina GraalVM native application to Java Flight Recorder (JFR) for effective issue diagnosis and resolution.
Ballerina GraalVM Image is a native executable of a Ballerina application generated with the GraalVM native image tool. It leverages the capabilities of the GraalVM platform to compile the Ballerina code into a standalone executable, resulting in optimized performance and reduced memory footprint. To fully utilize the benefits of the Ballerina GraalVM Image, it is essential to be aware of potential production issues that can affect its performance.
In a production environment, various unexpected issues can impact the performance and reliability of the Ballerina GraalVM Image. Some common issues include memory leaks, deadlocks, and performance bottlenecks. Understanding and resolving these issues is crucial for ensuring the smooth operation of Ballerina GraalVM Image applications.
To analyze and resolve production issues, we rely on specific tools. Two essential tools for diagnosing and resolving issues with Ballerina GraalVM Image are heap dumps and Java Flight Recorder (JFR). Heap dumps provide snapshots of an application’s memory, capturing information about object allocation and memory usage, while JFR is a powerful profiling and diagnostic tool that provides detailed runtime information.
In this article, we will explore how to effectively use these tools with a Ballerina GraalVM Image. We will discuss generating heap dumps and demonstrate how to connect a Ballerina GraalVM native application to Java Flight Recorder. To illustrate the usage of these tools, we will work with a simple Ballerina program that can cause an out-of-memory issue, allowing us to explore the diagnosis and resolution process in practical scenarios.
Follow the following steps to create the application:
- Download and install Ballerina Swan Lake 2201.7.0 or greater
- Install GraalVM and configure it appropriately
- Install Visual Studio Code with Ballerina extension
- Open the command terminal in VS code and execute the following command to create a Ballerina application :
$ bal new ballerina_oom - Go to the
main.balfile inside theballerina_oomfolder and replace the content with the following:
public function main() {
   string[] arr = [];
   while true {
       arr.push("value");
   }
}- Generating heap dumps
- Connecting to Java Flight Recorder
Generating Heap Dumps With the Executable
We can create a heap dump of a running Ballerina GraalVM executable to monitor its execution. Similar to the heap dump of a Java application, it can be opened with the VisualVM tool.
To enable heap dump support, the Ballerina GraalVM executable should be built with the --enable-monitoring=heapdump option. Currently, heap dumps can be created in two different ways:
- Create heap dumps sending a
SIGUSR1signal at run time. - Dump the initial heap of the GraalVM image using the
-XX:HeapDumpAndExitrun-time option. (The GraalVM native image consists of two parts: the required libs and an initial heap, which is built at the native image build process.) - Create heap dumps with VisualVM.
Create Heap Dumps Sending a SIGUSR1 Signal at Run Time
GraalVM native image does not support generating heap dumps using Attach API yet. Currently, it is not possible to obtain heap dumps using JVM tools like jmap or jcmd . But we can send a SIGUSR1 signal to the process, which will automatically generate heap dumps for us.
Let’s build the Ballerina application with the --enable-monitoring=heapdump option. Run the following command inside the ballerina_oom folder.
$ bal build --graalvm --graalvm-build-options="--enable-monitoring=heapdump"
Note: The native image options can also be added in the Ballerina.toml . For more information, see Configure GraalVM native image build options.
Run the executable built in the target/bin directory.
$ ./target/bin/ballerina_oom
Find the process id of the application by running the following command.
$ ps

  PID TTY           TIME CMD
 4116 ttys001    0:11.62 ./target/bin/ballerina_oom
Send the SIGUSR1 signal to the process using the following command.
$ kill -SIGUSR1 4116
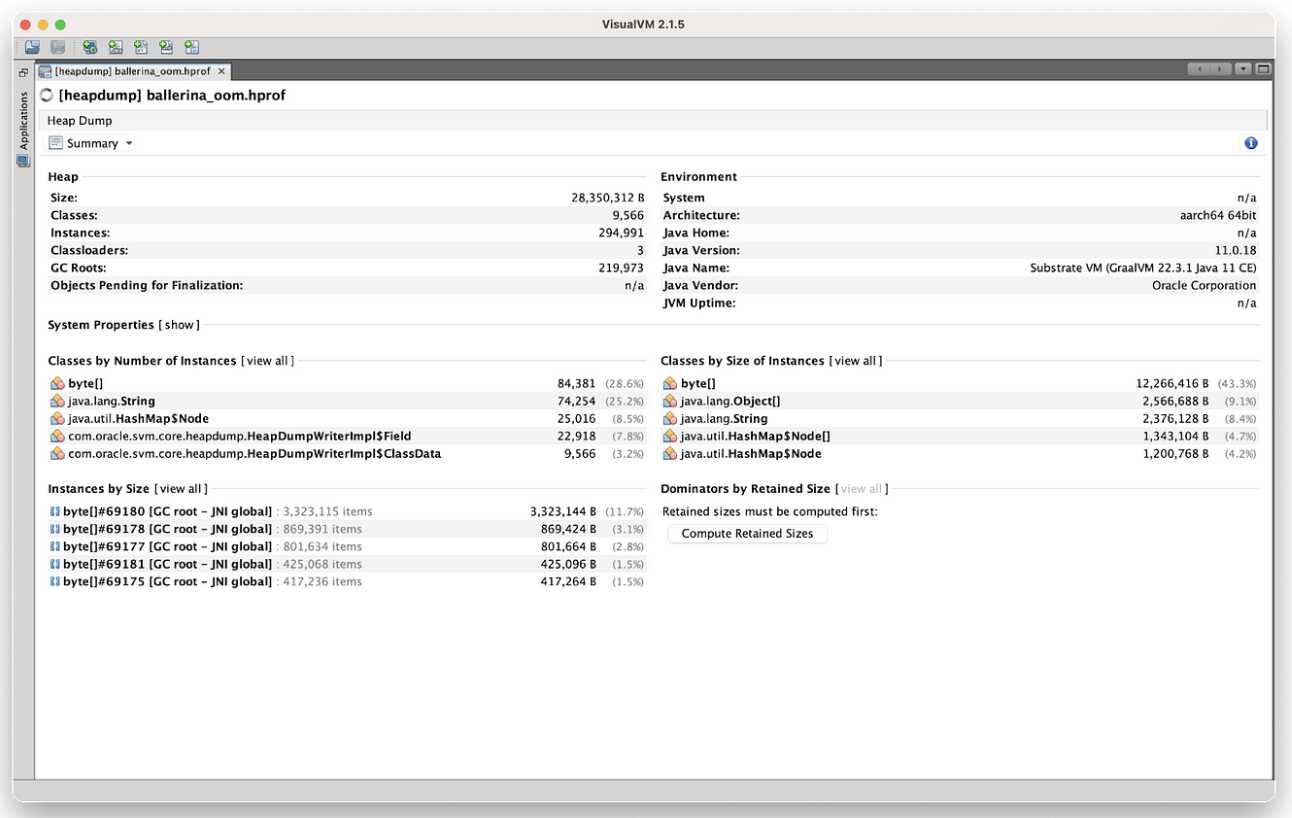
The heap dump will be created with the following name while the application continues to run: svm-heapdump-<process-id>-<timestamp>.hprof. The heap dump can be opened using VisualVM or Eclipse Memory Analyzer.
Dump the Initial Heap of the Executable
Now, let’s try to obtain the initial heap of the native image to see which objects are generated during the native image build process. Run the following command:
$ ./target/bin/ballerina_oom -XX:+DumpHeapAndExit
The initial heap will be dumped as ballerina_oom.hprof in the current directory.
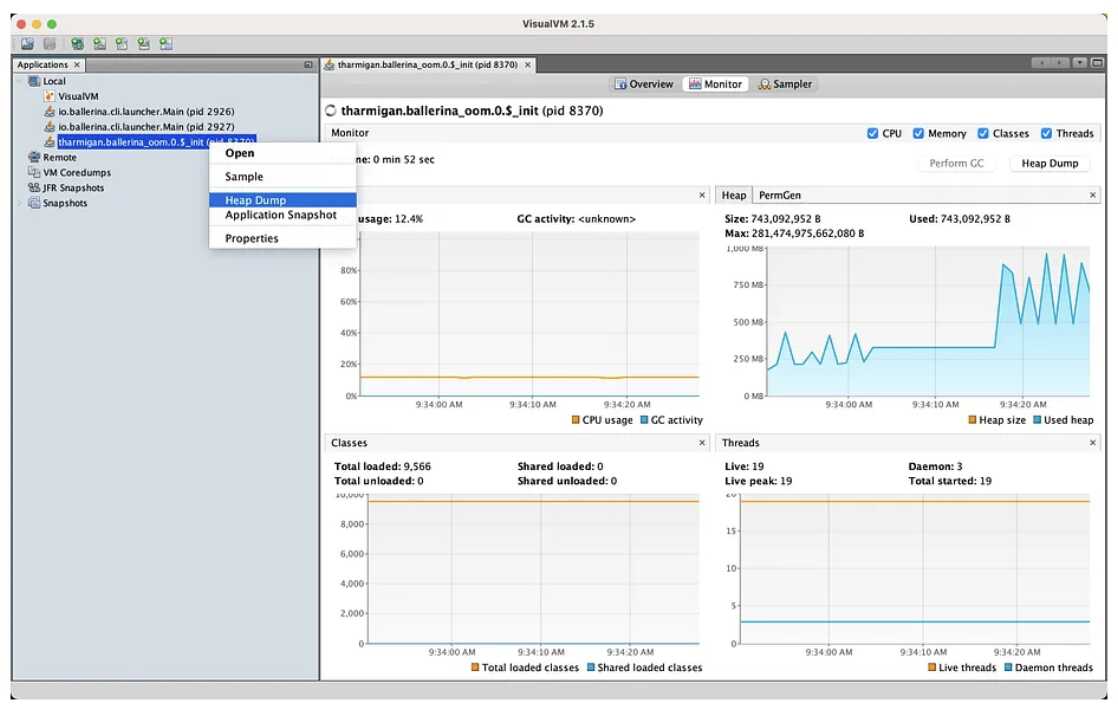
Create Heap Dumps With Visual VM
A convenient way to generate heap dumps is to use VisualVM. For this, you need to build with the --enable-monitoring=heapdump,jvmstat native image option. The additional jvmstat option will allow VisualVM to pick up and list running native executable processes. We can request the heap dumps just like Java processes(right-click on the process, then select Heap Dump).
Let’s build the Ballerina GraalVM executable by enabling heap dump and jvmstat. Run the following command inside the ballerina_oom folder:
$ bal build --graalvm --graalvm-build-options="--enable-monitoring=heapdump,jvmstat"
Run the executable and check the process in the VisualVM window.
$ ./target/bin/ballerina_oom
Note:
- Generating heap dump for a GraalVM native image is not supported on Windows.
- Generating heap dump when there is an Out-Of-Memory error is not yet supported with GraalVM images. For more information, see this GitHub issue.
- Ballerina GraalVM executable supports a set of run time arguments. To see all run the native executable with the following argument:
-XX:PrintFlags=.
Connecting to Java Flight Recorder(JFR)
To build a Ballerina GraalVM executable with the JFR event support, we have to build the Ballerina GraalVM executable with the --enable-monitoring=jfr option. Furthermore, at run time, we can start a recording, and configure logging using the following options:
-XX:+FlightRecorder: use to enable JFR at run time-XX:StartFlightRecording: use to start a recording on the application’s startup-XX:FlightRecorderLogging: use to configure the log output for the JFR system
Let's build the Ballerina GraalVM executable by enabling VM inspection. Run the following command inside the ballerina_oom folder:
$ bal build --graalvm --graalvm-build-options="--enable-monitoring=jfr"
Let's run the Ballerina executable while starting a recording on the startup (to stop the process with OOM, we can set the max heap size at the runtime using the -XX:MaxHeapSize= option).
$ ./target/bin/ballerina_oom -XX:+FlightRecorder -XX:StartFlightRecording="filename=ballerina_recording.jfr" -XX:MaxHeapSize=250
The recording will be created in the current directory with the name specified. To view the contents of the recording file, run this command:
$ jfr print ballerina_recording.jfr
The recording can be opened using VisualVM as well.
We can also incorporate JDK Mission control with JFR to monitor events, start flight recorders and generate heap dumps by specifying the -- enable-montioring=all option at build-time. This option will enable heapdump, jvmstat and jfr.
Monitoring the Native-Image Process in JDK Mission Control
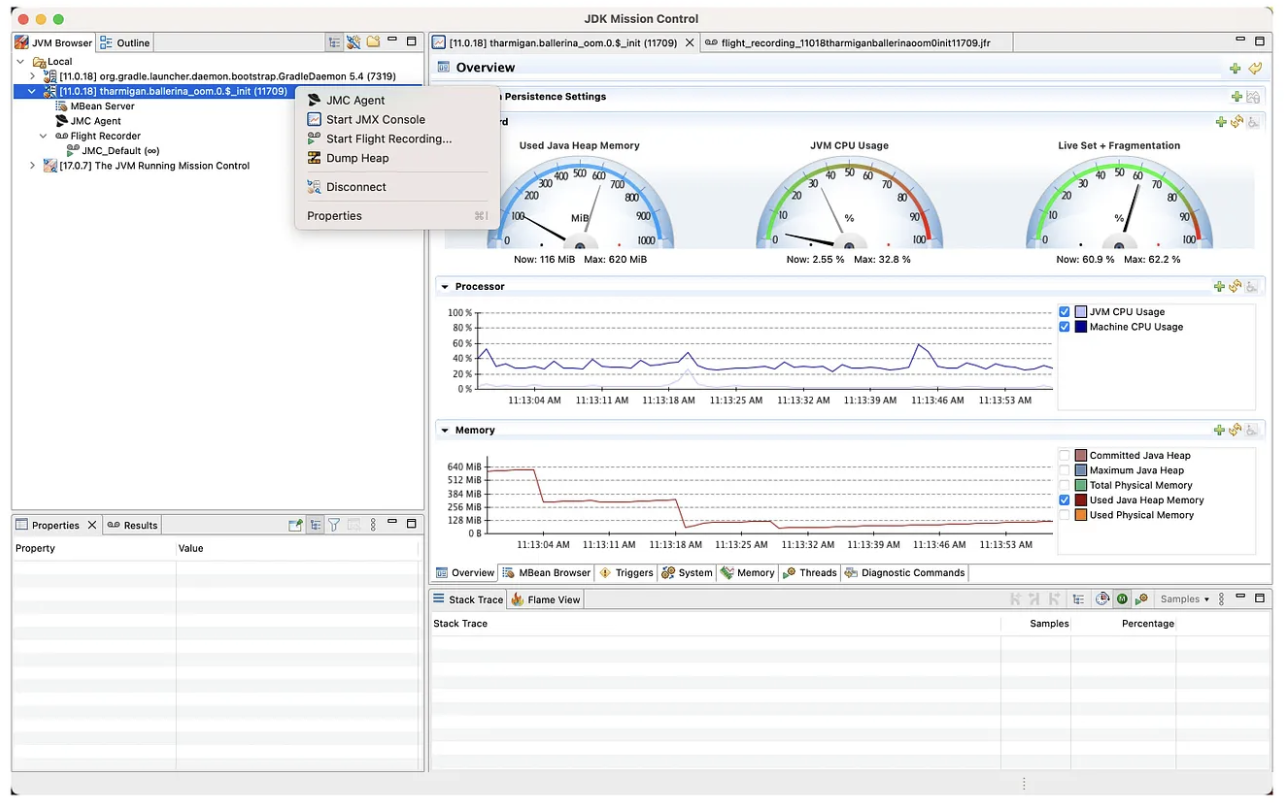
For more information on running a GraalVM native image with JFR, see Build and Run Native Executables with JFR.
In conclusion, the Ballerina GraalVM Image offers developers the ability to unlock enhanced performance and reduced memory consumption for their Ballerina applications. However, like any production environment, issues can arise that impact the performance and reliability of these applications. In this article, we have explored common production issues that can occur with the Ballerina GraalVM Image and introduced essential tools for analyzing and resolving these issues. With a comprehensive understanding of production issues and the utilization of tools like heap dumps and JFR, developers can overcome challenges, optimize performance, and ensure the success of their Ballerina GraalVM Image applications.
Published at DZone with permission of Tharmigan Krishnananthalingam. See the original article here.
Opinions expressed by DZone contributors are their own.
Comments