Telemetry Pipelines Workshop: Building First Pipelines
As this workshop series about cloud-native observability continues, learn how to build your first telemetry pipelines with Fluent Bit.
Join the DZone community and get the full member experience.
Join For FreeThis article is part of a series exploring a workshop guiding you through the open-source project Fluent Bit, what it is, a basic installation, and setting up the first telemetry pipeline project. Learn how to manage your cloud-native data from source to destination using the telemetry pipeline phases covering collection, aggregation, transformation, and forwarding from any source to any destination.
The previous article in this series helped with the installation of Fluent Bit using container images on our local machine, including how to run the container while using local configuration files. This article gets our hands dirty with building our first telemetry pipelines with Fluent Bit. You can find more details in the accompanying workshop lab.
Let's get started with our first telemetry pipelines.
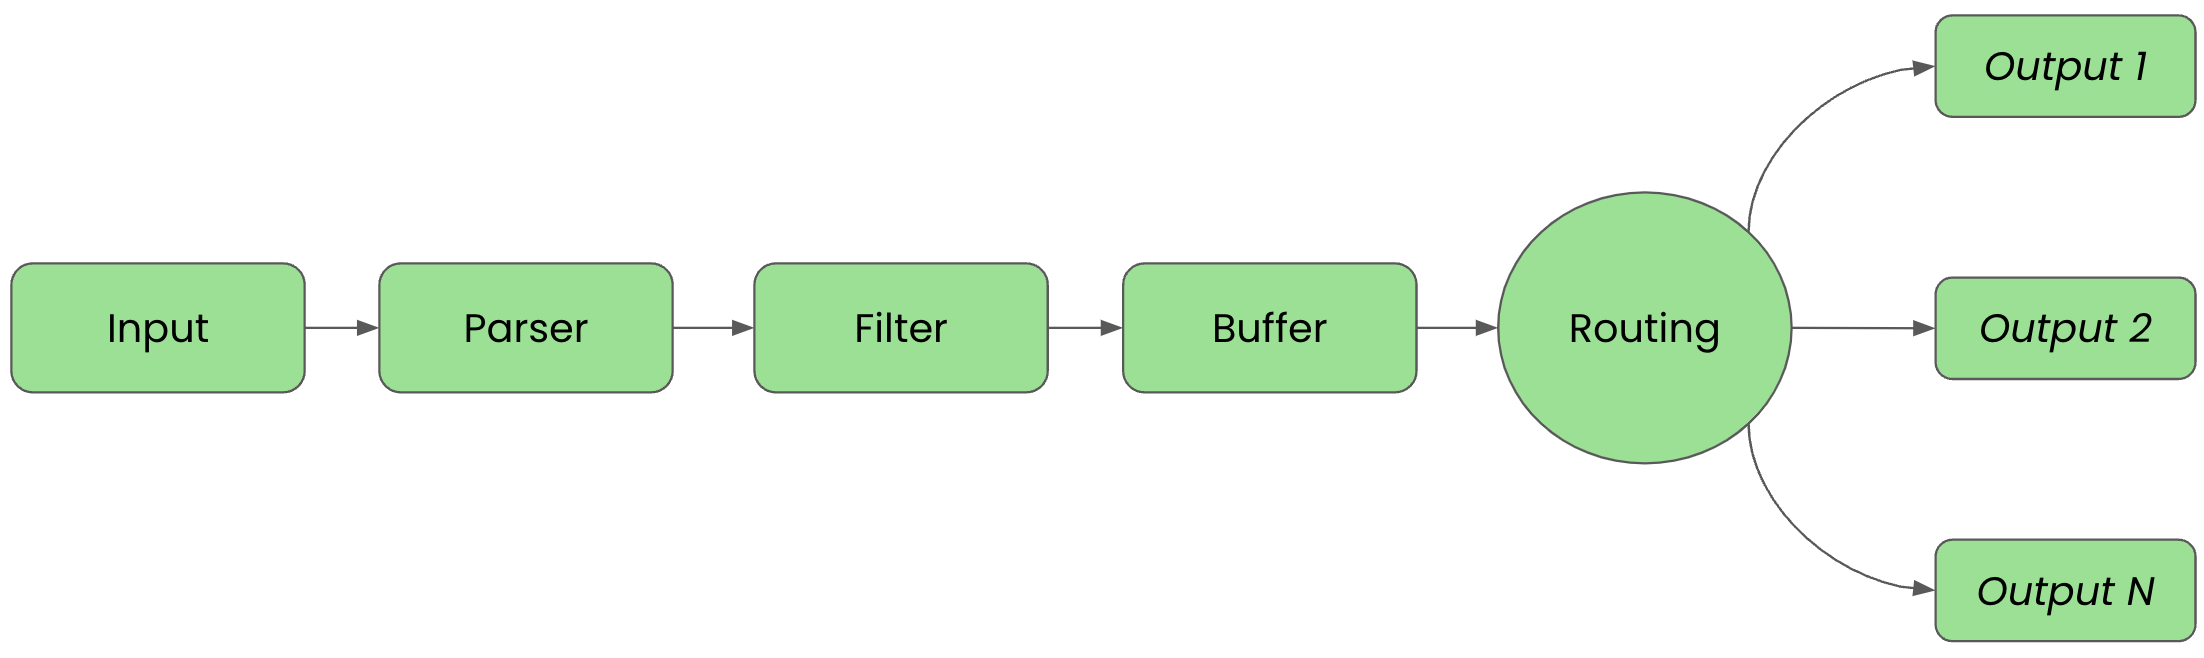
Before we get started, it's important to review the phases of a telemetry pipeline. In the diagram below we see them laid out again. Each incoming event goes from input to parser to filter to buffer to routing before they are sent to their final output destination(s).
For clarity in this article, we'll split up the configuration into files that are imported into a main Fluent Bit configuration file we'll name workshop-fb.conf.
First Pipeline
The first pipeline will set up a telemetry pipeline with just input and output phases configured, and the routing will be just to one source, standard out to a console. It starts with an inputs.conf file containing a configuration using the dummy plugin to generate two types of events:
# This entry generates a test INFO log level message and
# tags it for the workshop.
[INPUT]
  Name   dummy
  Tag    workshop.info
  Dummy  {"message":"This is workshop INFO message", "level":"INFO", "color": "yellow"}

# This entry generates a test ERROR log level message and
# tags it for the workshop.
[INPUT]
  Name   dummy
  Tag    workshop.err
  Dummy  {"message":"This is workshop ERROR message", "level":"ERROR", "color": "red"}
Explore the dummy input plugin documentation for all the details, but this plugin generates fake events on set intervals, 1 second by default. There are three keys used to set up our inputs:
Name- The name of the plugin to be usedTag- The tag we assign (can be anything) to help find events of this type in the matching phaseDummy- Where the exact event output can be defined; by default it just prints{ "message" : "dummy"}
Our configuration is tagging each INFO level event with workshop.info and ERROR level event with workshop.error. The configuration also overrides the default "dummy" message with custom event text.
Now let's create a new output configuration file by opening a new file called outputs.conf in our favorite editor. Add the following configuration:
# This entry directs all tags (it matches any we encounter)
# to print to standard output, which is our console.
#
[OUTPUT]
   Name   stdout
   Match  *
With our inputs and outputs configured, we can now bring them together in a single main configuration file we mentioned at the start. Let's create a new file called workshop-fb.conf in our favorite editor. Add the following configuration, for now just importing our other two files:
# Fluent Bit main configuration file.
#
# Imports section, assumes these files are in the same
# directory as the main configuration file.
#
@INCLUDE inputs.conf
@INCLUDE outputs.conf
To see if our configuration works we can test run it with our Fluent Bit installation. Depending on the chosen install method used from the previous articles in this series, we have the option to run it from the source or use container images. First, we show how to run it using the source install execution from the directory we created to hold all our configuration files:
# source install.
#
$ [PATH_TO]/fluent-bit --config=workshop-fb.conf
The console output should look something like this, noting that we've cut out the ASCII logo at start-up:
...
[2024/03/04 15:50:19] [ info] [fluent bit] version=2.2.2, commit=36bafa00df, pid=52031
[2024/03/04 15:50:19] [ info] [storage] ver=1.5.1, type=memory, sync=normal, checksum=off, max_chunks_up=128
[2024/03/04 15:50:19] [ info] [cmetrics] version=0.6.6
[2024/03/04 15:50:19] [ info] [ctraces ] version=0.4.0
[2024/03/04 15:50:19] [ info] [input:dummy:dummy.0] initializing
[2024/03/04 15:50:19] [ info] [input:dummy:dummy.0] storage_strategy='memory' (memory only)
[2024/03/04 15:50:19] [ info] [input:dummy:dummy.1] initializing
[2024/03/04 15:50:19] [ info] [input:dummy:dummy.1] storage_strategy='memory' (memory only)
[2024/03/04 15:50:19] [ info] [output:stdout:stdout.0] worker #0 started
[2024/03/04 15:50:19] [ info] [sp] stream processor started
[0] workshop.info: [[1709563820.300749000, {}], {"message"=>"This is workshop INFO message", "level"=>"INFO", "color"=>"yellow"}]
[0] workshop.error: [[1709563820.302267000, {}], {"message"=>"This is workshop ERROR message", "level"=>"ERROR", "color"=>"red"}]
[0] workshop.info: [[1709563821.296489000, {}], {"message"=>"This is workshop INFO message", "level"=>"INFO", "color"=>"yellow"}]
[0] workshop.error: [[1709563821.296710000, {}], {"message"=>"This is workshop ERROR message", "level"=>"ERROR", "color"=>"red"}]
...
Note the alternating generated event lines with INFO and ERROR messages that run until exiting with CTRL_C.
Next, we show how to run our telemetry pipeline configuration using a container image. The first thing that is needed is a new file called Buildfile. This is going to be used to build a new container image and insert our configuration files. Note this file needs to be in the same directory as your configuration files, otherwise adjust the file path names:
FROM cr.fluentbit.io/fluent/fluent-bit:2.2.2

COPY ./workshop-fb.conf /fluent-bit/etc/fluent-bit.conf
COPY ./inputs.conf /fluent-bit/etc/inputs.conf
COPY ./outputs.conf /fluent-bit/etc/outputs.conf
Now we'll build a new container image, naming it with a version tag, as follows using the Buildfile and assuming you are in the same directory (using Podman as discussed in previous articles):
$ podman build -t workshop-fb:v1 -f Buildfile

STEP 1/4: FROM cr.fluentbit.io/fluent/fluent-bit:2.2.2
STEP 2/4: COPY ./workshop-fb.conf /fluent-bit/etc/fluent-bit.conf
--> a379e7611210
STEP 3/4: COPY ./inputs.conf /fluent-bit/etc/inputs.conf
--> f39b10d3d6d0
STEP 4/4: COPY ./outputs.conf /fluent-bit/etc/outputs.conf
COMMIT workshop-fb:v1
--> b06df84452b6
Successfully tagged localhost/workshop-fb:v1
b06df84452b6eb7a040b75a1cc4088c0739a6a4e2a8bbc2007608529576ebeba
Now to run our new container image:
$ podman run workshop-fb:v1
The output looks exactly like the source output above, just with different timestamps. Again you can stop the container using CTRL_C.
Examining Solution Phases
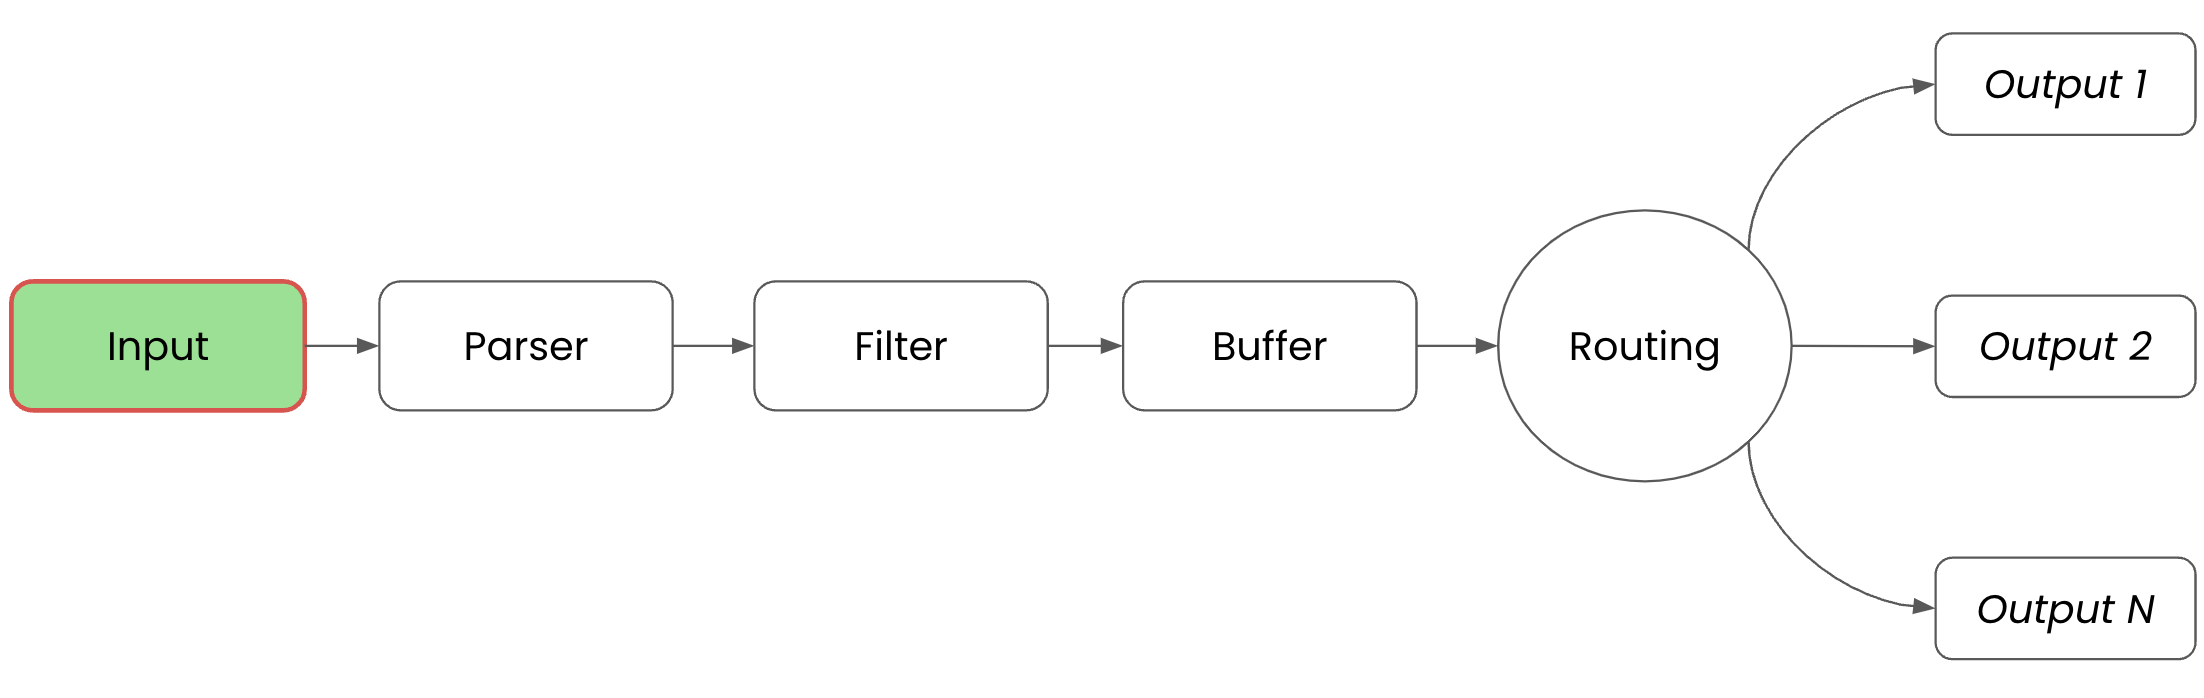
Let's review our solution by walking through Fluent Bit's pipeline phases, as discussed above. Our input phase defined where we were getting our data from to feed the pipeline, in our case using a dummy plugin to generate two events every second:
# This entry generates a test INFO log level message and
# tags it for the workshop.
[INPUT]
  Name   dummy
  Tag    workshop.info
  Dummy  {"message":"This is workshop INFO message", "level":"INFO", "color": "yellow"}

# This entry generates a test ERROR log level message and
# tags it for the workshop.
[INPUT]
  Name   dummy
  Tag    workshop.err
  Dummy  {"message":"This is workshop ERROR message", "level":"ERROR", "color": "red"}
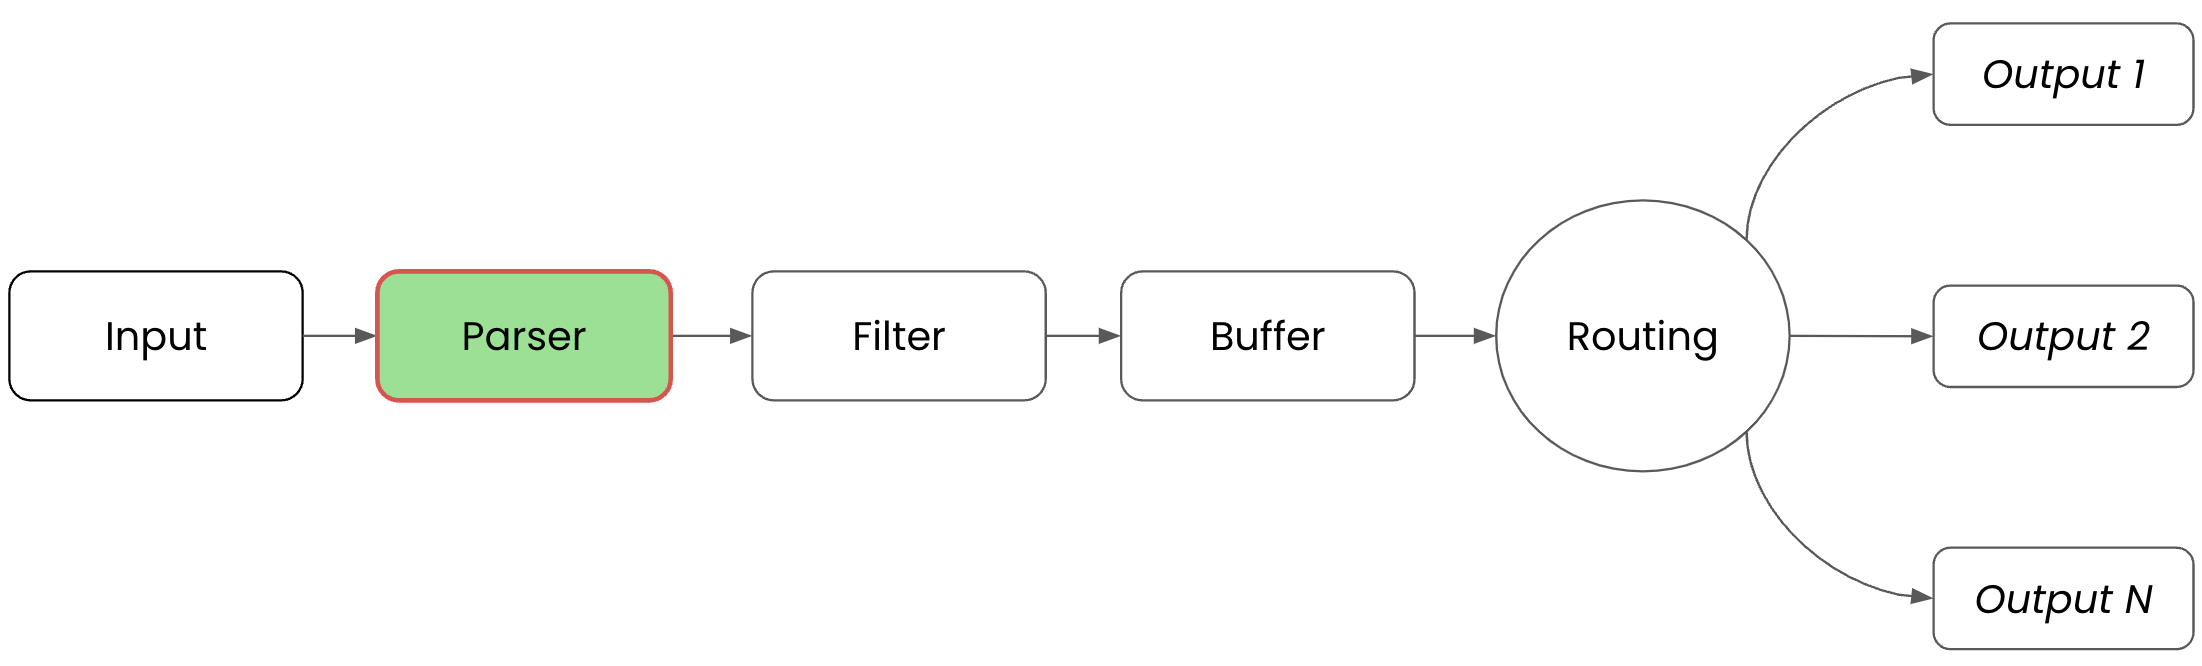
# This entry directs all tags (it matches any we encounter)
# to print to standard output, which is our console.
#
[OUTPUT]
   Name   stdout
   Match  *      <<<<<< Filtering phase.

Buffering in our first pipeline started with in-memory and does not yet make use of file system-based options.
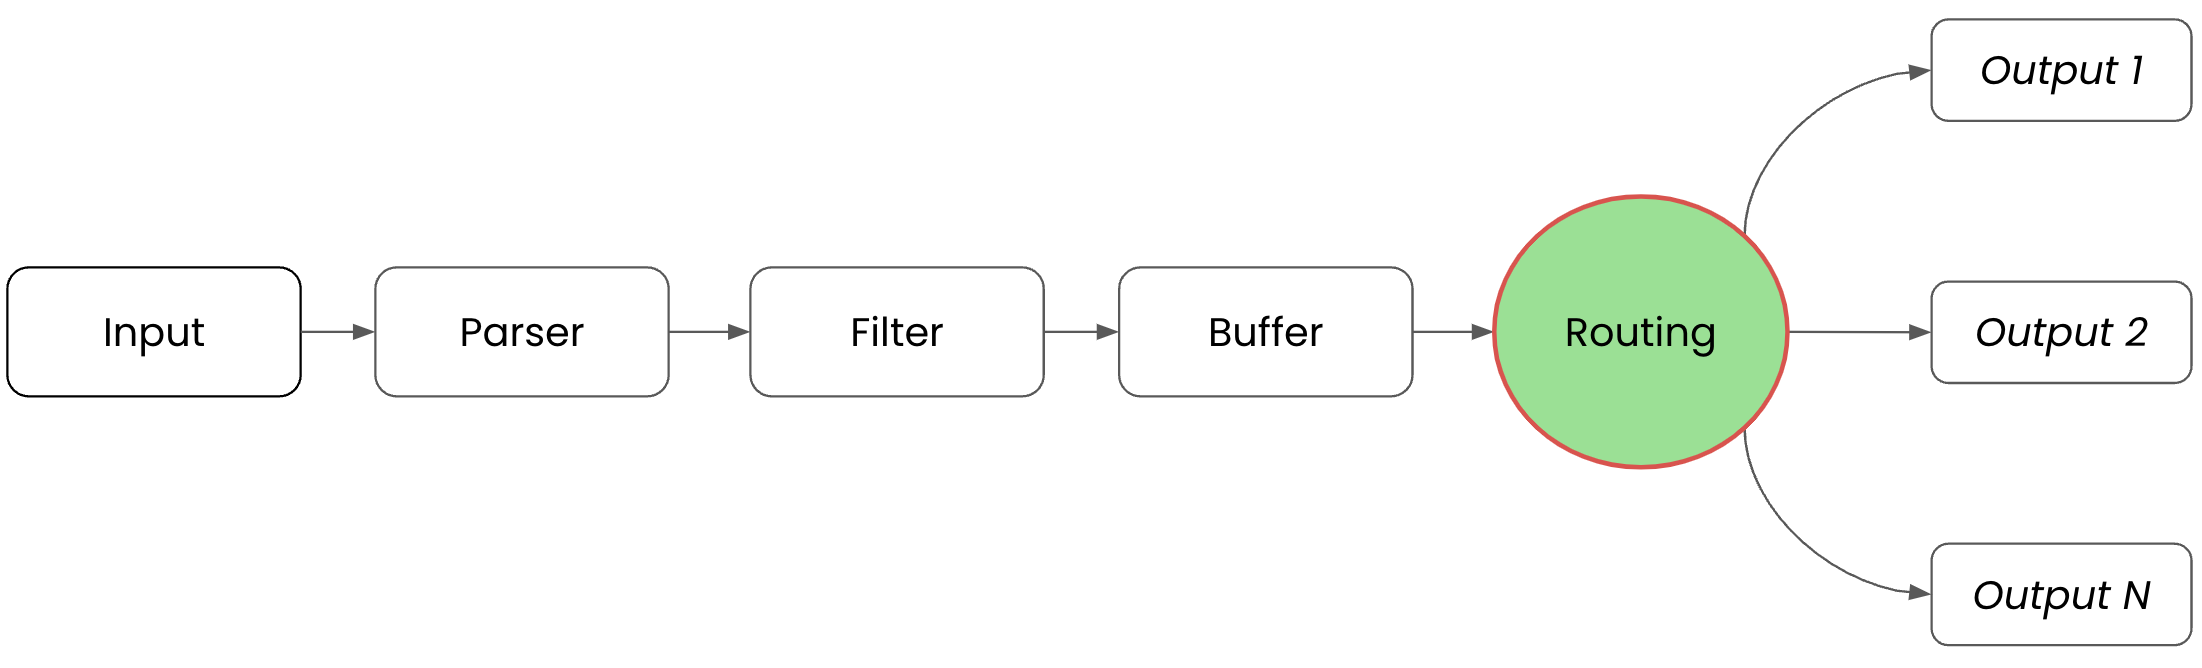
Our first pipeline uses the assigned Tag and Match configurations found in the outputs.conf file to determine which output destinations to send data to. Ours is simply sending all tagged events to the standard output (console):
# This entry directs all tags (it matches any we encounter)
# to print to standard output, which is our console.
#
[OUTPUT]
   Name   stdout  <<<<< Routing phase based on matching,
   Match  *       <<<<< in this case, all tags.
The final phase is OUTPUT, which is where Fluent Bit uses the standard output plugin to dump all matched events to the console. Later you'll see other ways to configure outputs:
# This entry directs all tags (it matches any we encounter)
# to print to standard output, which is our console.
#
[OUTPUT]
   Name   stdout  <<<<< Output phase / destination.
   Match  *

While this image shows multiple outputs, our configuration has but one. With that, we've completed our very first telemetry pipeline!
Second Pipeline
For our second telemetry pipeline, we're going to expand our routing and output phases to add a new option using the existing generated input events. To do that, we just need to add two new output sections to our file outputs.conf.
We want to use a new output plugin called File, and have this route all events with the tag *.info to a file called /tmp/workshop-fb/workshop-INFO.log.
We are also going to configure another section to route all events with the tag *.error to a different file called /tmp/workshop-fb/workshop-INFO.log.
Let's see how we can update our outputs.conf file:
# This entry directs all tags (it matches any we encounter)
# to print to standard output, which is our console.
[OUTPUT]
   Name   stdout
   Match  *

# This entry directs all INFO level events its own log file.
[OUTPUT]
   Name  file
   File  /tmp/workshop-INFO.log
   Match *.info

# This entry directs all error level events its own log file.
[OUTPUT]
   Name file
   File /tmp/workshop-ERROR.log
   Match *.error
To see if our configuration works, we can test run it with our Fluent Bit installation; first, using the source installation followed by the container version. Below the source install is shown from the directory we created to hold all our configuration files:
# source install.
#
$ [PATH_TO]/fluent-bit --config=workshop-fb.conf
The console output should look something like this - note that we've cut out the ASCII logo at start-up:
...
[2024/03/04 15:50:19] [ info] [fluent bit] version=2.2.2, commit=36bafa00df, pid=52031
[2024/03/04 15:50:19] [ info] [storage] ver=1.5.1, type=memory, sync=normal, checksum=off, max_chunks_up=128
[2024/03/04 15:50:19] [ info] [cmetrics] version=0.6.6
[2024/03/04 15:50:19] [ info] [ctraces ] version=0.4.0
[2024/03/04 15:50:19] [ info] [input:dummy:dummy.0] initializing
[2024/03/04 15:50:19] [ info] [input:dummy:dummy.0] storage_strategy='memory' (memory only)
[2024/03/04 15:50:19] [ info] [input:dummy:dummy.1] initializing
[2024/03/04 15:50:19] [ info] [input:dummy:dummy.1] storage_strategy='memory' (memory only)
[2024/03/04 15:50:19] [ info] [output:stdout:stdout.0] worker #0 started
[2024/03/04 15:50:19] [ info] [sp] stream processor started
[0] workshop.info: [[1709647524.730711742, {}], {"message"=>"This is workshop INFO message", "level"=>"INFO", "color"=>"yellow"}]
[0] workshop.error: [[1709647524.730841784, {}], {"message"=>"This is workshop ERROR message", "level"=>"ERROR", "color"=>"red"}]
[0] workshop.info: [[1709647525.732475405, {}], {"message"=>"This is workshop INFO message", "level"=>"INFO", "color"=>"yellow"}]
[0] workshop.error: [[1709647525.732539155, {}], {"message"=>"This is workshop ERROR message", "level"=>"ERROR", "color"=>"red"}]
[0] workshop.info: [[1709647526.729102845, {}], {"message"=>"This is workshop INFO message", "level"=>"INFO", "color"=>"yellow"}]
[0] workshop.error: [[1709647526.729131554, {}], {"message"=>"This is workshop ERROR message", "level"=>"ERROR", "color"=>"red"}]
[0] workshop.info: [[1709647527.733301264, {}], {"message"=>"This is workshop INFO message", "level"=>"INFO", "color"=>"yellow"}]
[0] workshop.error: [[1709647527.733388681, {}], {"message"=>"This is workshop ERROR message", "level"=>"ERROR", "color"=>"red"}]
[0] workshop.info: [[1709647528.733776381, {}], {"message"=>"This is workshop INFO message", "level"=>"INFO", "color"=>"yellow"}]
[0] workshop.error: [[1709647528.733822506, {}], {"message"=>"This is workshop ERROR message", "level"=>"ERROR", "color"=>"red"}]
...
Note the alternating generated event lines with INFO and ERROR messages that run until exiting with CTRL_C.
The file output for workshop-INFO.log should contain only the generated event lines with INFO messages, and the workshop-ERROR.log the ERROR messages that ran until exiting with CTRL_C:
$ cat /tmp/workshop-INFO.log

[0] workshop.info: [[1709647524.730711742, {}], {"message"=>"This is workshop INFO message", "level"=>"INFO", "color"=>"yellow"}]
[0] workshop.info: [[1709647525.732475405, {}], {"message"=>"This is workshop INFO message", "level"=>"INFO", "color"=>"yellow"}]
[0] workshop.info: [[1709647526.729102845, {}], {"message"=>"This is workshop INFO message", "level"=>"INFO", "color"=>"yellow"}]
[0] workshop.info: [[1709647527.733301264, {}], {"message"=>"This is workshop INFO message", "level"=>"INFO", "color"=>"yellow"}]
[0] workshop.info: [[1709647528.733776381, {}], {"message"=>"This is workshop INFO message", "level"=>"INFO", "color"=>"yellow"}]

$ cat /tmp/workshop-ERROR.log

[0] workshop.error: [[1709647524.730841784, {}], {"message"=>"This is workshop ERROR message", "level"=>"ERROR", "color"=>"red"}]
[0] workshop.error: [[1709647525.732539155, {}], {"message"=>"This is workshop ERROR message", "level"=>"ERROR", "color"=>"red"}]
[0] workshop.error: [[1709647526.729131554, {}], {"message"=>"This is workshop ERROR message", "level"=>"ERROR", "color"=>"red"}]
[0] workshop.error: [[1709647527.733388681, {}], {"message"=>"This is workshop ERROR message", "level"=>"ERROR", "color"=>"red"}]
[0] workshop.error: [[1709647528.733822506, {}], {"message"=>"This is workshop ERROR message", "level"=>"ERROR", "color"=>"red"}]
To test with a container, we need to rebuild a new container image, naming it with a new version tag as follows using the Buildfile and assuming you are in the same directory:
$ podman build -t workshop-fb:v2 -f Buildfile

STEP 1/4: FROM cr.fluentbit.io/fluent/fluent-bit:2.2.2
STEP 2/4: COPY ./workshop-fb.conf /fluent-bit/etc/fluent-bit.conf
--> Using cache a379e761121021b24232d2284ab68e307b0b997ed2f341faa470a5e14ce438f7
--> a379e7611210
STEP 3/4: COPY ./inputs.conf /fluent-bit/etc/inputs.conf
--> Using cache f39b10d3d6d044aa82b719fe9170d741e7c42d01fb9d50cc8ba678f7d2cb4da8
--> f39b10d3d6d0
STEP 4/4: COPY ./outputs.conf /fluent-bit/etc/outputs.conf
--> Using cache cd6f623a4f5afcd19a62281d0e20963a9f38309d02c98b27afa70755d1111832
COMMIT workshop-fb:v2
--> cd6f623a4f5a
Successfully tagged localhost/workshop-fb:v2
cd6f623a4f5afcd19a62281d0e20963a9f38309d02c98b27afa70755d1111832
Now we'll run our new container image, but we need a way for the container to write to the two log files so that we can check them (not internally on the container filesystem). We mount our local directory to the containers tmp directory so we can see the files on our local machine as follows:
$ podman run -v ./:/tmp workshop-fb:v2
The output looks exactly like the source output above, just with different timestamps. Again you can stop the container using CTRL_C.
Due to mounting the local file system to the container, if you check your current directory you will find the file output for workshop-INFO.log and workshop-ERROR.log. Validate that they contain the right events as follows:
$ cat workshop-INFO.log

[0] workshop.info: [[1709649106.731085297, {}], {"message"=>"This is workshop INFO message", "level"=>"INFO", "color"=>"yellow"}]
[0] workshop.info: [[1709649107.729271465, {}], {"message"=>"This is workshop INFO message", "level"=>"INFO", "color"=>"yellow"}]
[0] workshop.info: [[1709649108.729087599, {}], {"message"=>"This is workshop INFO message", "level"=>"INFO", "color"=>"yellow"}]
[0] workshop.info: [[1709649109.734200379, {}], {"message"=>"This is workshop INFO message", "level"=>"INFO", "color"=>"yellow"}]
[0] workshop.info: [[1709649110.731502585, {}], {"message"=>"This is workshop INFO message", "level"=>"INFO", "color"=>"yellow"}]

$ cat workshop-ERROR.log

[0] workshop.error: [[1709649106.731230173, {}], {"message"=>"This is workshop ERROR message", "level"=>"ERROR", "color"=>"red"}]
[0] workshop.error: [[1709649107.729377883, {}], {"message"=>"This is workshop ERROR message", "level"=>"ERROR", "color"=>"red"}]
[0] workshop.error: [[1709649108.729115099, {}], {"message"=>"This is workshop ERROR message", "level"=>"ERROR", "color"=>"red"}]
[0] workshop.error: [[1709649109.734291254, {}], {"message"=>"This is workshop ERROR message", "level"=>"ERROR", "color"=>"red"}]
[0] workshop.error: [[1709649110.731568252, {}], {"message"=>"This is workshop ERROR message", "level"=>"ERROR", "color"=>"red"}]
This completes our second telemetry pipeline! There is one more pipeline to be created, but for those details see the accompanying workshop lab linked earlier in this article.
What's Next?
This article helped us with creating our first telemetry pipelines using either the source install or container images. The series continues with the next step where we'll explore more telemetry pipelines.
Stay tuned for more hands-on material to help you with your cloud-native observability journey.
Published at DZone with permission of Eric D. Schabell. See the original article here.
Opinions expressed by DZone contributors are their own.
Comments