The 5 Must-Have Embedded Analytics Capabilities
Here are the 5 must-have capabilities that every embedded analytics software should have.
Join the DZone community and get the full member experience.
Join For FreeIn today’s data-rich and fast-paced business environment, it is quite evident that an organization’s success heavily relies on data insights that embedded analytics software can provide them with.
With this in mind, choosing the right embedded analytics software to integrate into your applications is crucial, and I know that is not an easy task. To help you narrow your search and better evaluate different software solutions that you might consider partnering with, I made this list of the 5 must-have embedded analytics capabilities so that you can make the best decision for your business.
So, without any further ado, here are the top 5 embedded analytics capabilities you must look for:
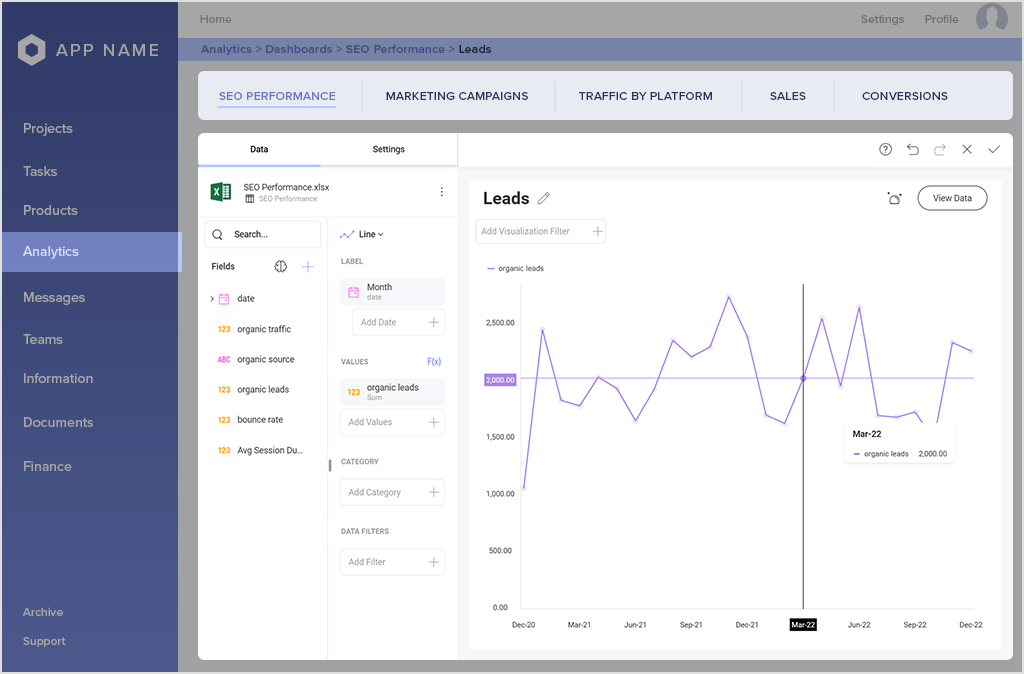
1. Self-Service BI Capabilities
All of your SaaS users are different – some might be experts on analytics, while others might have some basic reporting skills or have no experience or expertise at all. That is why it is of utmost importance that the embedded analytics solution you integrate within your apps offers self-service capabilities.
The self-service BI capability provides a simple, user-friendly, most often drag-and-drop analytics capability that lets your non-technical users analyze data and create reports on their own.
So, when evaluating a self-service embedded analytics software, you should pay close attention and look for these things:
- Intuitive interface – first and foremost, you would want to enable your users to easily select data fields from the tables within the data source and simply drag and drop these data fields into separate sections to create informative and impactful dashboards.
- Predefined dashboard templates – easy-to-use and edit dashboards so that your users don’t have to waste time, every time, developing them from scratch.
- Features to all data people – those who are just starting out with data analytics should have easy-to-use dashboards are visualization tools at their disposal at a bare minimum. On the other hand, you won’t want to limit your power users with only simple and basic features, so look for a solution that enables more editing and customization features. Some of the key self-service BI functionalities include the already mentioned drag-and-drop capability, data and dashboard blending features, and database plug-ins.
- Data connectors – an analytics solution is of no use if it doesn’t connect to all your data. Find yourself a long-haul partner that lets you seamlessly connect to numerous different data courses to combine all your data in one place for a comprehensive analysis.
2. Customization Capabilities AKA White Labeling
If all of a sudden you add reporting capabilities into your applications that don’t look or feel as if they belong, your customers will get distracted, confused, and your user experience will drop dramatically.
Don't make the mistake of going for the first embedded analytics solution you come across without making sure that it can be customized to fit your unique brand perfectly. In the data analytics space, the ability to embed reports, dashboards, and visuals to match your application’s fonts, colors, and the overall brand theme is called white label analytics.
The white labeling functionality allows you to customize all UX analytics elements to match those of your application. When done right, your customers and users won’t get distracted or notice the difference in your application. Instead, they can focus on extracting actionable insights to answer business questions and the general value of data.
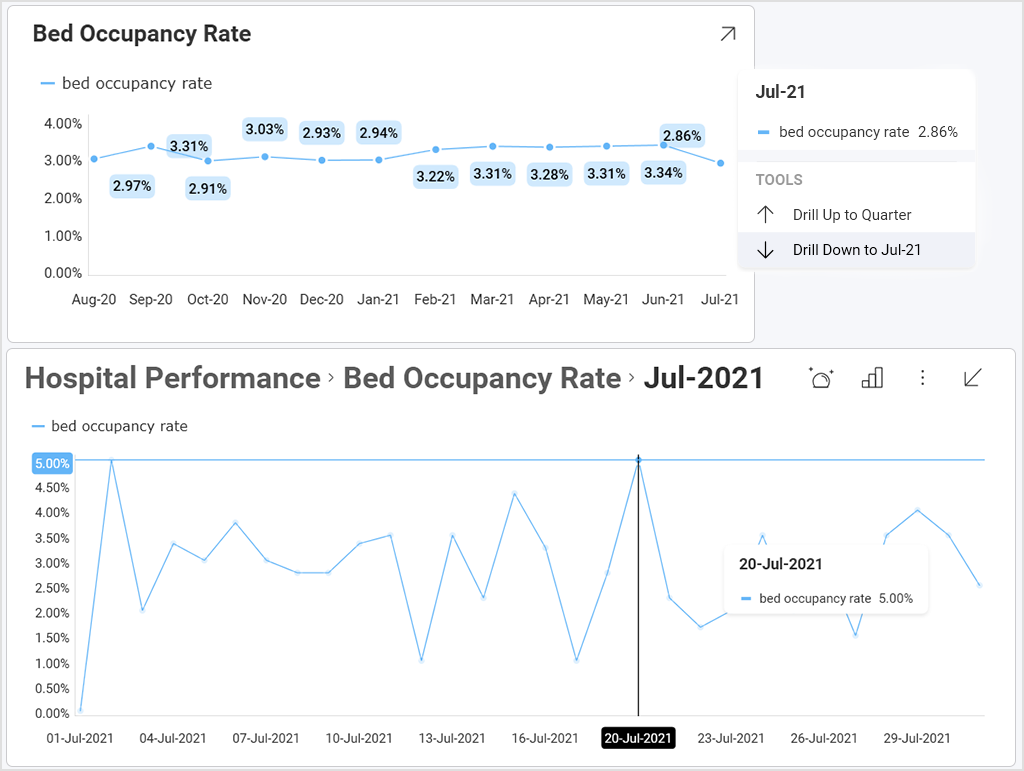
3. Rich Data Analysis
Rich data analysis refers to the analysis of what is called rich data. The term rich data describes the notion that qualitative data and their subsequent representation should reveal the complexities and the richness of what is being analyzed. In a business environment, rich data analysis is a form of BI that helps organizations and business owners to more intelligently answer specific questions about the market and to better understand and predict customer behavior by linking the data available from various departments.
These powerful business benefits are made possible through compiling data to create a broader picture and see all the factors that influence a certain customer decision both internally and externally.
Features and capabilities that allow rich data analysis to look for in an embedded analytics software include:
- Drill down- takes users from a general overview to a more detailed and comprehensive analysis with a single click.
- Machine Learning and AI- AI and machine learning algorithms are changing how users interact with analytics and data management. They help users to create or provide data fabric capabilities, organization data catalogs, self-service data preparation, AI-powered data cleansing, and much more. AI automatically analyzes data and reveals patterns, trends, and insights that can be utilized for more intelligent and fact-based decisions. Also, AI makes data easier to understand by using NLG (Natural Language Generation)- the process of producing natural written or spoken language from structured and unstructured data that helps computers feedback to users' information in a human language that they can easily.
4. Statistical Functions
In the data analytics world, statistical functions are the use of mathematics to perform technical data analysis. For example, basic data visualizations such as let say, pie charts or graph charts can provide you with high-level insights into your data. However, by applying statistical functions to that data, you get to operate on that data in a much more targeted and, most importantly, data-driven way.
The key data analytics statistical functions are outlier detection, time series forecasting, and linear regression.
- Outliers detection – allows users to detect points in the data that are anomalies and differ from much of a data set.
- Time series forecasting – based on historical data and trends, time series forecasting helps users make predictions on future values.
- Linear regression – by finding the relationship between two variables (and seeing a linear approximation of the data, including future trends), the linear regression lets users visually see trends in their data.
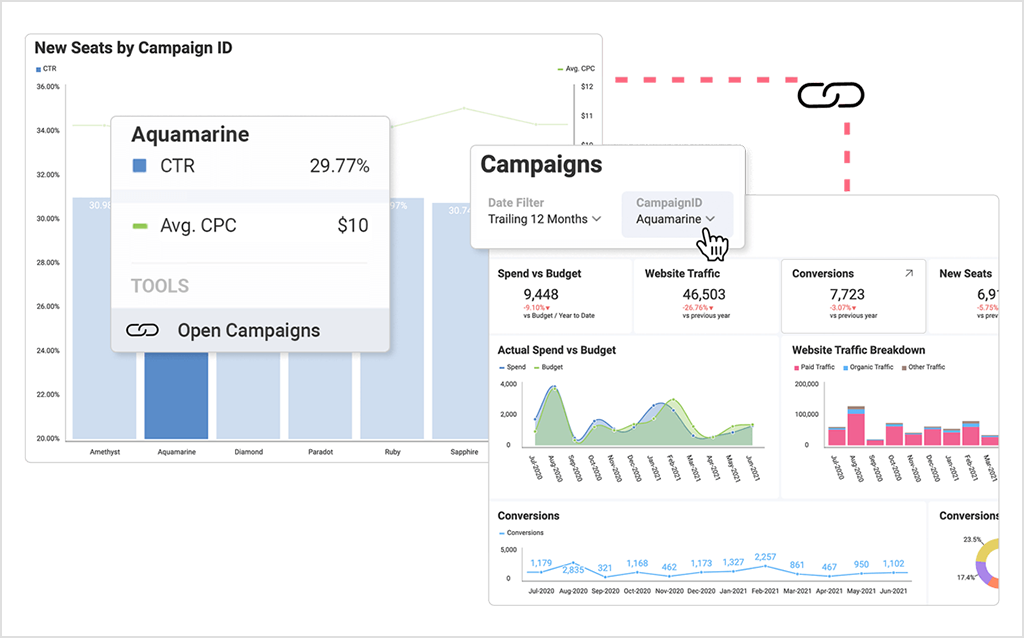
5. Dashboard Linking
And the fifth must-have embedded analytics capability is the dashboard linking functionality that allows you to connect visualizations in a dashboard or an entire dashboard directly into another dashboard or a URL. The dashboard linking capability helps users pass parameters and filters through between dashboards to make drilling down to additional insights easier and more straightforward.
For example, let’s imagine that you want to provide more information and more details about the insights in a visualization. With the dashboard linking capability, you can easily do that by using an entirely new dashboard for that purpose, which you can later on simply link into your other dashboard.
And there you have the 5 must-have embedded analytics capabilities that you should require from any BI vendor you are considering partnering with. Other important capabilities that you should look for include in-context editing, data blending, real-time, contextual discussions, easy sharing of reports and dashboards with both internal and external team members and stakeholders, comments and discussion abilities supporting efficient decision-making, effective governance, rich APIs, and a native SDK.
Opinions expressed by DZone contributors are their own.
Comments