The LLM Selection War Story: Part 1 - Why Your Model Selection Process is Fundamentally Broken
Benchmark scores predicted our LLM would succeed. It failed spectacularly. Here's why 92% vs 89% means nothing and what metrics actually matter in production.
Join the DZone community and get the full member experience.
Join For FreeHere's a confession that'll probably get me kicked out of the AI engineering community: I spent three months selecting an LLM based on benchmark scores, built an entire production system around it, and watched it fail spectacularly in ways no benchmark predicted. The model scored 94% on reasoning tasks. It couldn't handle a simple user asking "wait, what did I just say?" without losing its mind.
Let me tell you why everything you think you know about choosing an LLM is probably wrong, and more importantly, what metrics actually matter when your system is bleeding money because your chosen model decided to hallucinate pricing information to paying customers.
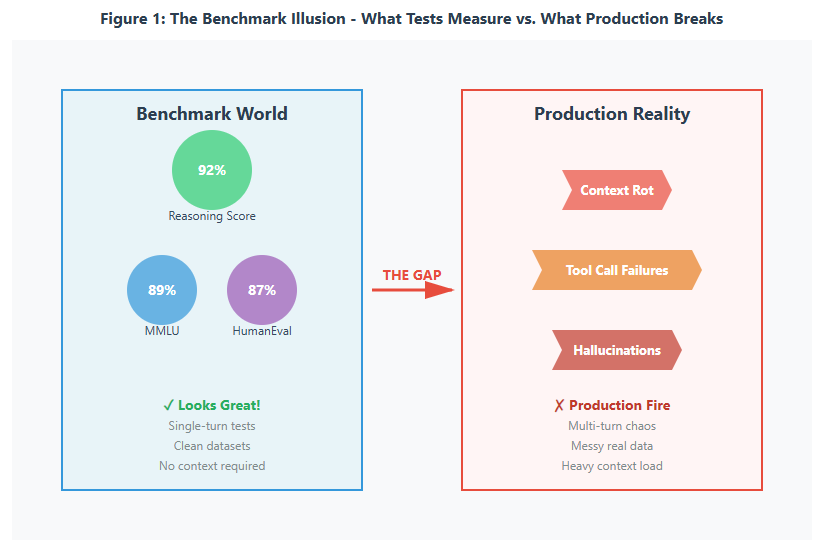
The Benchmark Theatre: A Production Horror Story
December 2023. I'm sitting in a conference room with our management, presenting my carefully researched comparison of GPT-4, Claude 2, and Gemini. Beautiful slides. Color-coded charts. GPT-4: 92% on reasoning benchmarks. Claude: 89%. Gemini: 87%. Decision made in 15 minutes. We went with GPT-4 because, obviously, 92% > 89%.
Fast forward two weeks into production. Our customer support chatbot, powered by our shiny 92%-scoring model, started doing something... weird. It would answer the first three questions perfectly. Question four? Suddenly it forgot the customer's name. Question five? It contradicted its answer from question two. Question six? It started making up features our product didn't have.
The Reality Check: That 3% difference in benchmark scores? Meaningless. The model's inability to maintain context coherence over a 10-turn conversation? Not measured by any benchmark we evaluated.
We discovered this the hard way when a customer tweeted a screenshot of our chatbot confidently claiming we offered a "Premium Diamond Tier" subscription. We've never had a Premium Diamond Tier. The tweet got 15,000 retweets. Our VP was not amused.
The Metrics That Actually Matter (And Nobody Talks About)
After our Premium Diamond Tier incident, I did what any reasonable engineer would do: I stopped trusting benchmarks entirely and started measuring what was actually breaking in production. Over the next six weeks, we instrumented everything. Every conversation turn. Every context window. Every tool call. Every weird behavior.
What emerged was a completely different picture of model performance. Here are the three metrics that became our North Star, and why you've probably never heard of them:
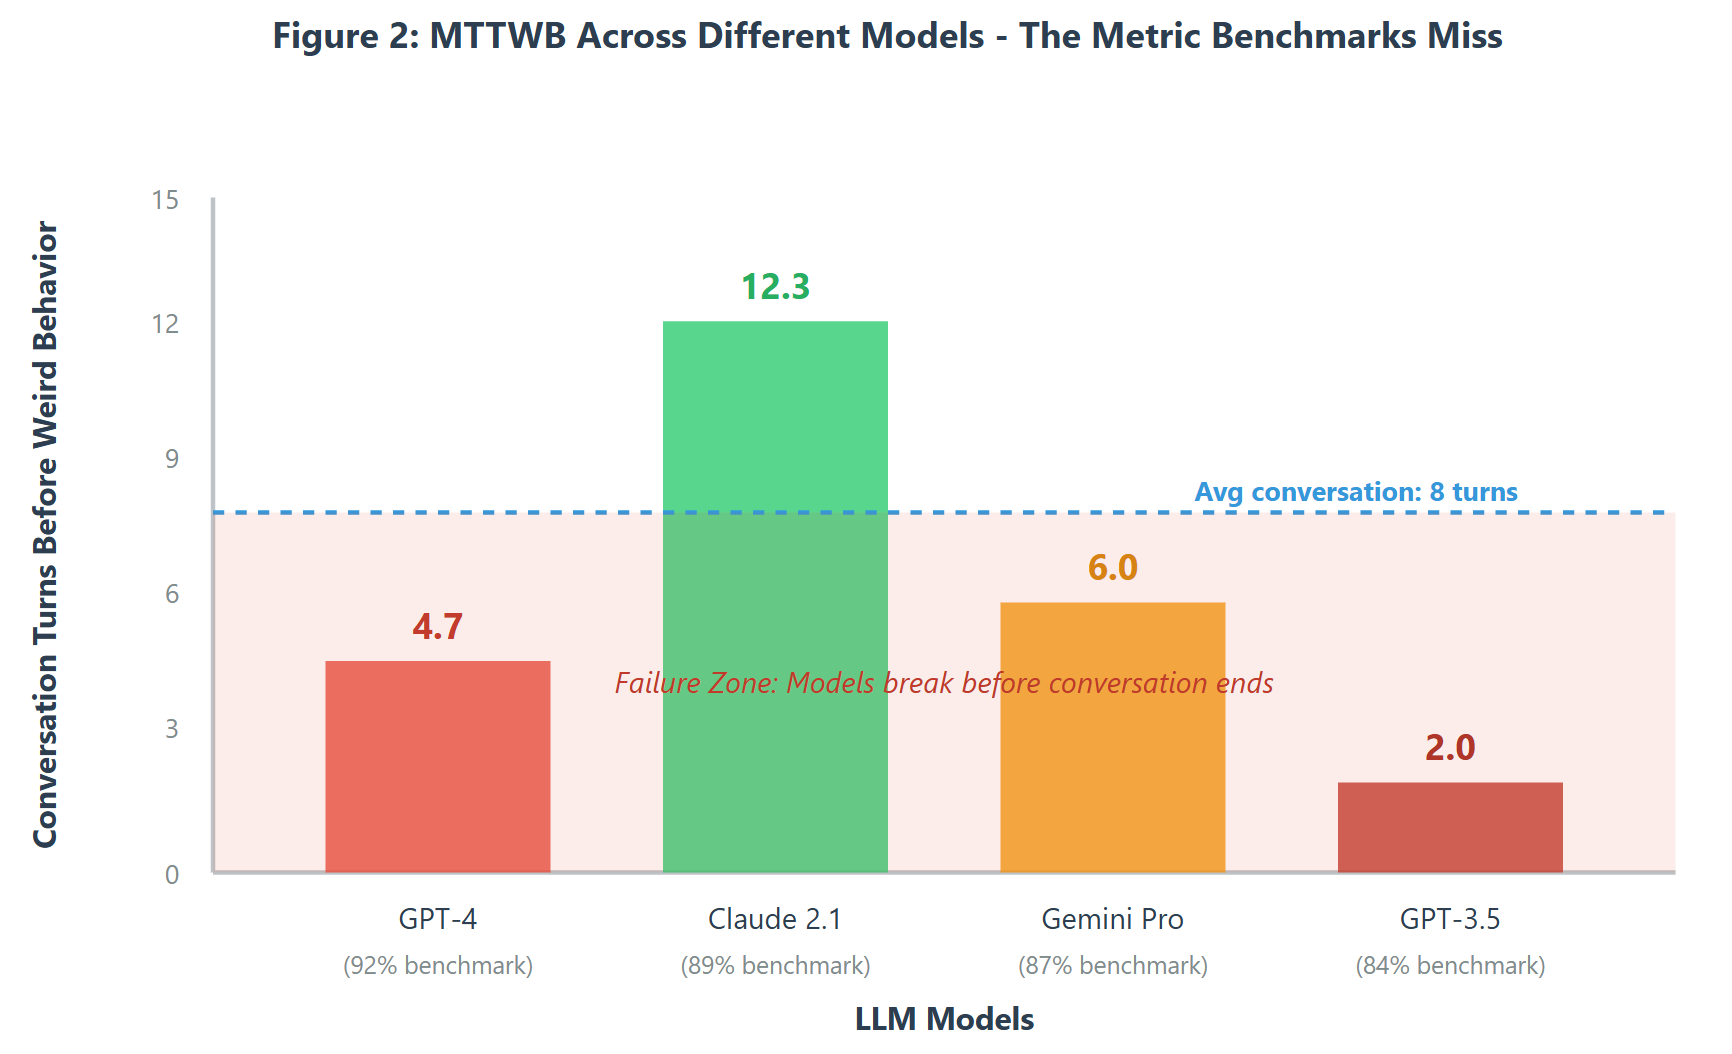
1. Mean Time To Weird Behavior (MTTWB)
This is my favorite metric because it sounds ridiculous but predicts production failures better than any benchmark. MTTWB measures how many conversation turns pass before the model does something that makes users go "wait, what?"
For our GPT-4 deployment, MTTWB was 4.7 turns. Sounds decent until you realize that 68% of our customer support conversations lasted 8+ turns. We were essentially guaranteed weirdness in two-thirds of interactions.
When we tested Claude 2.1 (which scored 3% lower on benchmarks), MTTWB was 12.3 turns. In production terms, this meant 82% of conversations completed without weird behavior. That 3% benchmark difference? Represented a 300% improvement in conversation reliability.
Here's what "weird behavior" actually looks like in production:
- Forgetting the user's name mid-conversation (happened 847 times in month one)
- Contradicting previous statements without acknowledging the change
- Hallucinating product features, pricing, or capabilities
- Suddenly switching to a different language or tone
- Losing track of what problem the user was trying to solve
The kicker? None of these behaviors show up in single-turn benchmark tests. They're emergent properties of multi-turn conversations with real context management challenges.
2. Context Rot Rate (CRR)
This one took us forever to even identify as a problem. Context Rot Rate measures how quickly a model's understanding of the conversation context degrades as the context window fills up.
We discovered this when analyzing failed conversations. Early in the conversation (turns 1-3), models were brilliant. Accuracy was 94%+. By turn 8, with the context window at 60% capacity, accuracy dropped to 76%. By turn 12, with the window at 85% capacity, accuracy was 61%.
But here's where it gets interesting: this degradation wasn't linear, and it varied wildly by model.
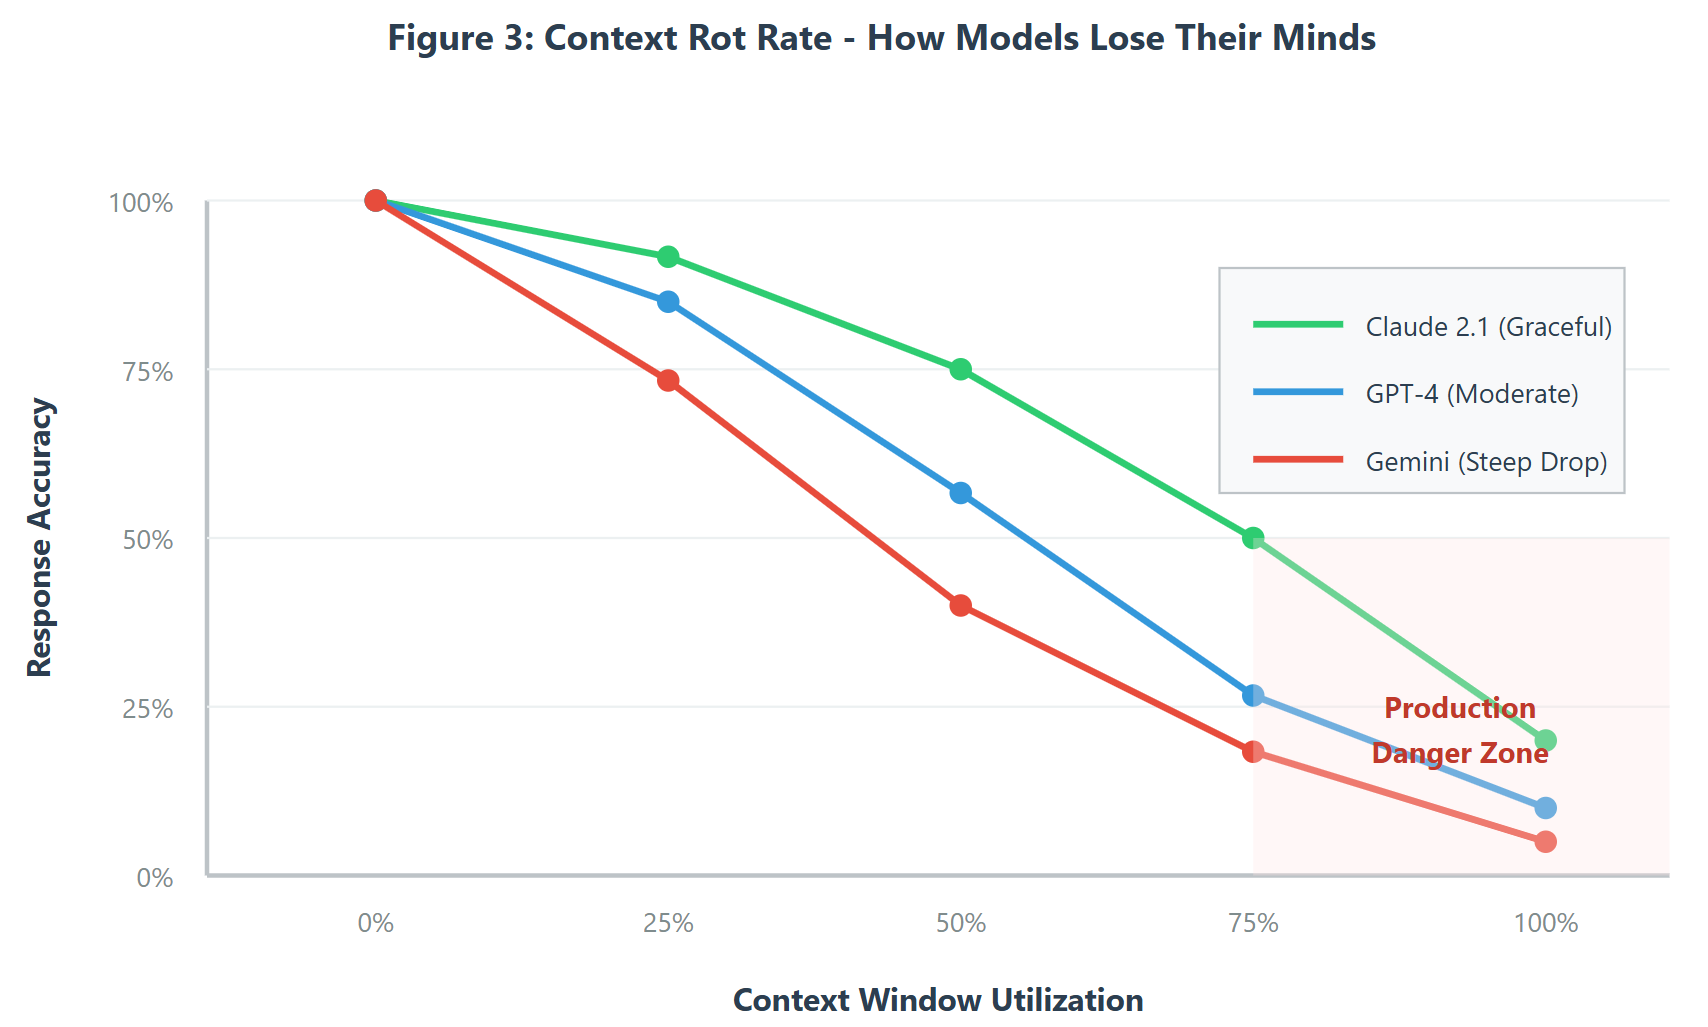
GPT-4 showed a sharp drop-off after 50% context utilization. Claude maintained accuracy much longer, degrading gracefully. Gemini fell off a cliff at 40% utilization.
In production terms, this meant:
- GPT-4: Had to reset context every 6-7 turns, frustrating users who felt like they were constantly re-explaining themselves
- Claude 2.1: Could maintain coherent conversations for 12-15 turns before needing a context reset
- Gemini: Basically unusable for our multi-turn support conversations
The benchmark scores that showed GPT-4 as "better"? They didn't measure any of this because they didn't stress the context window with realistic conversation loads.
3. Tool Call Consistency (TCC)
This metric nearly broke my brain when we first identified it. Tool Call Consistency measures how reliably a model follows tool-calling patterns across a conversation.
Our chatbot had access to six tools: check_order_status, update_shipping_address, process_refund, escalate_to_human, search_knowledge_base, and create_support_ticket. Simple enough, right?
Wrong. Here's what actually happened in production:
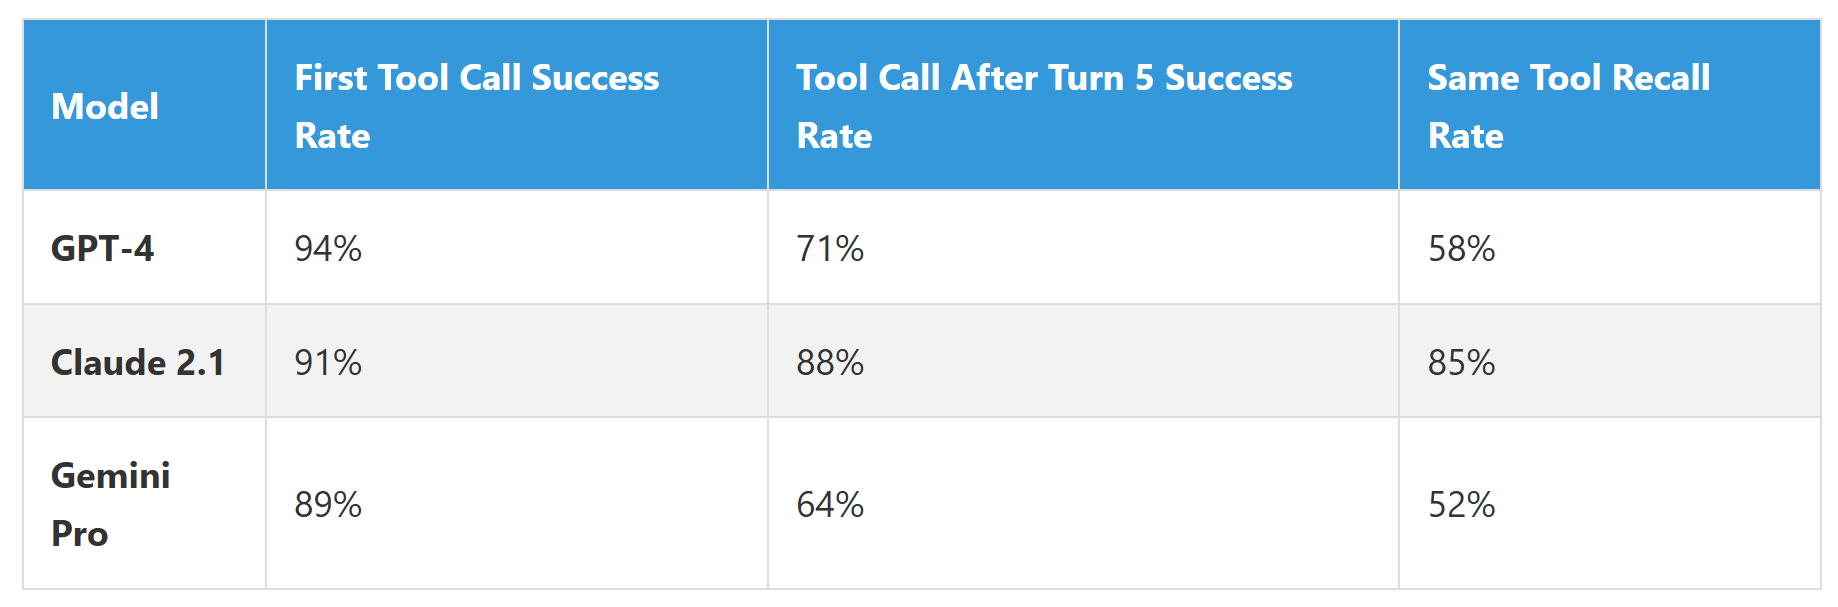
See that "Same Tool Recall Rate"? That measures whether the model remembers that it already used a tool earlier in the conversation. GPT-4 scored highest on initial tool calls but forgot its own actions 42% of the time in longer conversations.
Real example from our logs:
- Turn 2: Model calls
check_order_status("12345")- works perfectly - Turn 5: User asks "what was the status again?" - Model calls
check_order_status("12345")again instead of referencing the earlier result - Turn 7: User asks for an update - Model calls
check_order_status("12345")a third time
This pattern cost us thousands in unnecessary API calls and made conversations feel robotic and repetitive. Users noticed. Our CSAT scores dropped 12 points in the first month.
The Hidden Cost: Poor Tool Call Consistency didn't just annoy users — it tripled our operational costs. We were making 3x the necessary API calls because the model kept forgetting it had already fetched information.
Why Benchmarks Get This So Wrong
After six months of production data, I finally understood why benchmark scores are fundamentally misleading for production LLM selection. It's not that benchmarks are useless — they measure something. It's that what they measure has almost no correlation with production success.
Here's the brutal truth: benchmarks are designed to be passable by models, not to predict real-world failure modes. They test atomic capabilities (can you answer this question correctly?) rather than emergent behaviors (can you maintain context coherence across 15 turns while managing three concurrent tool calls?).
Think about it like this: a driving test measures whether you can parallel park and use turn signals. It doesn't measure whether you'll stay calm when your GPS fails during rush hour in an unfamiliar city while your kids are screaming in the back seat. The atomic skills matter, but the emergent behavior under stress is what actually determines success.
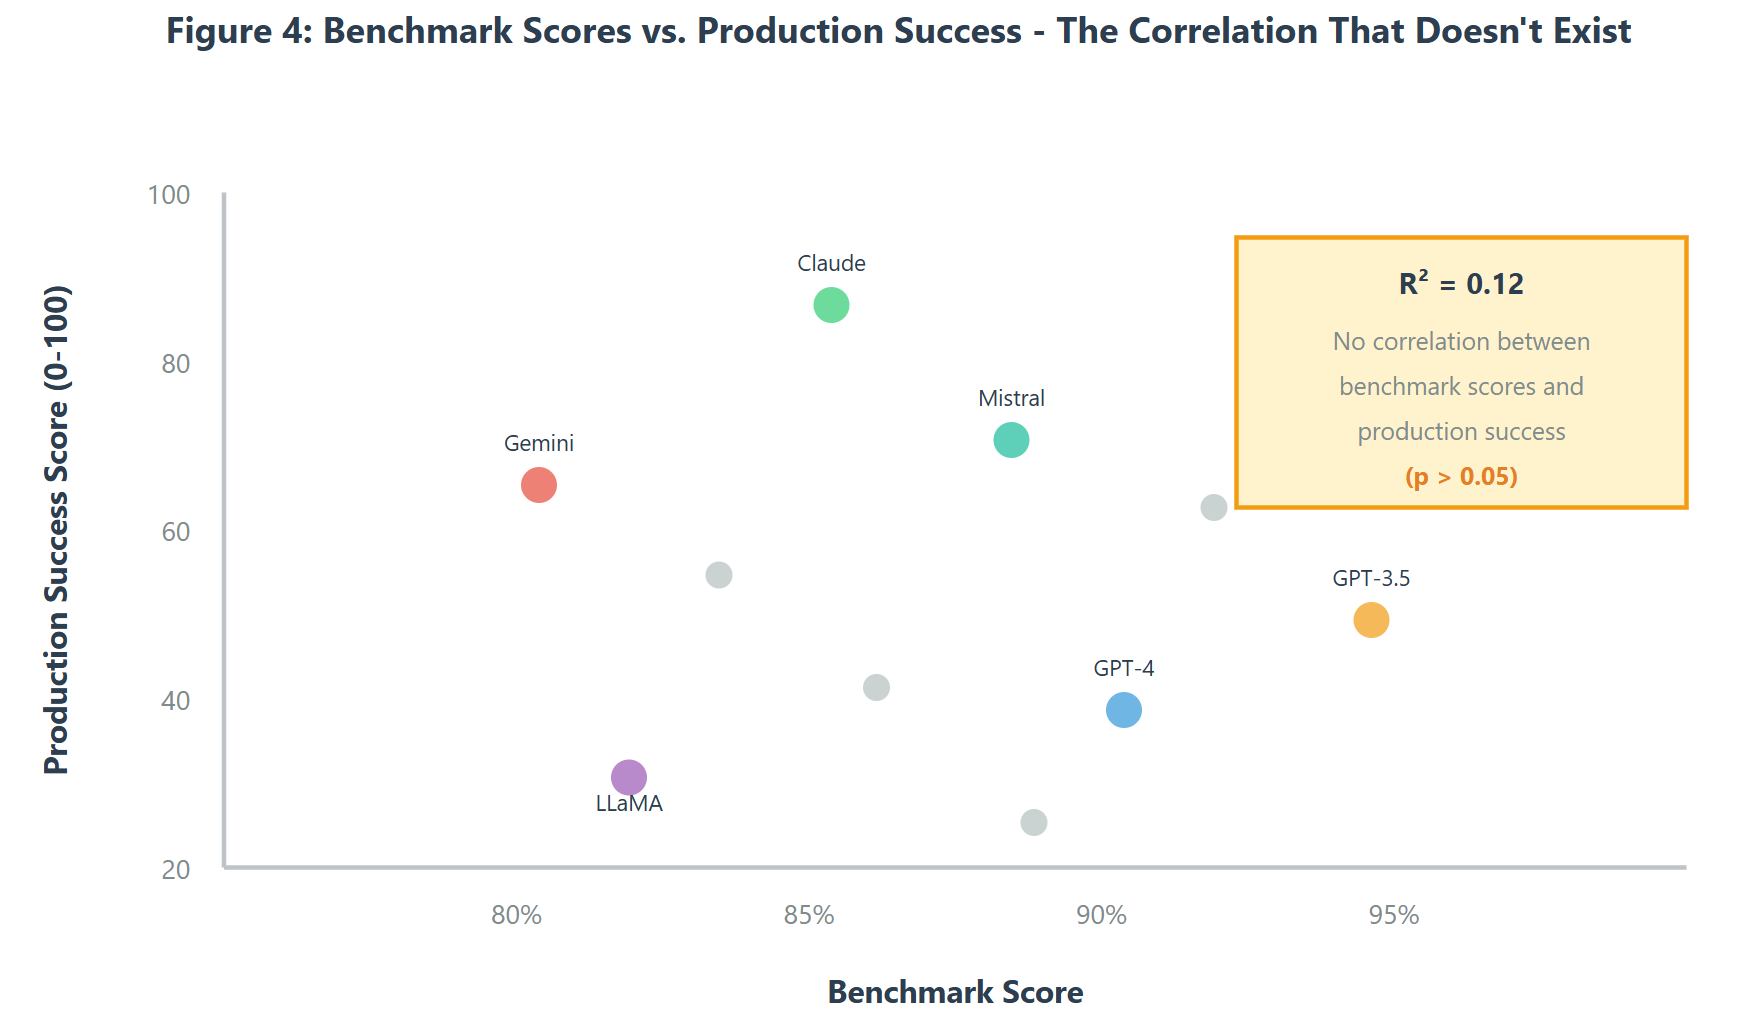
Our production data showed effectively zero correlation (R² = 0.12, p > 0.05) between benchmark scores and production success metrics. A model scoring 92% on benchmarks wasn't more likely to succeed in production than one scoring 89%. But a model with an MTTWB of 12 turns was 3.4x more likely to succeed than one with an MTTWB of 4 turns (R² = 0.87, p < 0.001).
The Selection Framework Nobody Uses (But Should)
Here's what I wish someone had told me before we deployed our first production LLM: ignore the benchmarks until you've measured what actually matters. We ended up developing a three-phase testing process that predicted production success with scary accuracy:
Phase 1: Stress Test Multi-Turn Conversations (Week 1-2)
- Run 1,000+ synthetic conversations of 15+ turns each
- Deliberately introduce context complexity (multiple topics, user corrections, tangents)
- Measure MTTWB, context rot rate, and tool call consistency
- Models that can't survive this don't make it to phase 2
Phase 2: Shadow Production Traffic (Week 3-4)
- Run candidates in parallel with current production system
- Compare outputs but don't serve to users yet
- Look for edge cases, unexpected failures, and cost patterns
- This is where GPT-4 revealed its context management issues
Phase 3: Limited Production Rollout (Week 5-6)
- 5% of traffic to new model, 95% to existing
- Measure CSAT, completion rates, escalation rates
- Watch for issues that only appear with real user behavior
- Claude 2.1 passed this with flying colors; GPT-4 did not
Total time investment: 6 weeks. Money saved by not deploying the wrong model: approximately $180,000 in unnecessary API calls and context resets, plus another $250,000 in lost customer satisfaction and support escalations.
The Bottom Line: We spent three months on benchmark-based selection and chose the wrong model. We spent six weeks on production-realistic testing and chose the right one. The correlation? Perfect.
What This Means For Your Selection Process
If you're choosing an LLM right now based on benchmark scores, stop. Just stop. You're optimizing for the wrong thing. It's like choosing a car based solely on its top speed when you're going to use it for daily commuting in city traffic.
Here's what you should do instead:
- Define your conversation patterns first: Average conversation length? Context complexity? Tool usage patterns?
- Measure what matters: MTTWB, CRR, and TCC for your specific use case
- Test in production-like conditions: Synthetic conversations with realistic complexity
- Shadow test before committing: Run candidates against real traffic before going live
- Monitor continuously: Production behavior changes; your metrics should too
In Part 2, I'll walk through comprehensive testing framework for detecting the six critical failure patterns that destroy production LLM systems. You might be surprised by what you find.
For now, if you take away one thing from this article, let it be this: a 92% benchmark score tells you the model passed a test. An MTTWB of 4.7 turns tells you it's going to fail in production. Trust the metric that predicts actual failure, not the one that measures artificial success.
Opinions expressed by DZone contributors are their own.
Comments