A Simple Roadmap of Linear Regression
An overview of the process of performing linear regression, including the data type you'll need and the steps to follow.
Join the DZone community and get the full member experience.
Join For FreeIf you want to deal with linear regression and want to understand the statistical basics behind the regression, this article aims to show the roadmap for your learning. In my one of the previous articles, I have talked about “The Journey of Probability and Statistics” and this article can be accepted as a proceeding of that previous article. As you start learning statistics, the first door you go in is "the probability" which defines the behavior of the real-life event with some mathematical phrases. Then comes the distributions. Of course, the normal distribution defines a (mostly) typical scenario. While your learning path continues, you collect your tools for the linear regression.
I simply define the roadmap for the linear regression as of the following:

Event Data
You collect data from real-life events. You will have several kinds of variables, such as categorical or numerical which are used to deal with the setup of the model. Here's a small sample from my previous article.

Event data is your base for the sample of the population. So you may have many sample sets for your model setup.
Distribution
The following figure gives a high-level overview of distribution:

Mostly we can expect the population distribution to be a normal one. But there could be other types.
Normal Distribution (for Residual Errors)
Remember the equation for Linear Regression, which is given below:

Most events tend to show normal distribution. In linear regression, errors are independent of normal random variables with a mean of zero and a constant variance.
Central Limit Theorem
In statistics, it is almost impossible to work with the population. Central Limit Theorem provides us a mean value which states that a sample mean is almost equivalent to the population mean, which gives us the ability to work with sample data. Of course, this is provided under a sufficiently large sample size. All the mean values of the subset of the larger sample size will be normally distributed regardless of the main distribution. This gives us the Central Limit Theorem.
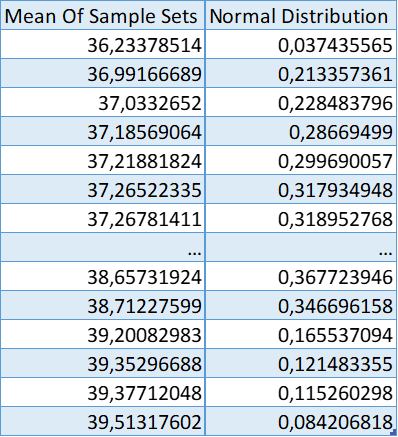
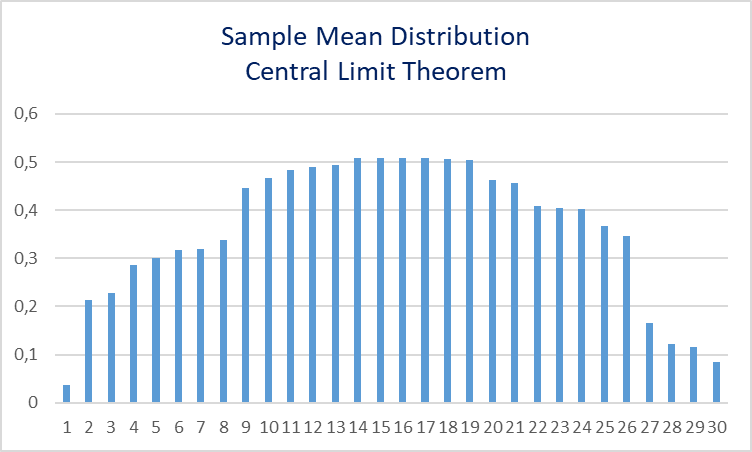
Here is a simple example with Excel. The table has a very large data set. Approximately 100 million pieces of data. With the ora_hash function, sample sets are selected and their mean value is calculated. "ORA_HASH is a function that computes a hash value for a given expression. This function is useful for operations such as analyzing a subset of data and generating a random sample." 30 sample sets are taken. The results are given below.
SELECT * FROM
(
    select 1 SAMPLE_NO, AMOUNT from TBLORDER
    WHERE 1=1
    AND AMOUNT > 0
  AND ORDER_STATUS = 'COMPLETE'
    AND ORA_HASH(ID, 10000, 1) = 0
    UNION ALL
    select 2 SAMPLE_NO, AMOUNT from TBLORDER
    WHERE 1=1
    AND AMOUNT > 0
  AND ORDER_STATUS = 'COMPLETE'
    AND ORA_HASH(ID, 10000, 1) = 0
    --...
    --30 More Sample
) A
PIVOT
(
    AVG(AMOUNT) --Mean Value of selected sample
    FOR SAMPLE_NO IN (1,2,3,4,5,6,7,8,9,10,11,12,13,14,15,16,17,18,19,20,21,22,23,24,25,26,27,28,29,30)
)
When you draw the graph in Excel you can get the output shown below.
|
|
Confidence Interval
A confidence interval gives us the estimation of the interval if it contains the population parameter. The lower and upper bounds of endpoints are calculated by using the sample population parameters. There is a probability of selecting a sample for which the CI has the true value of the mean. The boundaries are called "confidence limits" and the probability is called confidence coefficient (which is named alpha). The precision of the confidence interval is given by the length of the interval. The more narrow the interval, the more certain you are that the interval has the mean of the population. To get a narrow interval, you should increase the sample size.
With the help of Central Limit Theorem, you can find the most convenient interval for your statistical analysis.
P-Value
It is the calculated probability of being wrong. The p-value is used in hypothesis testing. Hypothesis testing covers two hypotheses:
H0: Null Hypothesis
H1: Alternative Hypothesis
The p-value is used to test if the null hypothesis can be accepted or rejected. If the probability of occurrence of the events is extreme we accept the null hypothesis. (image credit)

A threshold is chosen, and the p-value is compared with this threshold. The most commonly used threshold value is 0.05, usually. If it is smaller than 0.05, it can be said that we can reject the null hypothesis and alternative hypothesis can be accepted. The 0.05 value is a threshold value. It can be chosen different from 0.05 based on the sample size and test data.
T-Test
It is also known as the Student's Test. A T-test compares two data samples based on the mean and their standard deviation and tells how significant the difference between the two sets is. There are three types of t-tests:
- An Independent Samples t-test compares the means for two groups.
- A Paired sample t-test compares means from the same group at different times (say, one year apart).
- One sample t-test tests the mean of a single group against a known mean.
ANOVA (Analysis of Variance)
ANOVA is used to compare more than two groups based on the variance. So you can decide to reject or accept the null hypothesis based on the ANOVA f-statistics and p-value value for those groups.
Linear Regression
The final picture for this can be defined simply in the following figure :

Above are the necessary means to define and understand the result of the linear regression. Of course, all of them have more details. I just want to give a higher view of the process. And I am going to write another article on how to use and interpret the results.
Opinions expressed by DZone contributors are their own.
Comments