The Top Four Exception Tracking Services
Application exceptions are essential. Well, only if you want to find out why a user encountered a problem, why an error occurred, and why an application crashed.
Join the DZone community and get the full member experience.
Join For Freesoftware development is both challenging and complex. specifically, whether we’re developing landing page apps or linux kernel drivers, developing software often requires recording and analysis of vast swathes of information.
of that information, application exceptions are essential. well, if you want to find out why a user encountered a problem, why an error occurred, and why an application crashed.
take the example below. the exception’s message shows that a pdoexception was thrown, because a database table,
tblmovies
, wasn’t found. you can also see the original point of execution, right through to the class and line that threw the exception (
edited for readability
).
pdoexception thrown with message "sqlstate[hy000]: general error: 1 no such table: tblmovies".

stacktrace:
#28 pdoexception in /users/settermjd/documents/business/projects/zend expressive course/book-code/iteration-five/vendor/zendframework/zend-db/src/adapter/driver/pdo/statement.php:186
#27 pdo:prepare in /users/settermjd/documents/business/projects/zend expressive course/book-code/iteration-five/vendor/zendframework/zend-db/src/adapter/driver/pdo/statement.php:186
#26 zend\db\adapter\driver\pdo\statement:prepare in /users/settermjd/documents/business/projects/zend expressive course/book-code/iteration-five/vendor/zendframework/zend-db/src/adapter/driver/pdo/statement.php:212
#25 zend\db\adapter\driver\pdo\statement:execute in /users/settermjd/documents/business/projects/zend expressive course/book-code/iteration-five/vendor/zendframework/zend-db/src/tablegateway/abstracttablegateway.php:239
#24 zend\db\tablegateway\abstracttablegateway:executeselect in /users/settermjd/documents/business/projects/zend expressive course/book-code/iteration-five/vendor/zendframework/zend-db/src/tablegateway/abstracttablegateway.php:209
#23 zend\db\tablegateway\abstracttablegateway:selectwith in /users/settermjd/documents/business/projects/zend expressive course/book-code/iteration-five/src/movies/src/services/database/movietable.php:48
...
#5 zend\stratigility\middleware\errorhandler:process in /users/settermjd/documents/business/projects/zend expressive course/book-code/iteration-five/vendor/zendframework/zend-expressive/src/middleware/lazyloadingmiddleware.php:60
#4 zend\expressive\middleware\lazyloadingmiddleware:process in /users/settermjd/documents/business/projects/zend expressive course/book-code/iteration-five/vendor/zendframework/zend-stratigility/src/next.php:128
#3 zend\stratigility\next:process in /users/settermjd/documents/business/projects/zend expressive course/book-code/iteration-five/vendor/zendframework/zend-stratigility/src/middlewarepipe.php:102
#2 zend\stratigility\middlewarepipe:process in /users/settermjd/documents/business/projects/zend expressive course/book-code/iteration-five/vendor/zendframework/zend-expressive/src/application.php:374
#1 zend\expressive\application:run in /users/settermjd/documents/business/projects/zend expressive course/book-code/iteration-five/public/index.php:29
#0 {closure} in /users/settermjd/documents/business/projects/zend expressive course/book-code/iteration-five/public/index.php:30
do your applications record this information — ideally logging it to a central store? if they are:
- is the information readily accessible?
- can it be efficiently parsed?
- can you trace the problem back to an individual commit (and commit author)?
- does it provide additional metadata and heuristics that help make it more meaningful?
- does it contain personally identifying information (pii), credentials, or any other form of information that should be kept secure?
if it doesn’t satisfy all — or at least most — of these questions, then you’ll want to read this post and learn about four online services that do. we’ll start off, in no particular order, with raygun.
raygun
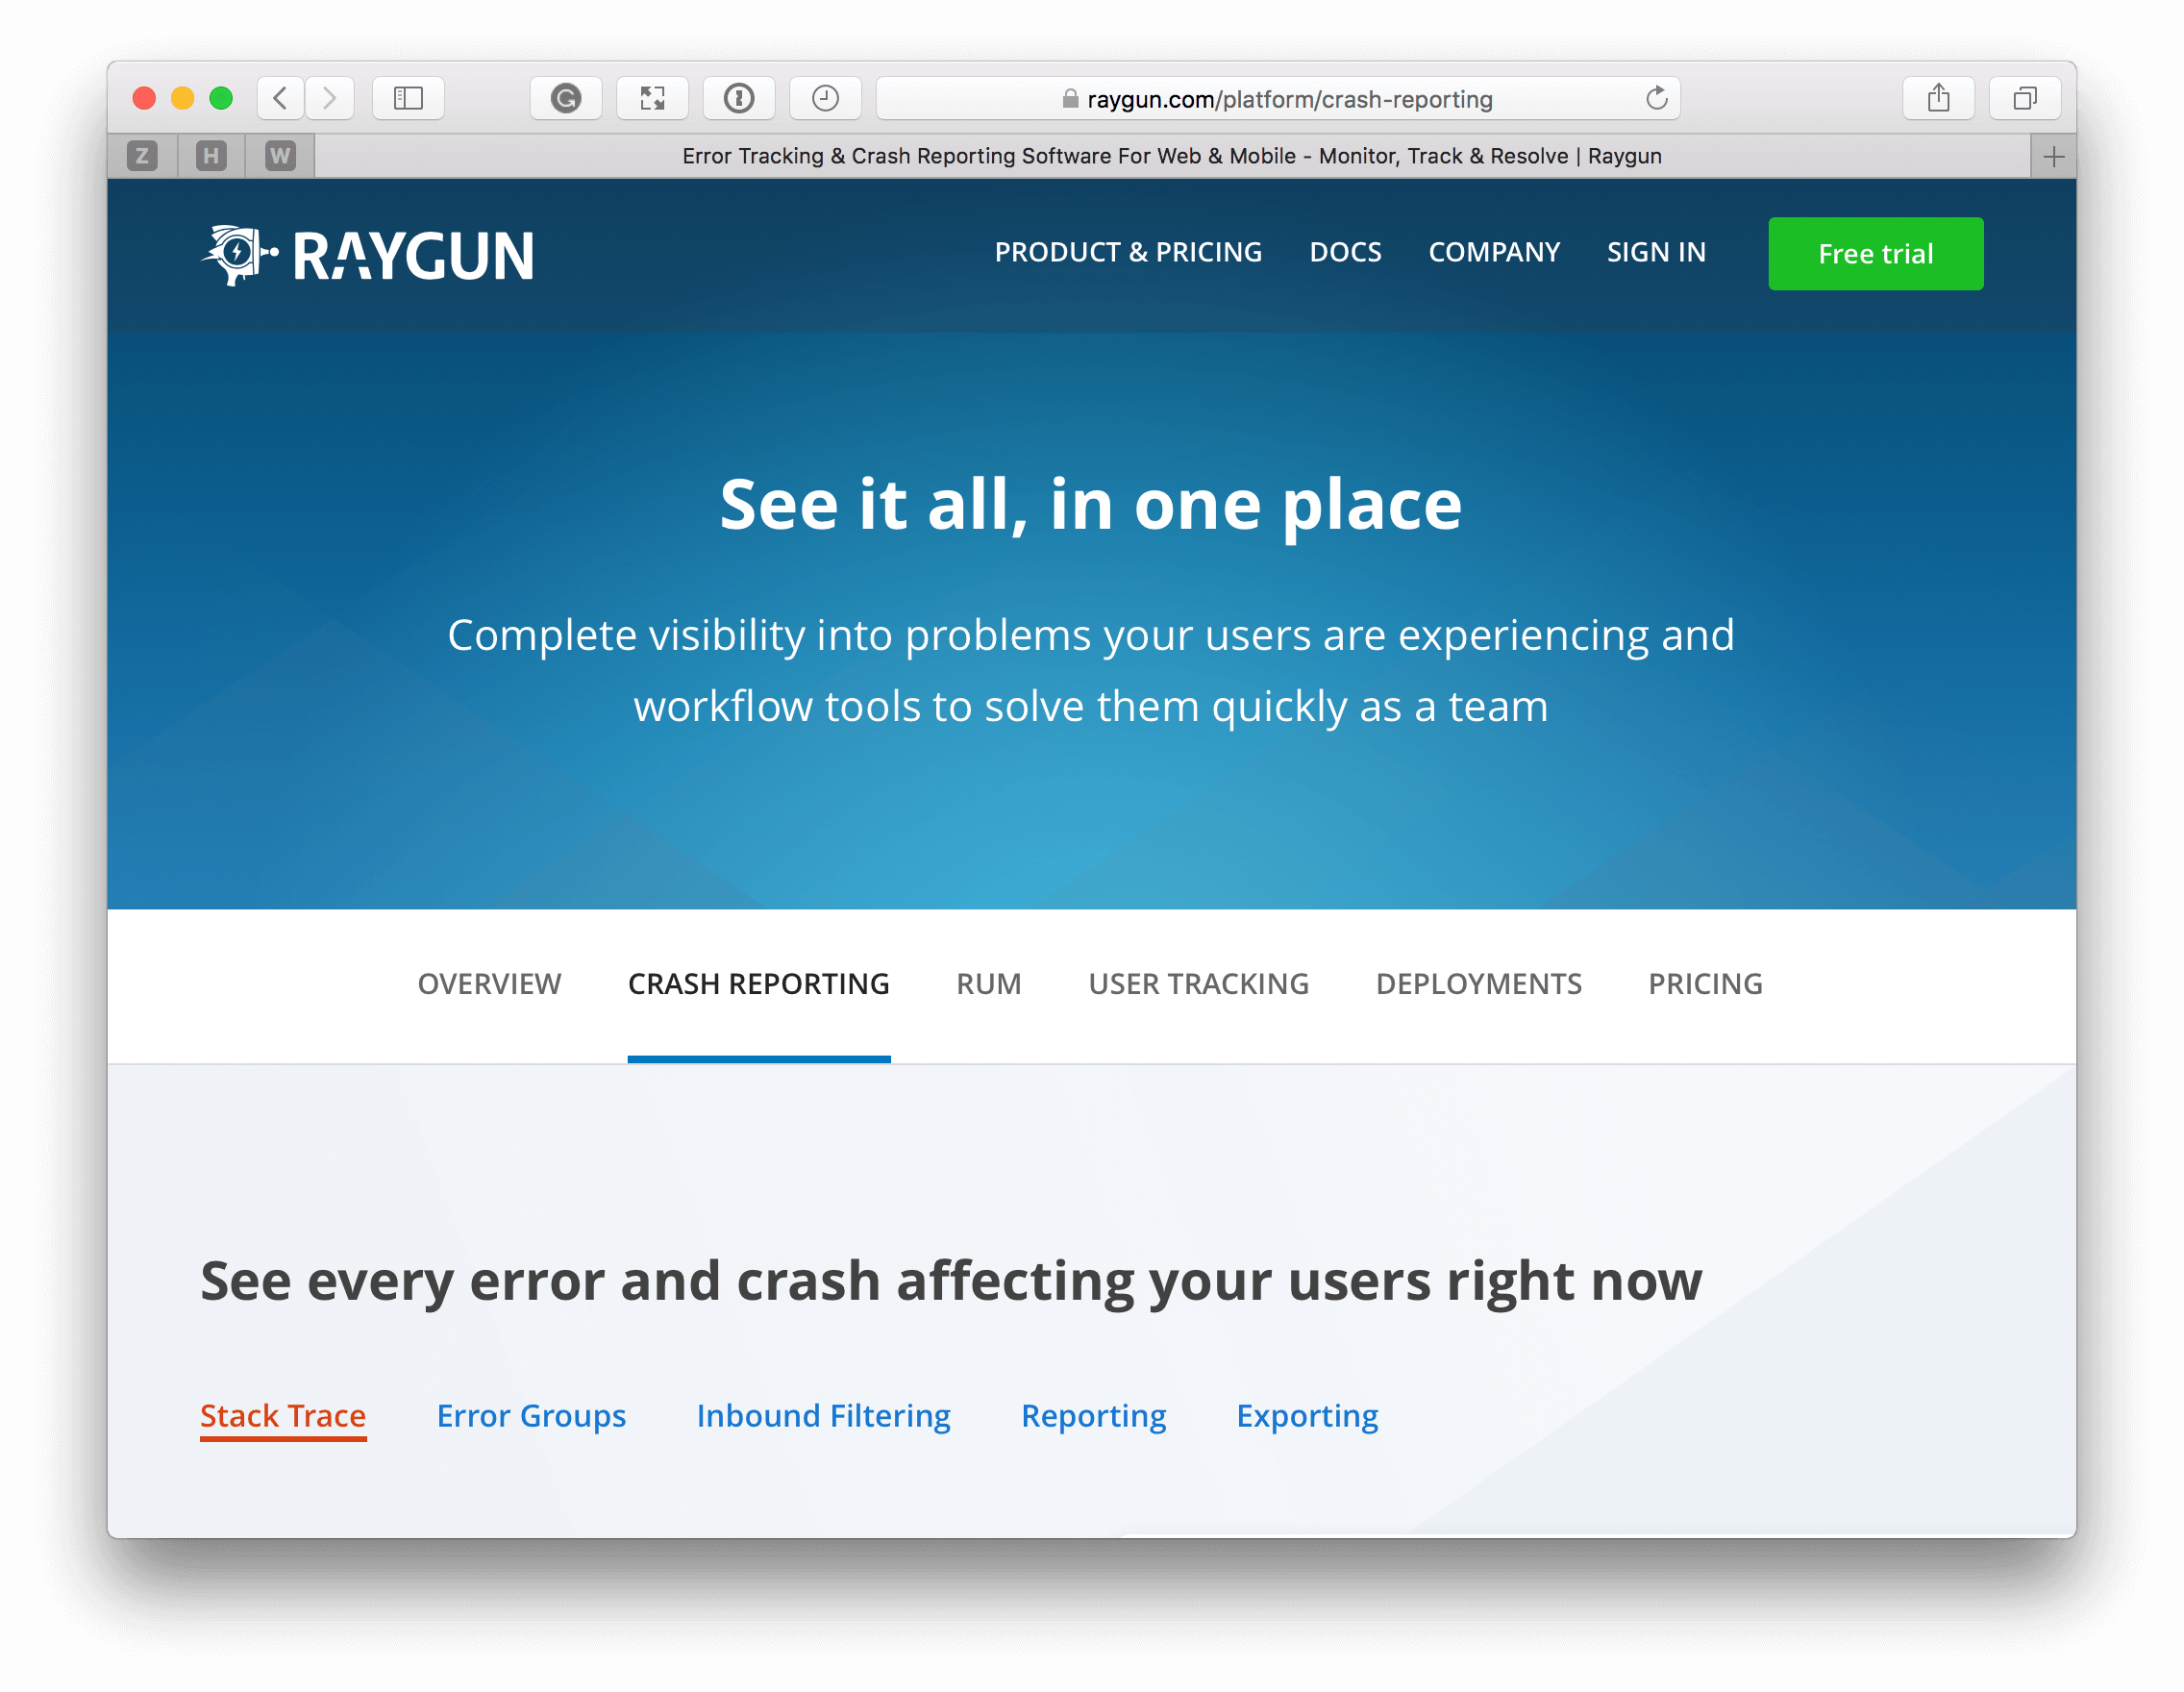
trusted by the likes of coca-cola, microsoft, slack, and 3m, raygun provides a modern and professional ui for tracking application exceptions. raygun is easy to get started with, thanks to the detailed and well-thought-out instructions available.
in addition to the setup documentation, raygun provides extensive documentation for all aspects of their service. it includes:
- setting up audit logs.
- managing teams and users.
- configuring integrations (which include bitbucket , pivotaltracker , visual studio team services , zendesk , slack , youtrack , and trello ).
- apis and webhooks.
raygun supports a range of languages, platforms, and frameworks. these include php , .net , android , ios , macos , wordpress , java , python , cold fusion , and c++ .
raygun’s offering is broken down into two primary sections: crash reporting and real user monitoring. crash reporting aims to help find, understand, and fix the exceptions which cause applications to crash. for every exception that is sent to raygun, it is broken down and organized so that it shows, among other things:
- when it occurred
- the page that it happened on
- the exception’s message
- the country of origin
the exceptions can be filtered based on a range of criteria, including browser, operating system, host, and machine name. real user monitoring, on the other hand, provides details about how the application is performing, including metrics, (where applicable) such as:
- average load time
- page load time
- the number of visitors and views
this feature helps users keep track of how each deployment affected the application, whether positively or negatively. the user dashboard can be fully customised to suit the needs of your project and team and can show details such as:
- load time
- global session distribution
- live user
- session count
- total users
- new users
- returning users
- average load time
another convenient feature is pulse, which shows live users of the site, where events are displayed in near-realtime. within that view, you can see details such as:
- load time
- number of sessions
- number of users
- a 24-hour session trend
- the most recent requests
- median load times
- most requested pages
- recent crashes
if you drill down to the page level, you can get comprehensive information on why a page is performing poorly, including dns lookup , latency , ssl overhead , page generation , and transfer time .
pricing
raygun’s pricing is broken down based on what your subscription includes. you can access either the entire platform or crash reporting or real user monitoring. at first blush, this seems like a very flexible pricing structure.
plans start as low as $19 per month and range as high as $1,499 per month. as you’d expect, the features increase as the plan price increases. check out the pricing page and see what combination best suits your needs. and don’t forget, you can sign up for a 14-day free trial.
airbrake
airbrake
airbrake is used by companies such as sendgrid, groupon, soundcloud, salesforce, and ted, and complies with the following standards: hipaa , pci & sox .
airbrake supports a large number of languages and platforms, including java , javascript , php , go , node , swift , magento , django , .net , and ruby on rails . it has integrations with a range of standard services, including bitbucket , github , pivotaltracker , flowdock , campfire , jira , hipchat , and assembla .
in contrast to raygun, airbrake doesn’t appear as feature-rich, nor is its ui as fleshed out. for example, whereas raygun supports logins via facebook, google+, twigger, and github, airbrake only supports github.
what’s more, airbrake’s documentation isn’t as extensive. that said, however, the service itself is still excellent, and it provides detailed setup instructions to get you started, regardless of your language or platform.
looking more closely, airbrake replaces an application’s default error handler with an open source error and exception notifier. it catches the standard types of errors, including 404s, and 500s, login problems, and other application-specific errors.
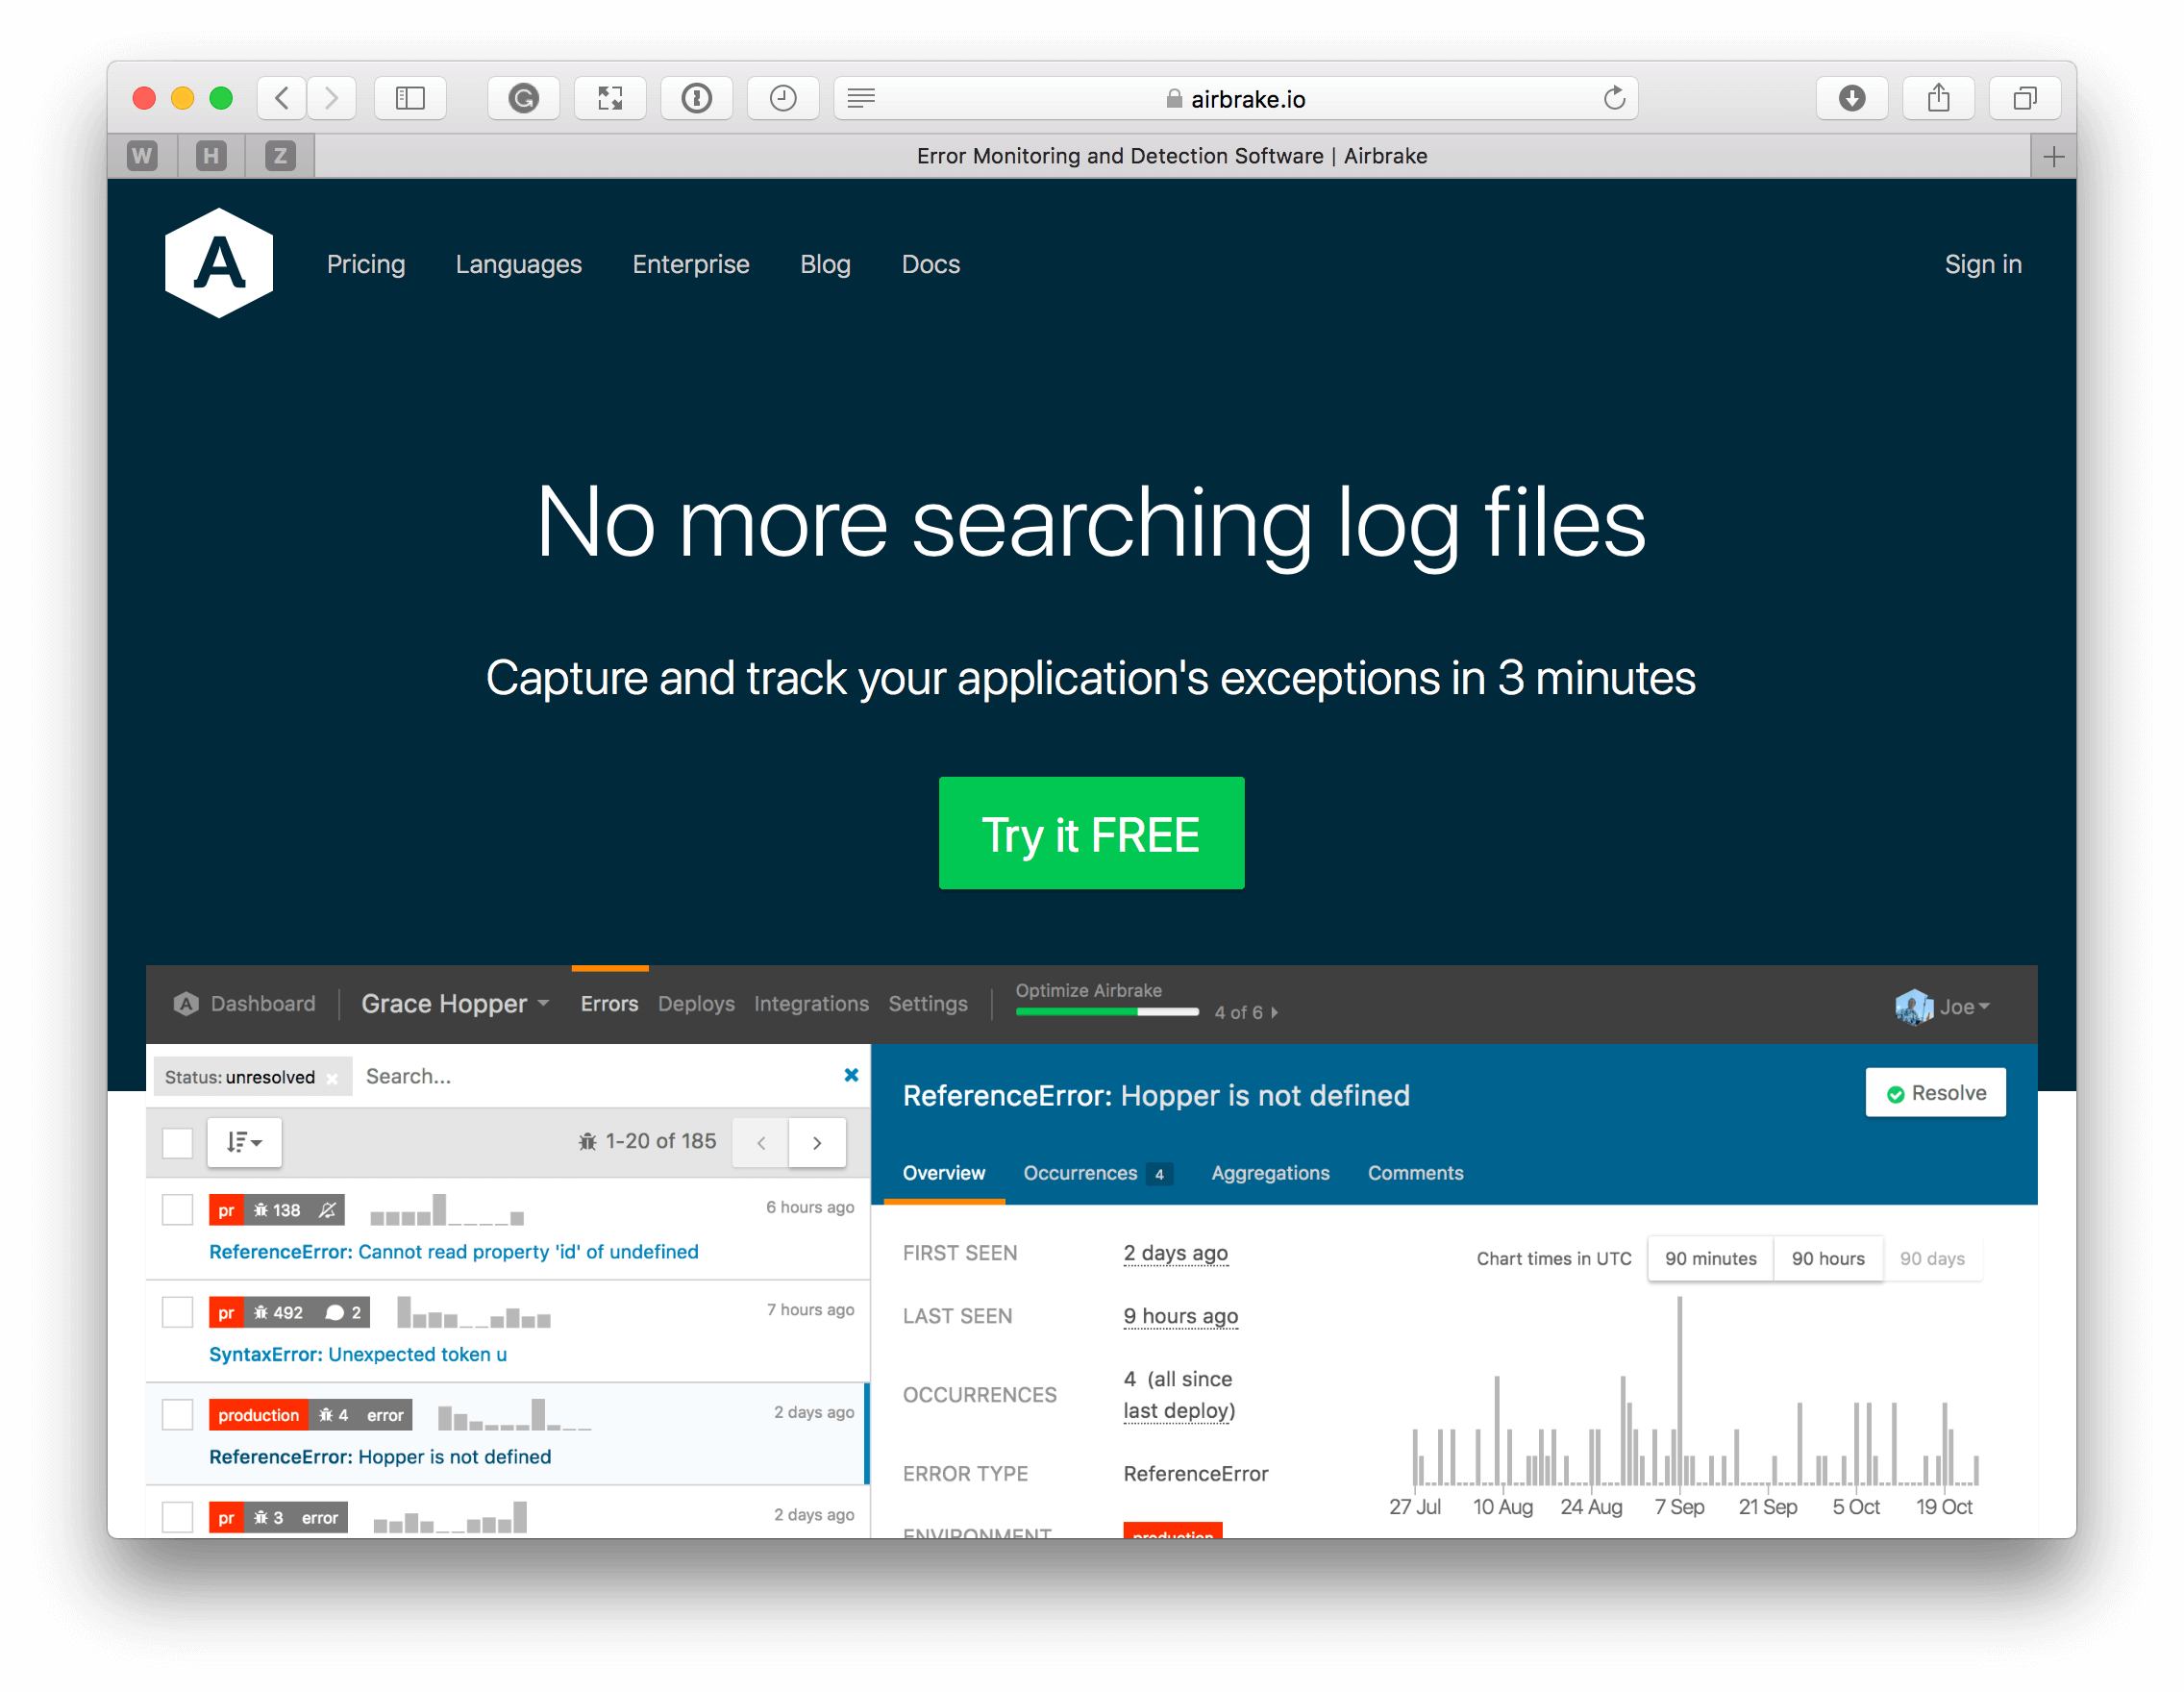
the notifier then provides comprehensive details about application exceptions to airbrake, which in turn parses and organizes that data to provide greater visibility, and details of the exceptions that occurred. the dashboard data includes such information as:
- the number of times an exception has occurred
- the environment in place at the time the error occurred
- a full backtrace
- parameters in place at that moment
- how many times an exception occurred since the last deploy
- the exceptions that a deploy fixed
exceptions can be filtered by an environment, prioritized by error count, environment, and users. airbrake makes it easy to turn exceptions into tickets so that they can be tracked through to resolution, and deployed to various environments.
pricing
airbrake’s pricing structure is flatter and a lot simpler than raygun’s. it supports four options. these start as low as $49 a month and go up to $249 a month. i think this flatter pricing structure can be a good thing, as you don’t have to pick from a wide array of options.
if you’re keen to have a look at airbrake, check out the pricing page for further pricing and feature details. and don’t forget to take advantage of the 30-day free plan.
sentry.io
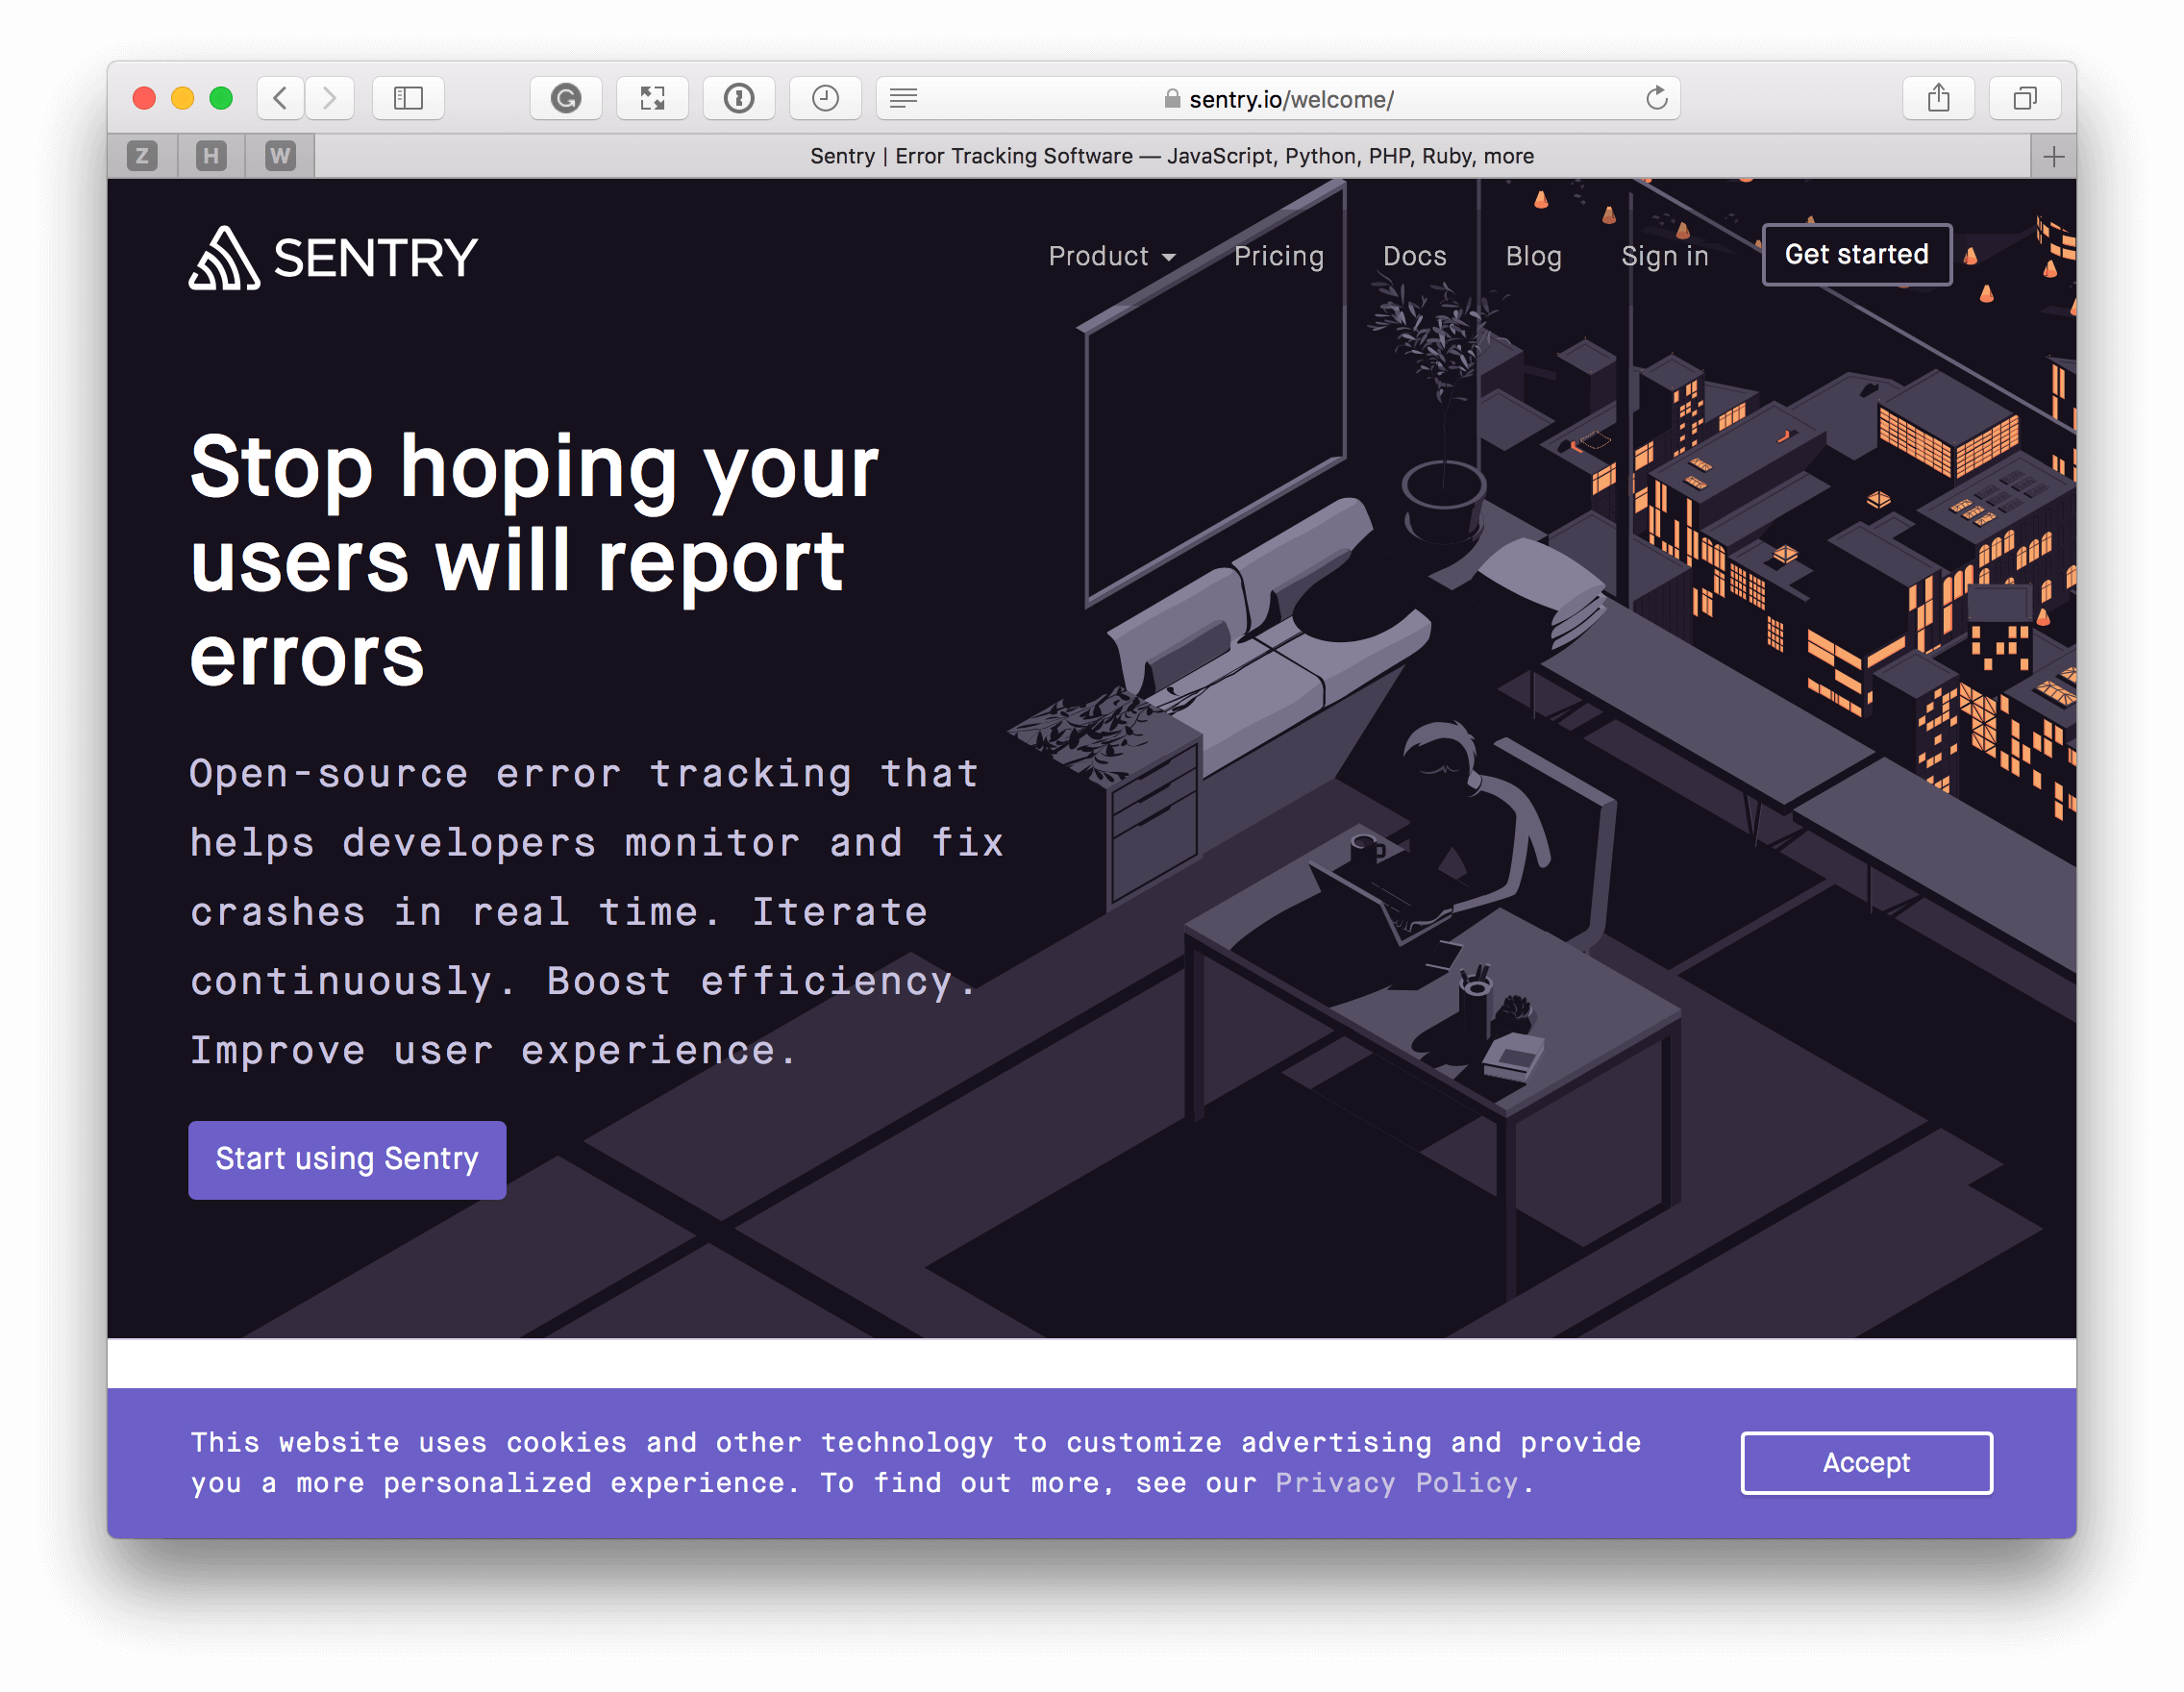
sentry is one of the most impressive looking of all four options and is used by such notable companies as dropbox , airbnb , paypal , and microsoft . written in python, it supports an api that can handle events from any language and application.
sentry supports a wide array of languages and platforms, including javascript , ember , python , ruby on rails , php , ios , android, go, .net , java , objective-c/swift , and perl . it integrates with most of the commonly used developer services including slack , github , trello , heroku , gitlab , twilio , pagerduty , datadog , and youtrack .
like most of the services in this list, it has extensive, searchable documentation, organized in a very logical manner. in addition to that, sentry supports a community forum and viewing and creating issues on their github repository.
i find that the sentry dashboard is very well laid out, very clean, and very well organized. you can quickly get an overview of all your projects, drill down into one specific project to find out more about it, move between the issues within a project, such as unresolved and needs triaging.
a key feature set which appealed to me is the security and privacy settings. there, you can enable enhanced privacy and data scrubbing, which ensures that personally identifiable information and other types of sensitive information are scrubbed from the logs, so that it can never, accidentally leak out.
looking at the core functionality, exceptions that are sent to sentry can be interrogated based on a range of criteria including:
- the environment
- browser
- operating system
- the route that triggered the exception
- when the exception occurred
- the software release
- exception severity
- server name
- when it was last seen
- number of active users affected by the exception
- error type (http error, 500, and 404)
- the number of times the exception has occurred
- whether it’s resolved or not
sentry also supports a concept called breadcrumbs . as the name implies, it’s a trail of events which happened prior to an issue.
breadcrumbs contain the following features:
- message: a string describing the event. the most common vector often used as a drop-in for a traditional log message.
- data: a mapping (str => str) of metadata around the event. this is often used instead of message, but may also be used in addition.
- category: a category to label the event under. this generally is similar to a logger name, and will let you more easily understand the area an event took place, such as auth.
- level: the level may be any of error, warning, info, or debug.
from all this, you can see that it’s one of the more comprehensive of the offerings in today’s list. one other notable plus is that it supports both an open-source and fully-hosted offering. given that, you can pay nothing and host it yourself, or you can outsource it to sentry. the choice is yours.
pricing
of all the services, i like sentry’s pricing structure the most, likely because they support a hobbyist account, which is forever free. it’s handy if you’re just experimenting with the service, or dabbling with a project which may or may not go anywhere.
they support a range of plans, starting with the small plan at $26 a month, right up to large, at $449 a month. if your needs exceed that, like the others, they also support an enterprise plan.
an extra nicety of sentry is that each plans limits are not hard limits, as additional events can be sent for $0.00024 per event on monthly subscriptions or $0.00019 with yearly plans. for more pricing and feature information, check out https://sentry.io/pricing/ and be sure to take advantage of the hobbyist plan if you’re keen to trial the service.
rollbar
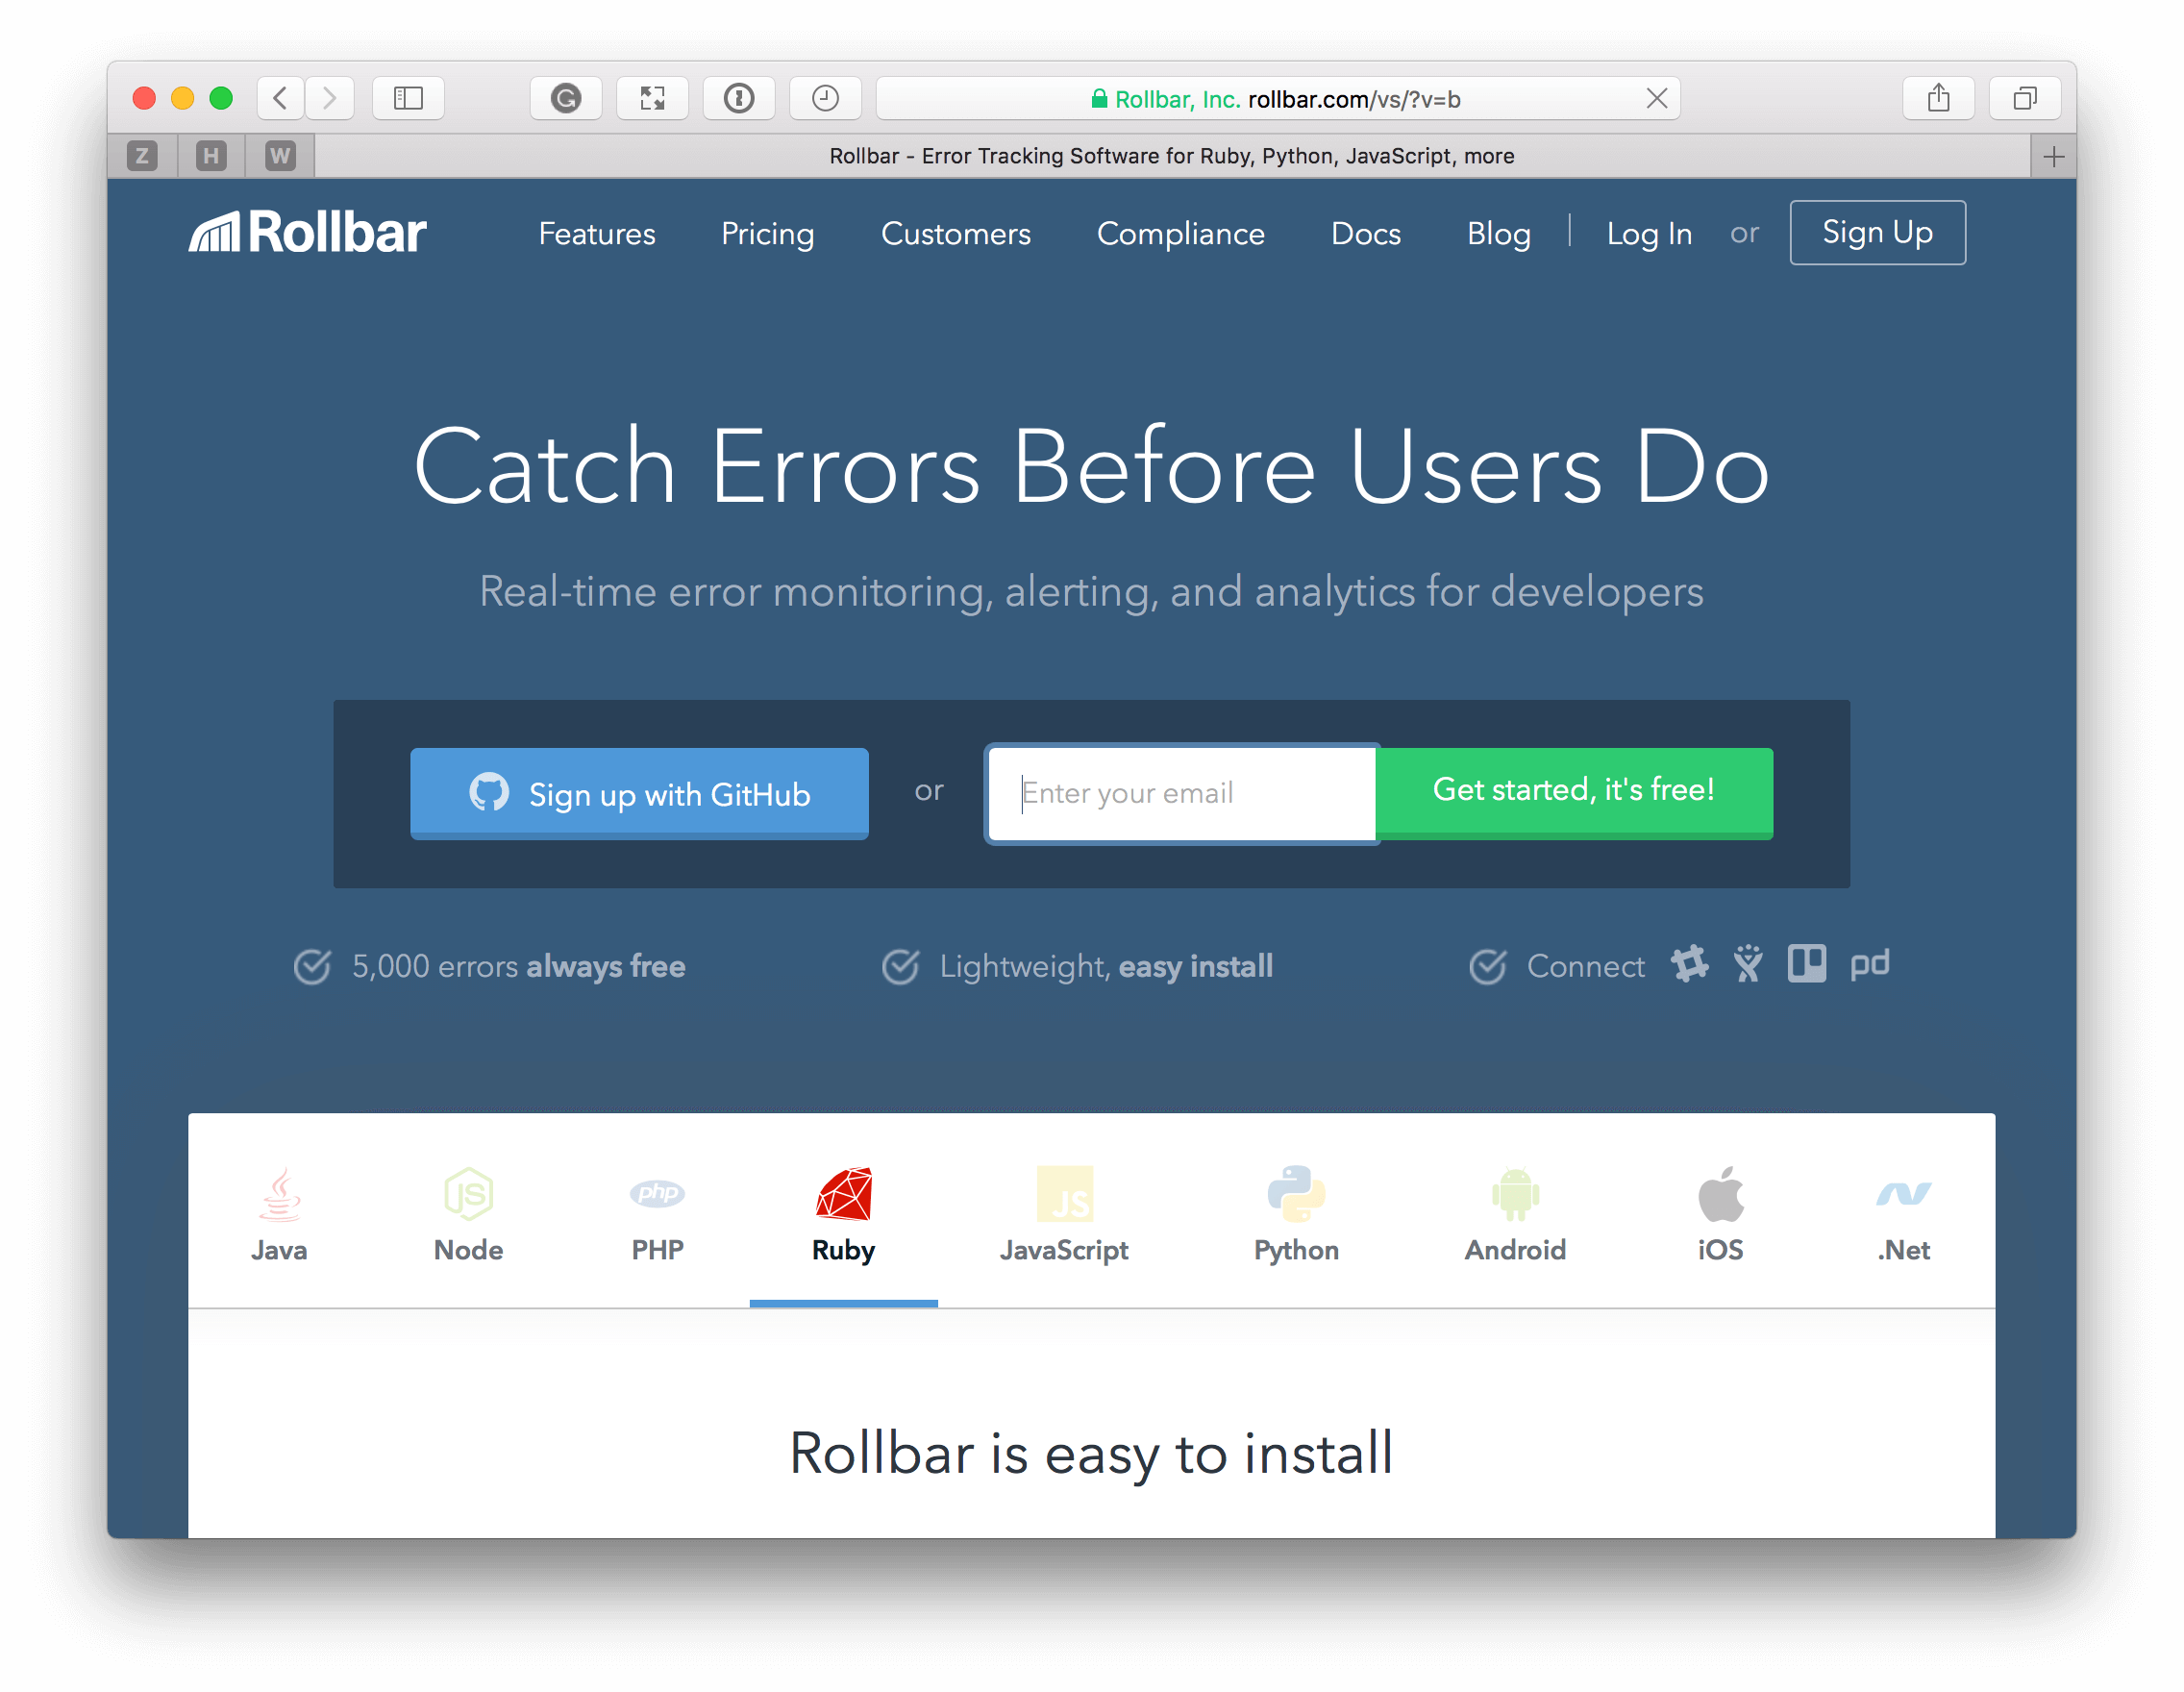
rollbar is used by companies such as kayak , heroku , salesforce , and instacart . it supports languages such as ruby , php , node , python , and java , and platforms such as ios , and android . in addition to these, it integrates with most of the standard services, such as slack , hipchat , logstash , mailgun , jira , trello , sprintly , help scout , and pagerduty .
rollbar complies with a range of industry standards, including hipaa, iso 27001 , and privacy shield: . it is protected by 2048-bit ssl encryption, single sign-on, and 2fa.
like all of the services, there is a setup wizard to help you get started, and documentation is extensive. in addition to this documentation, support is available via email, irc, phone, and live chat.
rollbar supports several features to help ensure information privacy. these include encrypting data at rest, pii, pci data filtering and removal, auditable logs of user activity, and both internal and independent pen testing.
what’s particularly handy about rollbar is that you can trace problems often back to the commit which introduced them, as it has full integration with github , bitbucket , and gitlab . this information can be found via the dashboard, via the api, or by using rql (rollbar query language) .
to quote the documentation:
rollbar query language (rql) provides a rich sql-like interface to the data in rollbar. rql supports running select queries on two logical tables, item_occurrence, and deploy. basic group by, order by, limit, and aggregation functions are available, as are arbitrary expressions in the where clause.
for example:
select request.user_ip, count(*), count(server.host), avg(body.message.seconds), max(timestamp)
from item_occurrence
where item.counter = 840
  and timestamp > unix_timestamp() - 60 * 60 * 24
group by request.user_ip
order by count(*) desc
limit 100
the dashboard, while simple, shows a copious amount of information. you can see, by default:
- the top 10 issues in the last 24 hours
- the top 5 active items in the last 24 hours
- the top 5 active items in the last week
you can filter the report by the environment. you can look at a list of all items, viewing how many times they occurred, a 24 hour trend, the last time it occurred, which environment it occurred in, and the language.
drilling down into an item shows you the entire history of that exception. you can see the browser, operating system, request method, request url, server hot, and the exception message.
the exception can also be linked to a version control system issue, allowing for it to be resolved and pushed through to deployment, with a full history. the information is comprehensive, yet not presented in an overwhelming way.
pricing
like the other services, rollbar offers a range of plans in quite a flat structure. they have a free for personal project. and the paid plans start at $49 per month and go up to $599 per month for the premium plan.
in addition to these, you can get a custom arrangement if your needs aren’t matched by one of the default options, or you have special security and compliance needs.
in conclusion
that’s been a look at four of the market’s best online exception tracking services. speaking personally, rollbar and sentry are my favorites, because of the depth of functionality and the professional appeal of their dashboards. in a nutshell, they’re so comprehensive! however, that level of information may also be overkill for your situation.
regardless, if you’re keen to begin tracking exceptions that you’re application’s encountering, or to migrate away from a homegrown solution and outsource it to a dedicated, professional, service, i strongly encourage you to consider one of the four we’ve covered today. i’d suggest that at least one of them will suit your application’s needs, allowing you to devote more resources to your application.
if you’re already using one of them, share your feedback in the comments. if you’re using a service not listed here, let us know what it is and what your experience has been like. the more we know, the better off we’ll all be.
Published at DZone with permission of Matthew Setter. See the original article here.
Opinions expressed by DZone contributors are their own.


Comments