Top 6 JavaScript Family Tree Diagram Libraries
In this article, we review popular JavaScript diagramming libraries that help to build family tree diagrams.
Join the DZone community and get the full member experience.
Join For FreeA family tree is a type of diagram used for showcasing a person’s ancestry and generational bonds in a compelling tree-like structure. This data visualization tool is widely utilized in historical, genealogical, social, or medical web projects.
Building a well-structured and informative JavaScript family tree diagram from scratch and integrating such functionality into an existing web app can be a challenging task. That is why web developers frequently rely on JS components to speed up the process and avoid unnecessary bugs.
Let us review popular JavaScript diagramming libraries and their main features that help to produce family trees with the least effort.
DHTMLX Diagram
DHTMLX Diagram is a JavaScript library with ample customization and configuration possibilities that allows building cross-browser diagrams of various types and any scale much faster. Apart from family trees, you can visually present different volumes of data via org charts, flowcharts, UML class diagrams, etc.
Using a convenient API of this lightweight library, you can easily create a JavaScript family tree diagram with the help of built-in shapes. If you need to make the look of your family tree more sophisticated, it is pretty simple to supplement the cards of family members with the required HTML content, such as any text, image, or icons. You can even equip shapes with a compact context menu to provide users with interactive controls.
Numerous styling options allow modifying the look and feel of the diagram according to your needs via the API or CSS. The DHTMLX control can be seamlessly integrated into web apps based on popular JS frameworks (Angular, React, Vue.js).
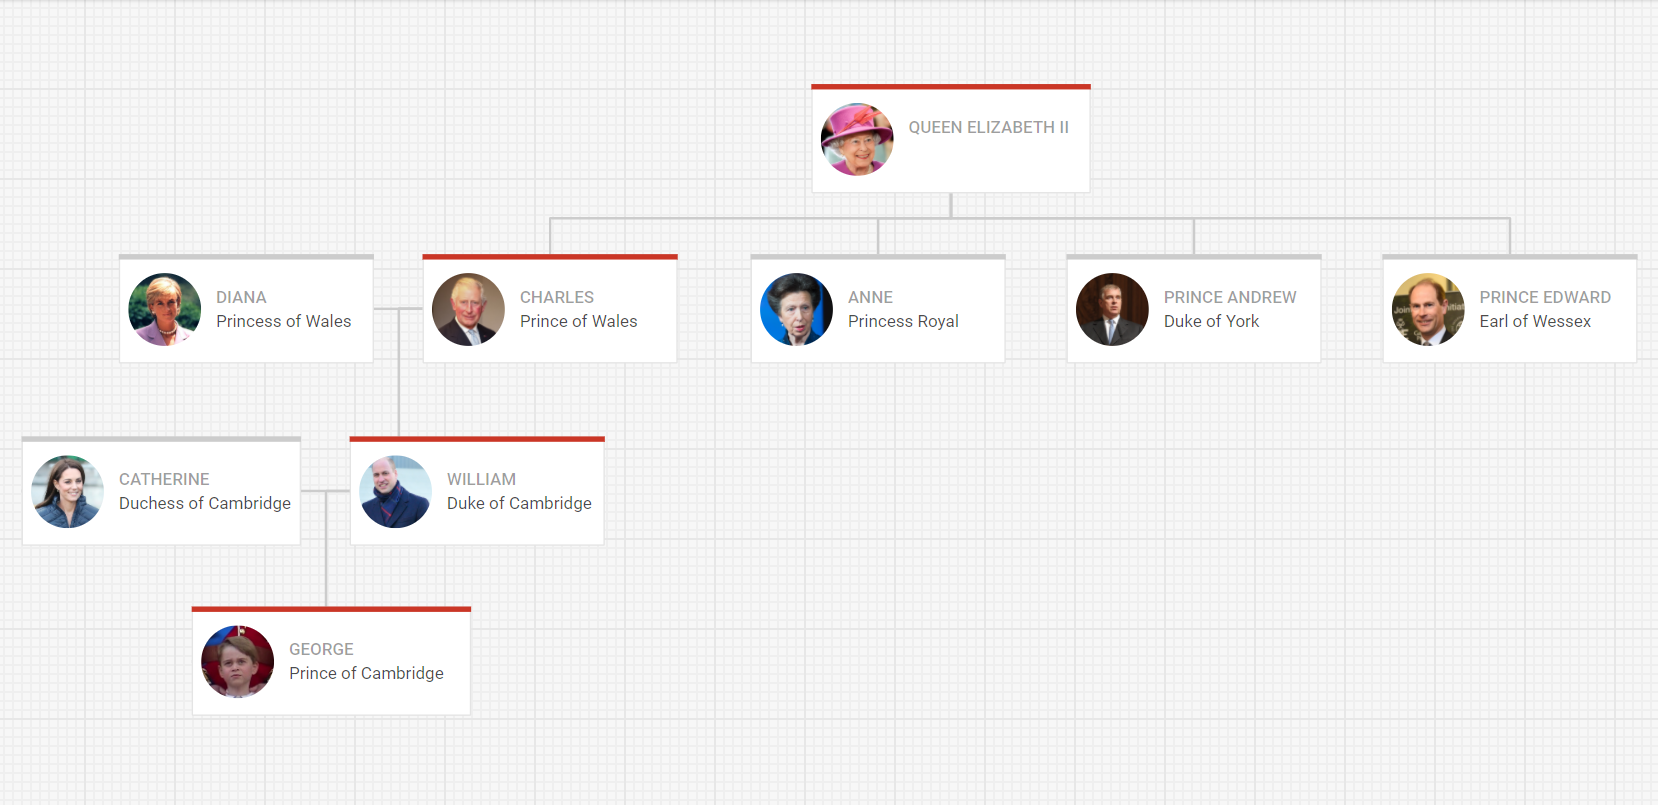
Learn how to build such family trees and other tree diagrams with DHTMLX in this step-by-step guide.
But more interestingly, DHTMLX Diagram comes with live editors enabling you to easily build family trees and other diagrams and edit them on-the-go without manipulating code. The left panel of the editor allows selecting necessary shapes with drag-and-drop. The right panel offers various editing settings for the selected shape: dimensions/positioning, coloring, stroke, and content modification options. The editor can be adjusted to the needs of your project. For example, it is possible to add custom shapes in the editor and set any parameters for their editing.
If you are working with a sizable diagram, you won’t even need to think about how to arrange it in a better way, as the auto-layout algorithm will do the job for you. Moreover, some handy functionalities include expanding and collapsing family tree branches, zooming in and out, and searching for a particular shape using the search field that will make your interactions with large diagrams more productive and less time-consuming. The completed family tree diagram can be exported to PDF, PNG, or JSON format.
Benefiting from all-encompassing documentation, including detailed guides and interactive samples, you will be able to quickly learn the main concepts of the DHTMLX Diagram and get the best out of its rich feature set.
Trial version: DHTMLX Diagram
Price: from 599$ to 2,899$
yFiles for HTML
yFiles for HTML is a JavaScript graph visualization toolkit designed for generating various graphs and diagrams, including family trees. It also allows utilizing modern drawing technologies such as SVG, WebGL, and HTML5 Canvas that can be combined for creating good-looking diagrams.
When it comes to visualizing individuals in family tree diagrams, yFiles for HTML offers ready-made geometric shapes with the support for color-coding specifying the individual’s gender and multiple text labels to make your diagram more info-packed. Editing features such as zooming, panning, undo/redo help to apply any changes in your diagram with no trouble.
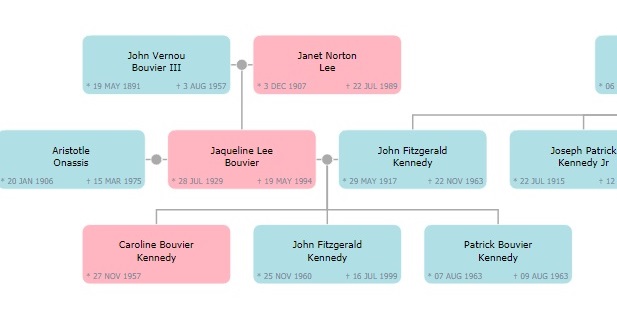
Moreover, you can also take advantage of a special-purpose FamilyTreeLayout algorithm that provides nontrivial approaches to arranging the members of families. For instance, the algorithm factors in types of family tree nodes (based on gender) when configuring the diagram structure.
Support for Typescript bindings and modern ECMAScript features and compatibility with major JavaScript frameworks help expand the applicability of this library. A collection of demo applications, a developer’s guide, and tutorials will give you a clear understanding of how to use yFiles for HTML in real-case scenarios.
Trial version: yFiles for HTML
Price: from $11,900.00
GoJS
GoJS is a TypeScript-based solution intended for producing diagrams and graphs of varying complexity – from basic tree-type diagrams to comprehensive industrial diagrams. For example, you can create a traditional family tree with collapsible levels and all related attributes or come up with a genogram - an extended version of a family tree showing relationships within a given family in more detail.
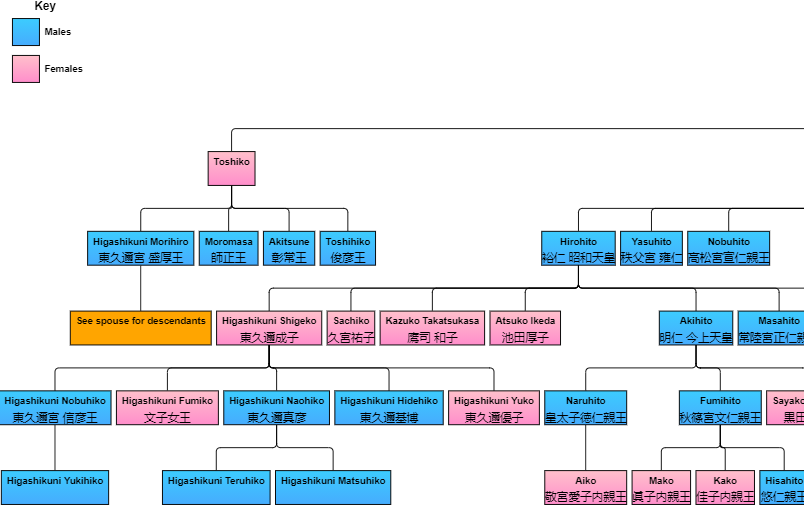
Part of the Japanese Imperial Family tree. Check the full demo.
Сustomizable templates and layouts ensure time savings when constructing a diagram of your choice. Besides, GoJS provides a range of features such as in-place text editing, tooltips, context menus, palettes, overviews, etc., which will improve user experience. There are also special tools that can be employed to perform customizations and animate different elements of your diagram.
GoJS functions independently from any 3rd party tools. It fits well into web apps developed with the use of common JavaScript frameworks. GoJS also operates in headless or server environments such as Node.js.
Technical descriptions, full API documentation, and multiple interactive samples will give you an insight into the technical peculiarities of GoJS and give you the idea of how to start with it in your apps.
Trial version: GoJS
Price: from 3,495$ to 9,950$
Basic Primitives Diagram
Basic Primitives is a diagramming JS library focused on depicting family trees and org charts as well as hierarchies, PERT charts, technology trees, and business ownership diagrams of any size. This web-based tool is especially convenient for reporting and analytics.
All diagrams created with Basic Primitives are rendered in major web browsers using popular design technologies (SVG, Canvas).
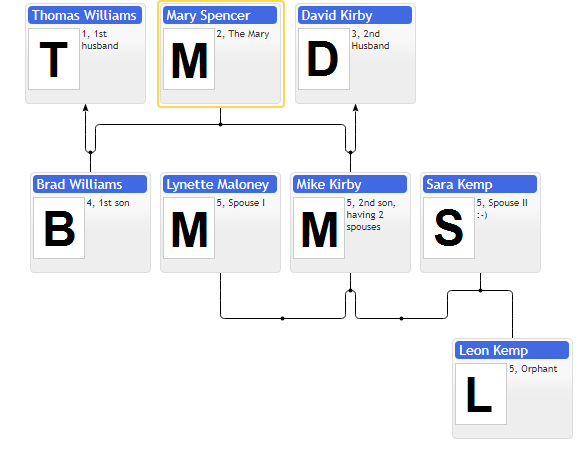
Utilizing a special autofit mode, it won’t be a problem for users to review the details of a specific diagram node. This feature increases the size of a selected node and automatically scales it back once the user goes to the next node, thereby making it easier to interact with diagram nodes and navigate through large family trees. This JavaScript library also makes it possible to automatically arrange family tree nodes based on ordering rules specified by users. Remarkably, these rules can be ignored by the system in case they are not applicable.
If you commonly utilize React, Angular JS, and jQuery, you won’t have to make up any workarounds for adding Basic Primitives diagrams to your app. To simplify the whole integration process, you can resort to the demos, use cases, and API references provided by the development team.
Trial version: Basic Primitives
Price: from 427$ to 2,308$
OrgChart JS
OrgChart JS is a JavaScript plugin with broad customization capabilities specifically designed for providing a diagrammatic representation of org charts. Apart from organizational hierarchies, this tool can be used for illustrating family tree diagrams.
When creating your first family tree with OrgChart JS, you can take advantage of predefined templates. It is also possible to create custom templates or apply multiple templates simultaneously in one diagram. Moreover, OrgChart JS allows implementing an unlimited number of subtrees in one chart object. If you have certain requirements regarding the appearance of your diagram, custom CSS will help to make the necessary adjustments.
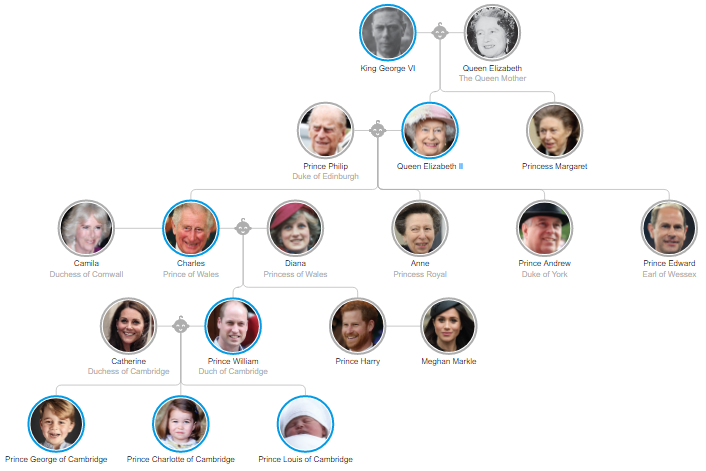
The built-in edit form is another useful feature of this plugin that enables you to quickly update the diagram or its elements. Navigation features and expand/collapse options will aid you in working with data-intensive diagrams. If you want to share your family tree with others, OrgChart JS provides the following exporting formats: PDF, PNG, SVG, CSV.
The documentation page will give you a clear description of all OrgChart JS features and a step-by-step explanation on how to integrate this JavaScript plugin in React, Vue.js, or Angular projects.
Trial version: OrgChart JS
Price: from 399$ to 4,999$
dTree
dTree is a JavaScript library designed for creating basic family trees (or other hierarchical graphs) with numerous parents. This lightweight front-end instrument is based on more sophisticated D3.js, which utilizes the latest web standards for presenting data with various types of visual interfaces. dTree uses a simple JSON data format.
 Diagrams produced with dTree can be examined via the Treehouse online viewer that allows hosting your family tree diagram without the need to create a website or interact directly with dTree. It takes data from GitHub and shows it in a good-looking format. Please pay attention that before utilizing this JS library in your app, it is necessary to load D3 v4.x and lodash v4.x. Learn more about the installation and usage of this simple library on its GitHub page.
Price: Free (MIT license)
Final Words
In summary, we can say that there is a range of JavaScript family tree diagram libraries to choose from when considering the most suitable diagramming component for your project. All the reviewed products allow building family trees as well as other diagrams and enrich them with various functionalities. Which is the right one? You are the only person who can answer this question. But it may be easier to make the final choice after you pick several variants, including features that are vital for you, compare their prices, and test them in practice using trial versions. Thus, you can find a solution that fully complies with your financial and technical requirements.
Opinions expressed by DZone contributors are their own.

Comments