Understanding Code-Call Graphs
Understanding code is a daunting task, especially if it is written by someone else or not documented properly. See how this open source tool, Doxygen, can help.
Join the DZone community and get the full member experience.
Join For FreeGoing through the code and understanding it is a daunting task, especially if the code is written by someone else. It would be a nightmare if the code is not documented. The plight is usually for the developers who are tasked to maintain a code that is written by someone else.
Sometimes the situation is developers don't know where to begin and understanding it is, even more, a herculean task. It would be great if they had somewhere to start and understand the code that they are going to breathe through.
Enter Doxygen! Doxygen has been there for almost a quarter of a century, written by Dimitri van Heesch. There are other tools documentation generators too. Javadoc for example is very popular because of the way the code documentation is organized.
The beauty of Doxygen is it has features to help understand code better even if the code is not documented properly. It supports these source languages out of the box - C/C++, Java, Python, VHDL, PHP IDL, C#, Fortran, Objective-C 2.0, and to some extent D. It also supports a variety of output formats.
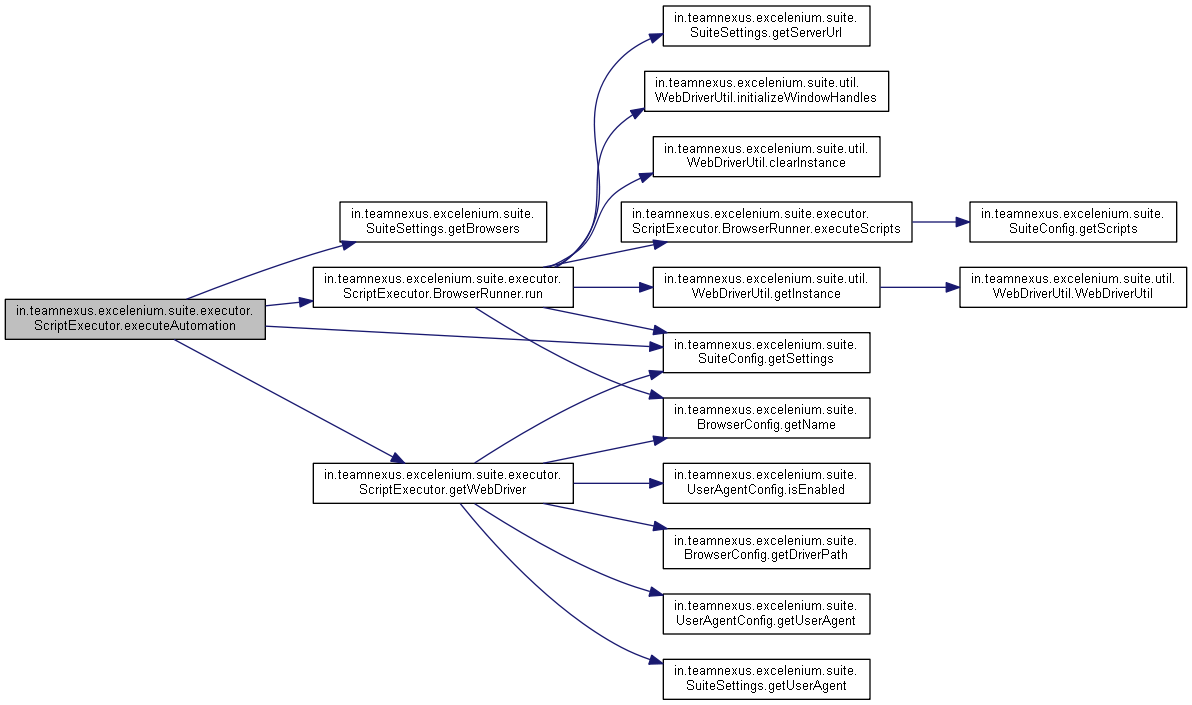
Doxygen has a robust and big set of features that this article's space is too small to contain, so we will look at it from the perspective of understanding code. Doxygen has a great feature of generating something called call-graphs. Call graphs are control flow graphs that show what all functions/methods a particular function/method calls.
An example of a call-graph would be like the diagram below

So to understand the code first, call-graphs are a great way to understand the code flow, even if the code is poorly or even not documented. Doxygen provides both the command-line version and a wizard that guides us through the documentation generation process
We can use either to generate the documentation, however for newbies, the wizard will help to generate the configuration file necessary to generate the documentation To generate the call graphs, Doxygen requires the dot tool to be available in the path. dot tool is a part of the Graphviz package that helps generate the call-graphs.
The Doxygen documentation page has very clear steps on how to use the wizard to generate the documentation. In the Diagrams tab, we will have to select the Call graphs option to generate the call graphs. Of course, it takes a bit of time to generate the call-graphs.
Once the documentation is generated, we can start navigating from whatever is the main class method and click on the call-graph functions to navigate through the entire code. Go ahead try Doxygen and see! In the next part of this article, we'll see about eclox, the eclipse plugin for Doxygen.
Published at DZone with permission of Prabhu Rengaswamy. See the original article here.
Opinions expressed by DZone contributors are their own.

Comments