Understanding the Confusion Matrix
Want to learn more about understanding the confusion matrix? Check out this post to learn more about using the confusion matrix for performance measurement.
Join the DZone community and get the full member experience.
Join For Free
The confusion matrix is one of the most popular and widely used performance measurement techniques for classification models. While it is super easy to understand, its terminology can be a bit confusing.
Therefore, keeping the above premise under consideration, this article aims to clear the "fog" around this amazing model evaluation system.
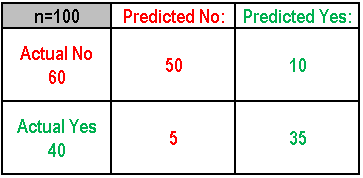
To get things started, I have included a working example of this matrix to make things simple and easy to understand. However, the application of this technique can be used on more than two classes.
What Can We Learn From This Matrix?
- There are two possible classifications: "yes" and "no." If we have to predict the presence of an occurrence, then "yes" would mean that that event has occurred, and "no" would mean the opposite, i.e. it didn't happen.
- The model made a total of 100 predictions about an event
- Out of those 100 results, the model predicted "yes" 45 times and "no" 55 times. Whereas, in reality, 60 times the event in question occurred and 40 times it didn't.
Basic Terms to Keep in Mind
- True Positive (TP): These are the events that were correctly predicted by the model as "occurred = Yes."
- True Negative (TN): These are the events that were correctly predicted by the model as "not occurred = No."
- False Positive (FP): These are the events that were predicted as "occurred = Yes," but in reality, it was "not occurred = No."
- False Negative (FN): This is the opposite of FP, i.e. predicted as "not occurred = No," but in reality, it was "occurred = Yes."
How These Metrics Are Computed for a Binary Classifier
- Accuracy: Overall, how often does the classifier predict right?
(TP+TN)/Total = (35+50)/100 = 85% - Misclassification Rate (aka Error Rate): Overall, how often is it wrong?
(FP+FN)/Total = (5+10)/100 = 15%
This is the equivalent of 1 minus Accuracy. - True Positive Rate: Events that were correctly predicted by the model as "occurred = Yes."
TP/ actual yes = 35/40 = 87% (aka "Recall" or "Sensitivity") - False Positive Rate: Events that were predicted as "occurred = Yes," but in reality, it was "not occurred = No."
FP/actual no = 10/60 = 17% - Specificity: When an event was actually predicated as "no," and it was actually a "no."
TN/actual no = 50/60 83% - Precision: When an event is predicted "yes," how often it is correct?
TP/predicted yes = 35/45 = 77% - Prevalence: How often does the "yes" event occur in the sample?
Actual Yes/Total = 40/100 = 40%
Key Terms Worth Knowing
Positive Predictive Value: This is very similar to precision with a difference of the fact that it takes prevalence into consideration. In the case where the classes are perfectly balanced (prevalence in 50%), the positive predictive value (PPV) is equivalent to precision.
Null Error Rate: This term defines how often your prediction would be wrong if you always predicted the majority class. In the above example, the null error rate would be 60/100 = 60%, because if you always predicted yes, you would on be wrong for the 60 "no" events. This can be considered and used as a baseline metric to compare your classifier against. However, the best classifier for a particular application will sometimes have a higher error rate than the null error rate.
F Score: This is a weighted average of the true positive (recall) and precision.
Roc Curve: This shows the true positive rates (an event) against false positives (a non-event marked as an event) rate at various cut points. A ROC Curve demonstrates a trade-off between sensitivity (recall and specificity or the true negative rate) and an increase in sensitivity, which will introduce a reduction in specificity. The closer the curve follows to the left-hand border and then top border of the ROC plot, the more accurate the test.
Published at DZone with permission of Sunil Kappal. See the original article here.
Opinions expressed by DZone contributors are their own.
Comments