Using Micrometer With Spring Boot 2
In this quick post, we walk you through how to gather the metrics from your Spring Boot 2 application using this monitoring tool.
Join the DZone community and get the full member experience.
Join For FreeThis is a very quick introduction to using the excellent Micrometer library to instrument a Spring Boot 2-based application and recording the metrics in Prometheus.
Introduction
Micrometer provides a Java-based facade over the client libraries that the different monitoring tools provide.
As an example, consider Prometheus. If I were to integrate my Java application with Prometheus, I would have used the client library called Prometheus Client Java and used the data-structures (Counter, Gauge etc.) to collect and provide data to Prometheus. If for any reason the monitoring system is changed, the code will have to be changed for the new system.
Micrometer attempts to alleviate this by providing a common facade that the applications use when writing code. Binding to the monitoring system is purely a runtime concern and so changing the metrics system from Prometheus to, say, Datadog just requires changing a runtime library without needing any code changes.

Instrumenting a Spring Boot 2 Application
Nothing special needs to be done to get Micrometer support for a Spring Boot 2-based app. Adding in the actuator starters pulls in Micrometer as a transitive dependency.
For example, in a Gradle-based project this is sufficient:
dependencies {
    compile('org.springframework.boot:spring-boot-starter-actuator')
    ...
}
Additionally, since the intention is to send the data to Prometheus, a dependency has to be pulled in which provides the necessary Micrometer SPIs.
dependencies {
    ...
    runtime("io.micrometer:micrometer-registry-prometheus")
    ...
}
By default, Micrometer provides a set of intelligent bindings which instrument the Spring-based Web and Webflux endpoints and add in meters to collect the duration, count of calls, etc. Additionally, it also provides bindings to collect JVM metrics - memory usage, thread pool, etc.
An application property needs to be enabled to expose an endpoint which Prometheus will use to scrape the metrics data:
endpoints:
prometheus:
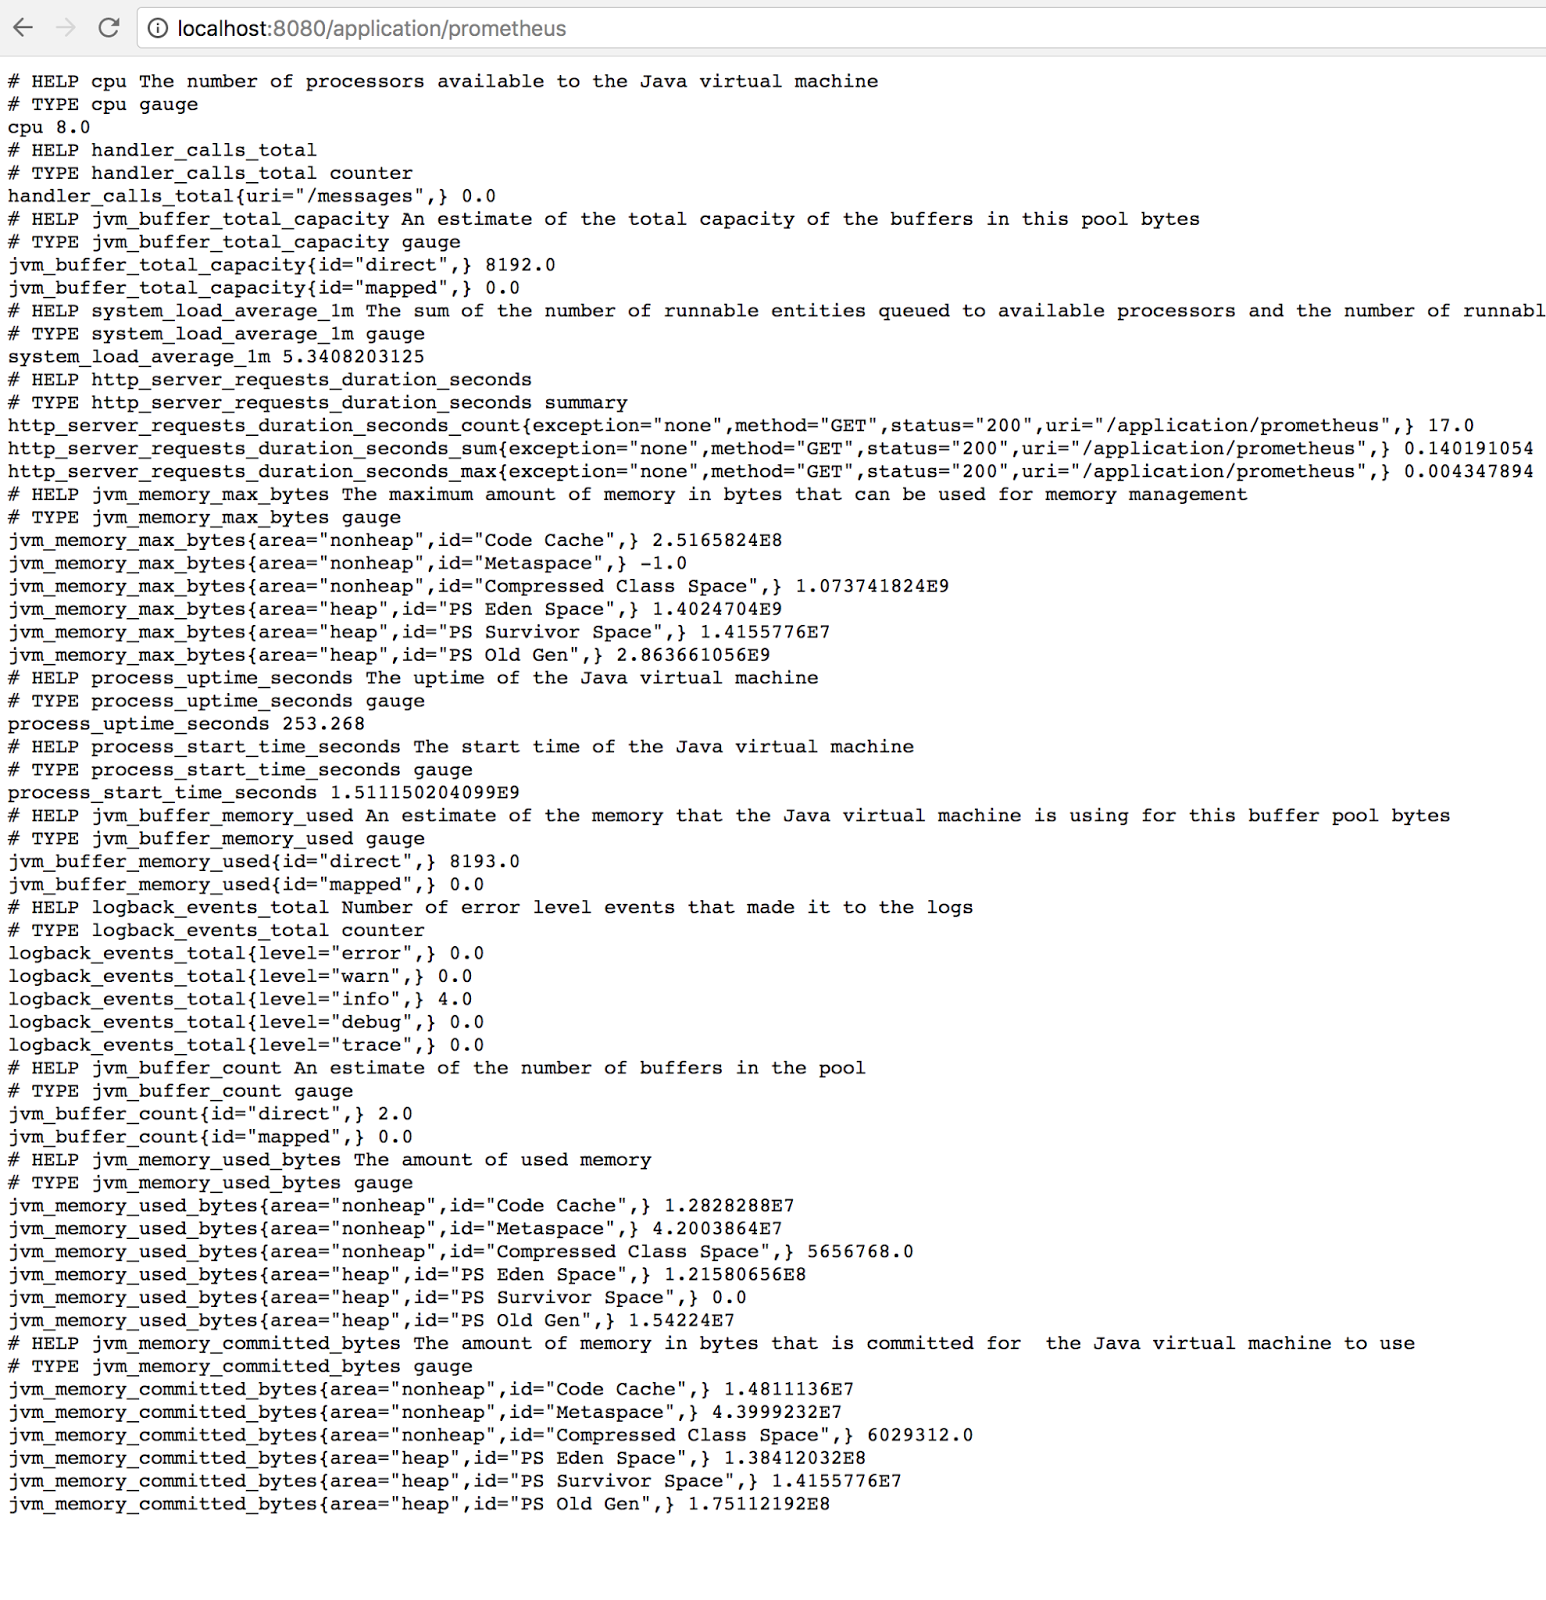
enabled: trueIf the application is brought up at this point, the "/applications/prometheus" endpoint should be available, showing a rich set of metrics. The following is a sample on my machine:
The default metrics are very rich and should cover most of the common set of metrics requirements of an application. If additional metrics are required, they can easily be added in as shown in the following code snippet:
class MessageHandler {

    private val counter = Metrics.counter("handler.calls", "uri", "/messages")

    fun handleMessage(req: ServerRequest): Mono<ServerResponse> {
        return req.bodyToMono<Message>().flatMap { m ->
            counter.increment()
            ...
...
}
Integrating With Prometheus
Prometheus can be configured to scrape data from the endpoint exposed by the Spring Boot 2 app. A snippet of Prometheus configuration looks like this:
scrape_configs:
  - job_name: 'myapp'
    metrics_path: /application/prometheus
    static_configs:
      - targets: ['localhost:8080']
This is not really a production configuration. In a production setting, it may better to use a Prometheus Push Gateway to broker the collection of metrics.
Prometheus provides a basic UI to preview the information that it scrapes, and it can be accessed by default at port 9090. Here is a sample graph with the data produced during a load test:

Conclusion
Micrometer makes it very easy to instrument an application and collect a good set of basic metrics which can be stored and visualized in Prometheus. If you are interested in following this further, I have a sample application using Micrometer available here.
Published at DZone with permission of Biju Kunjummen. See the original article here.
Opinions expressed by DZone contributors are their own.
Comments