

What Is Variable Importance and How Is It Calculated?
Variable Importance (VI) helps data scientists weed out certain predictors that are contributing to nothing and that instead add time to processing.
Join the DZone community and get the full member experience.
Join For FreeVI represents the statistical significance of each variable in the data with respect to its effect on the generated model. VI is actually each predictor ranking based on the contribution predictors make to the model. This technique helps data scientists weed out certain predictors that are contributing to nothing and that instead add time to processing. Sometimes, the user thinks a variable must contribute to the model, and its VI results are very poor. Feature engineering can be done to improve predictor existence.
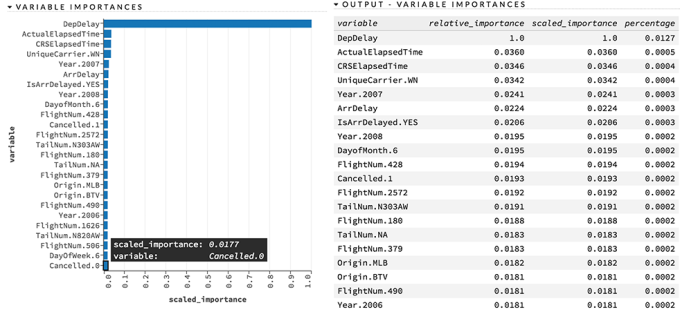
Here is an example of Variable Importance chart and table from H2O Machine Learning platform:
How Is Variable Importance Calculated?
Variable importance is calculated by the sum of the decrease in error when split by a variable. Then, the relative importance is the variable importance divided by the highest variable importance value so that values are bounded between 0 and 1.
Does Zero Relative Importance Mean Zero Contribution to the Model?
With variable importance, if a certain variable or a group of variables importance is shown as 0.0000, they’ve never split by the column. That's why their relative importance is 0.00000 and their contribution to the model will be considered zero.
Is Removing Zero Relative Importance Variables From the Predictor Set When Building the Model Safe?
Yes, it is safe to remove variables with zero importance, as they are contributing zero to the model and taking lots of time to process the data. Also, removing these zero relative importance predictors shouldn’t deteriorate model performance.
What If the Partial Dependency Plot (PDP) Char Is Flat?
In the PDP chart, when changing the values of the variable, if it doesn’t affect the probability coming out of the model and remains flat, it is safe to assume that this particular variable doesn’t contribute to the model. Note that sometimes there is a very small difference in variables, i.e. 0.210000 and 0.210006, which is hard to find unless you scan all predictors and plot another chart by removing all top important variables to highlight very small changes. Overall, you can experiment the tail predictors' importance by keeping in and out of your model building step to see how it changes and if that is of any significant.
Published at DZone with permission of Avkash Chauhan. See the original article here.
Opinions expressed by DZone contributors are their own.
Comments