View Test Results in Grafana - Part 2
In this article, see how to upload test results to Influx DB using TestNG Listeners and configure Grafana to view the data
Join the DZone community and get the full member experience.
Join For FreeIn the 1st part of this series, we set up Grafana and InfluxDB for our test reports. Now, as a follow up to that, we are going to see how to store test results in database and how to view the results in Grafana.
I am going to use Scala with TestNG framework in this demo. For those who are working in Java, it is mostly the same as Scala.
InfluxDB Dependency
As the 1st step, add InfluxDB dependency to the project. Add the below line to your build.sbt file.
xxxxxxxxxx
libraryDependencies += "org.influxdb" % "influxdb-java" % "2.18"
Add the below plugin to the plugins.sbt:
xxxxxxxxxx
addSbtPlugin("de.johoop" % "sbt-testng-plugin" % "3.1.1")
Add Listeners
In the test project, now we are going to add TestNG Listeners to store data in InfluxDB. In the below code, I had
- implemented all methods of an interface "ITestListener"
In the postTestMethodStatus and postTestRunStatus methods, I am creating 2 measurements (tables) testmethod and testrun. 1st one is to store the tests and 2nd one is to store the runs.
The listeners will be called for events like on test passed, on test failed, on test skipped and at the end of test run etc.
I am updating "testmethod" table after every passed/ failed/ skipped test case and am updating the "testrun" table after every test run.
xxxxxxxxxx
import org.testng.ITestListener
import org.influxdb.dto.Point
import org.testng.ITestContext
import org.testng.ITestResult
import java.util.concurrent.TimeUnit
class InfluxDBListener extends ITestListener {
final val startTime = 1000
var failedMethods: Int = 0
def onTestStart(iTestResult: ITestResult): Unit = {
}
def onTestSuccess(iTestResult: ITestResult): Unit = {
this.postTestMethodStatus(iTestResult, "PASS")
}
def onTestFailure(iTestResult: ITestResult): Unit = {
this.postTestMethodStatus(iTestResult, "FAIL")
this.failedMethods+=1
}
def onTestSkipped(iTestResult: ITestResult): Unit = {
this.postTestMethodStatus(iTestResult, "SKIPPED")
}
def onTestFailedButWithinSuccessPercentage(iTestResult: ITestResult): Unit = {
}
def onStart(iTestContext: ITestContext): Unit = {
}
def onFinish(iTestContext: ITestContext): Unit = {
this.postTestClassStatus(iTestContext)
this.postTestRunStatus
}
private def postTestMethodStatus(iTestResult: ITestResult, status: String): Unit = {
val point = Point.measurement("testmethod")
.time(System.currentTimeMillis, TimeUnit.MILLISECONDS)
.tag("testRun",startTime)
.tag("testclass", iTestResult.getTestClass.getName)
.tag("name", iTestResult.getName)
.tag("description", iTestResult.getMethod.getDescription)
.tag("result", status)
.addField("duration", iTestResult.getEndMillis - iTestResult.getStartMillis)
.build
UpdateResults.post(point)
}
private def postTestRunStatus : Unit = {
var testRunStatus = "Pass"
if (this.failedMethods>0)
testRunStatus = "Fail"
val point = Point.measurement("testrun")
.time(System.currentTimeMillis, TimeUnit.MILLISECONDS)
.addField("name",startTime)
.tag("status", testRunStatus)
.build
UpdateResults.post(point)
}
}
Create connection to DB and update the database using the below code.
xxxxxxxxxx
package utils
import org.influxdb.InfluxDBFactory
import org.influxdb.dto.Point
object UpdateResults {
val INFLXUDB = InfluxDBFactory.connect("http://localhost:8086", "root", "root")
val DB_NAME = "test_results"
INFLXUDB.setDatabase(DB_NAME)
def post(point: Point): Unit = {
INFLXUDB.write(point)
}
}
Include listeners to your testng.xml file.
xxxxxxxxxx
<suite name="My suite">
<listeners>
<listener class-name="utils.InfluxDBListener" />
</listeners>
<test name="Test">
<classes>
<class name="tests.CreateGoogleAccount"/>
</classes>
</test>
</suite>
Now run your tests.
xxxxxxxxxx
sbt test
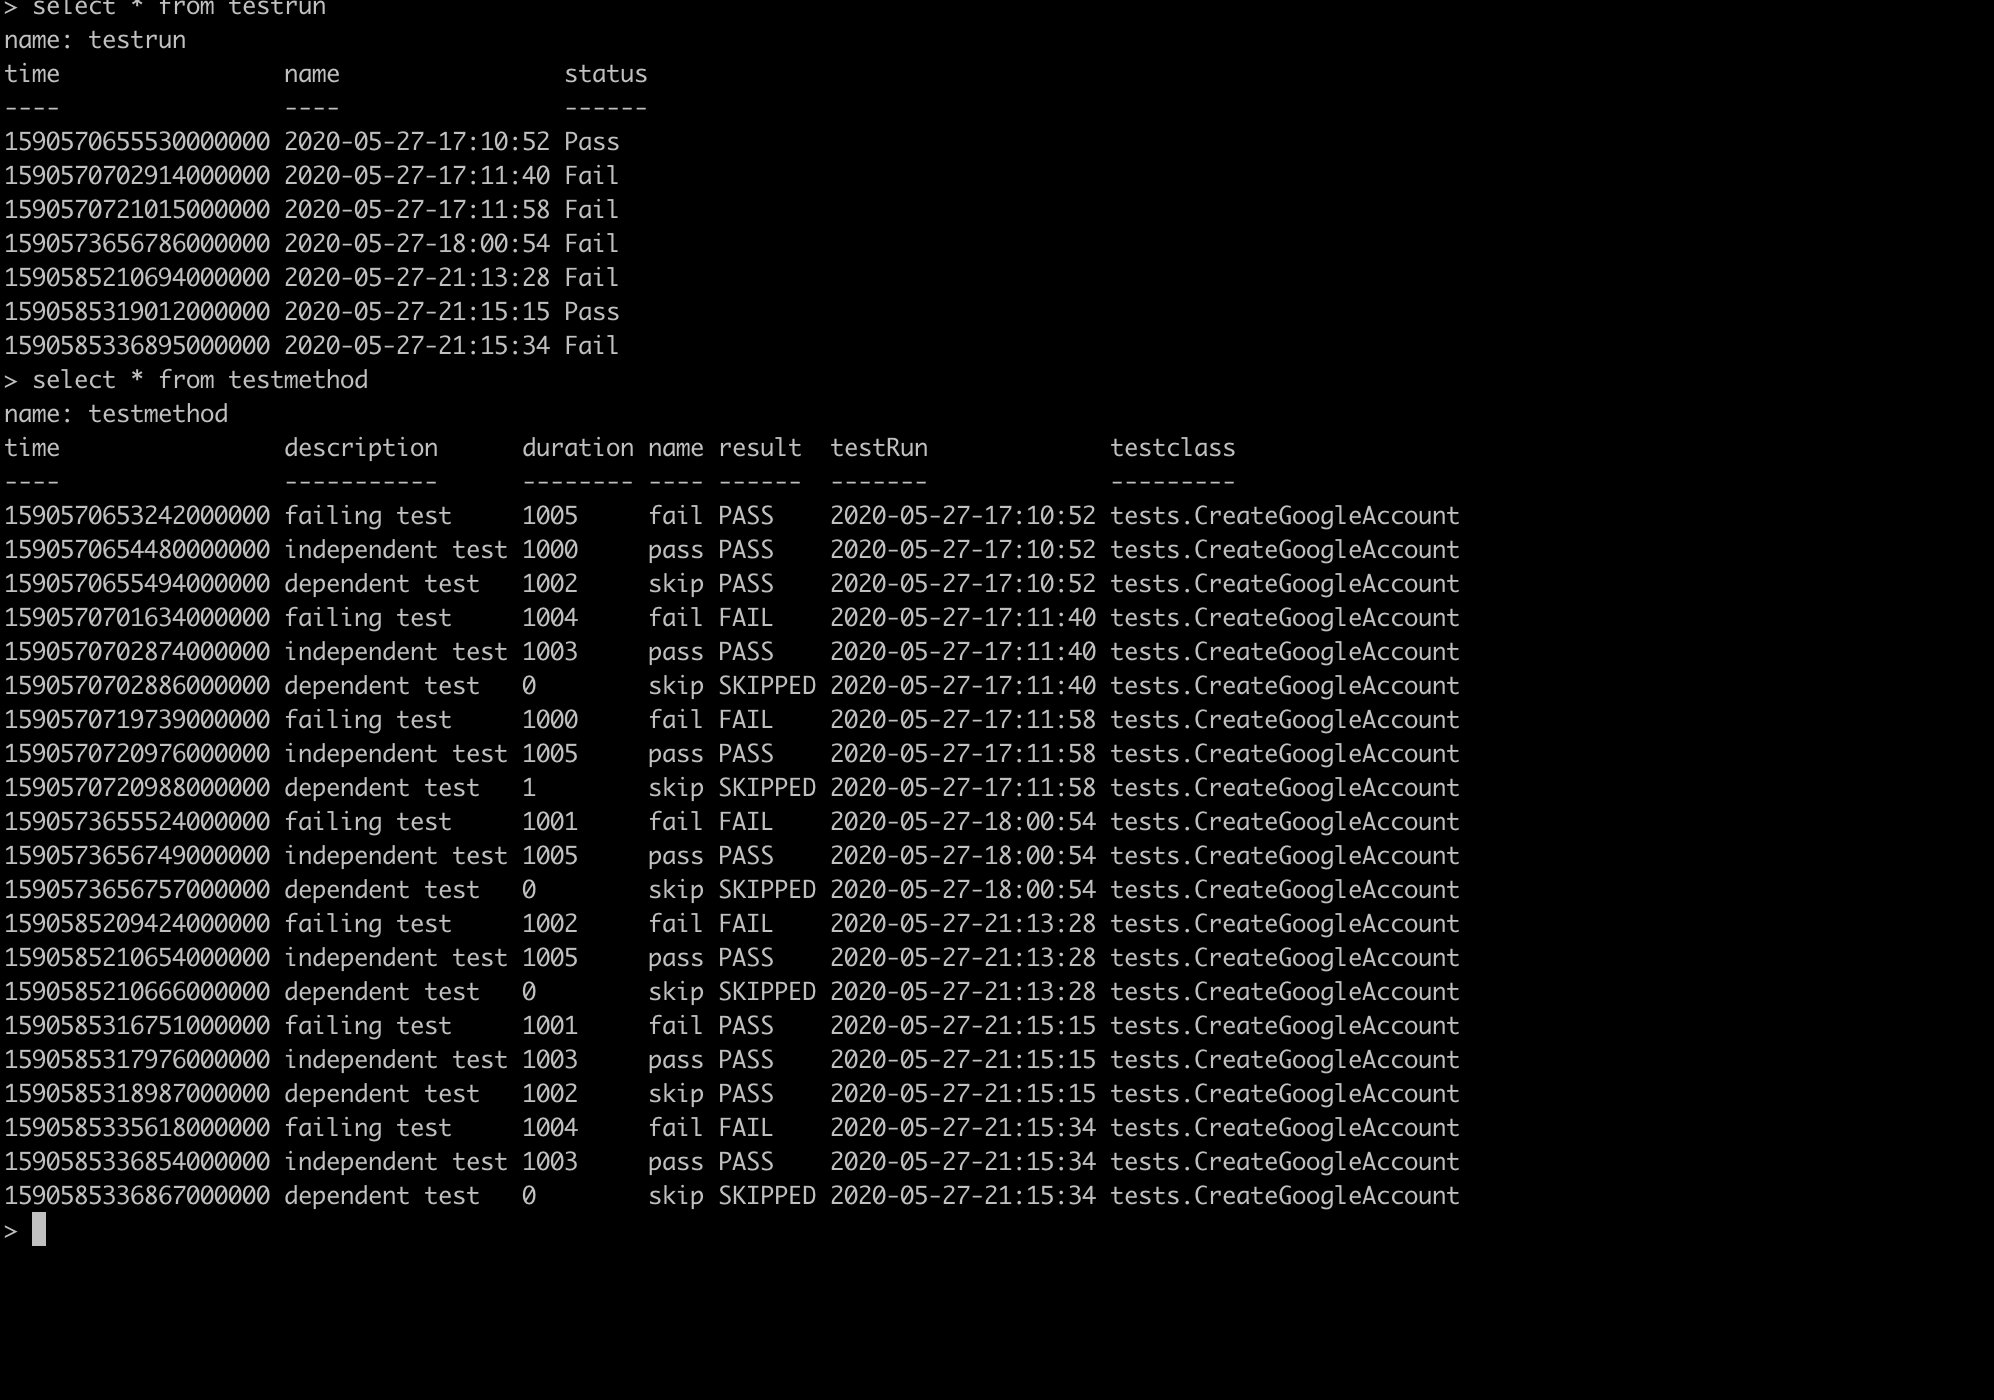
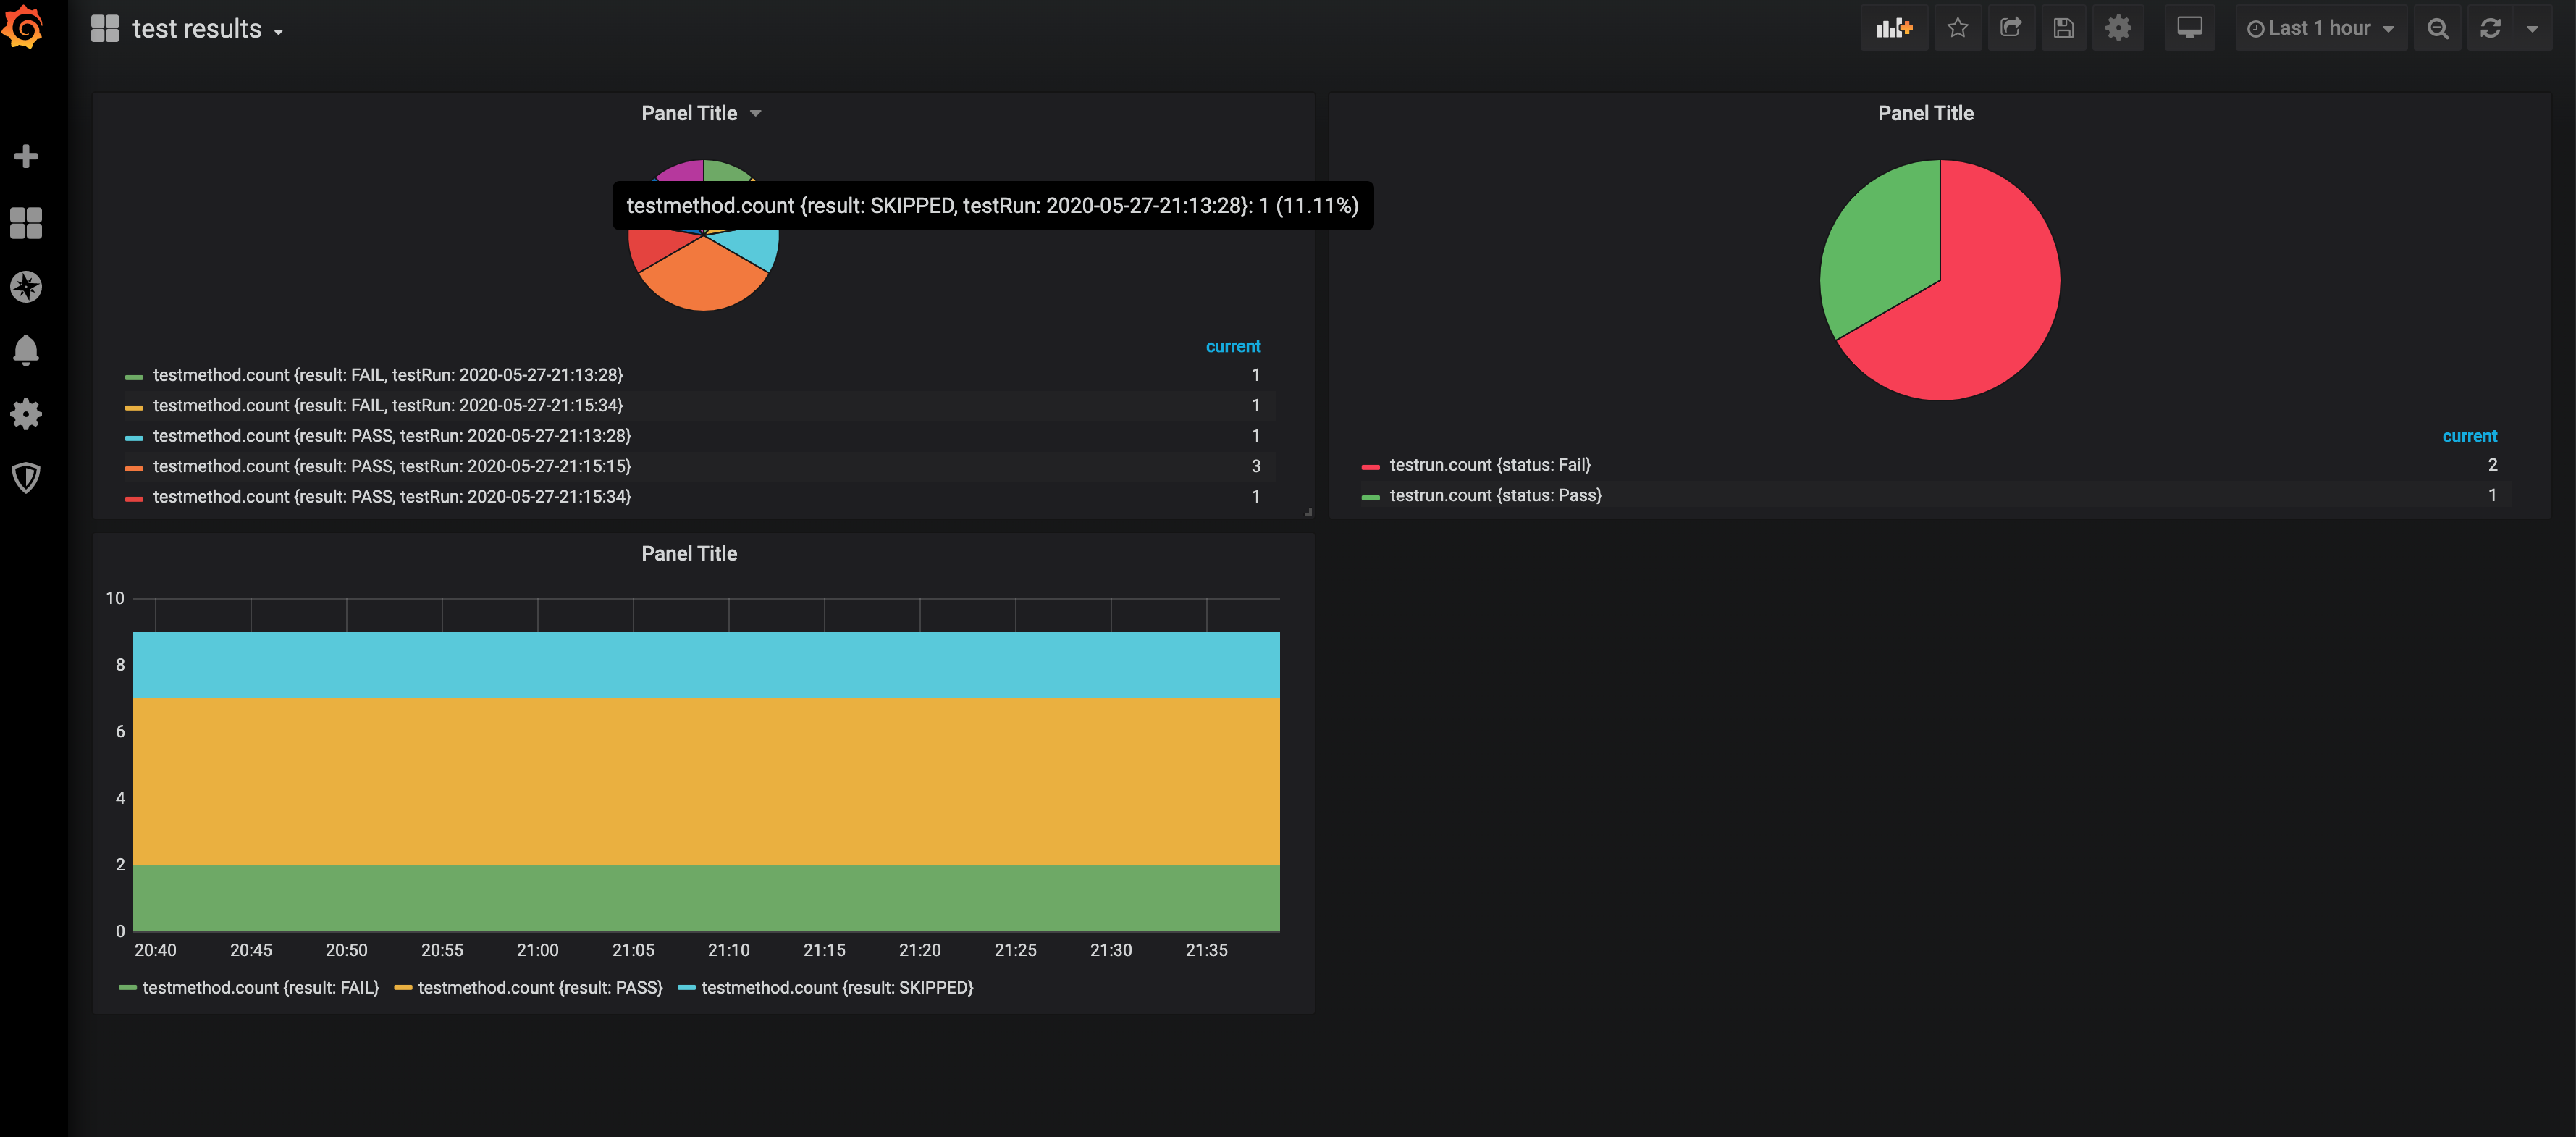
After the test execution, you can see the data of your tests populated in testrun and testmethod tables as below.
Our data is ready.
Configure Grafana
Now let's take a case I need a graph that should show the number of runs that are passed and failed. To draw a chart, for me, data from "testrun" table is enough.
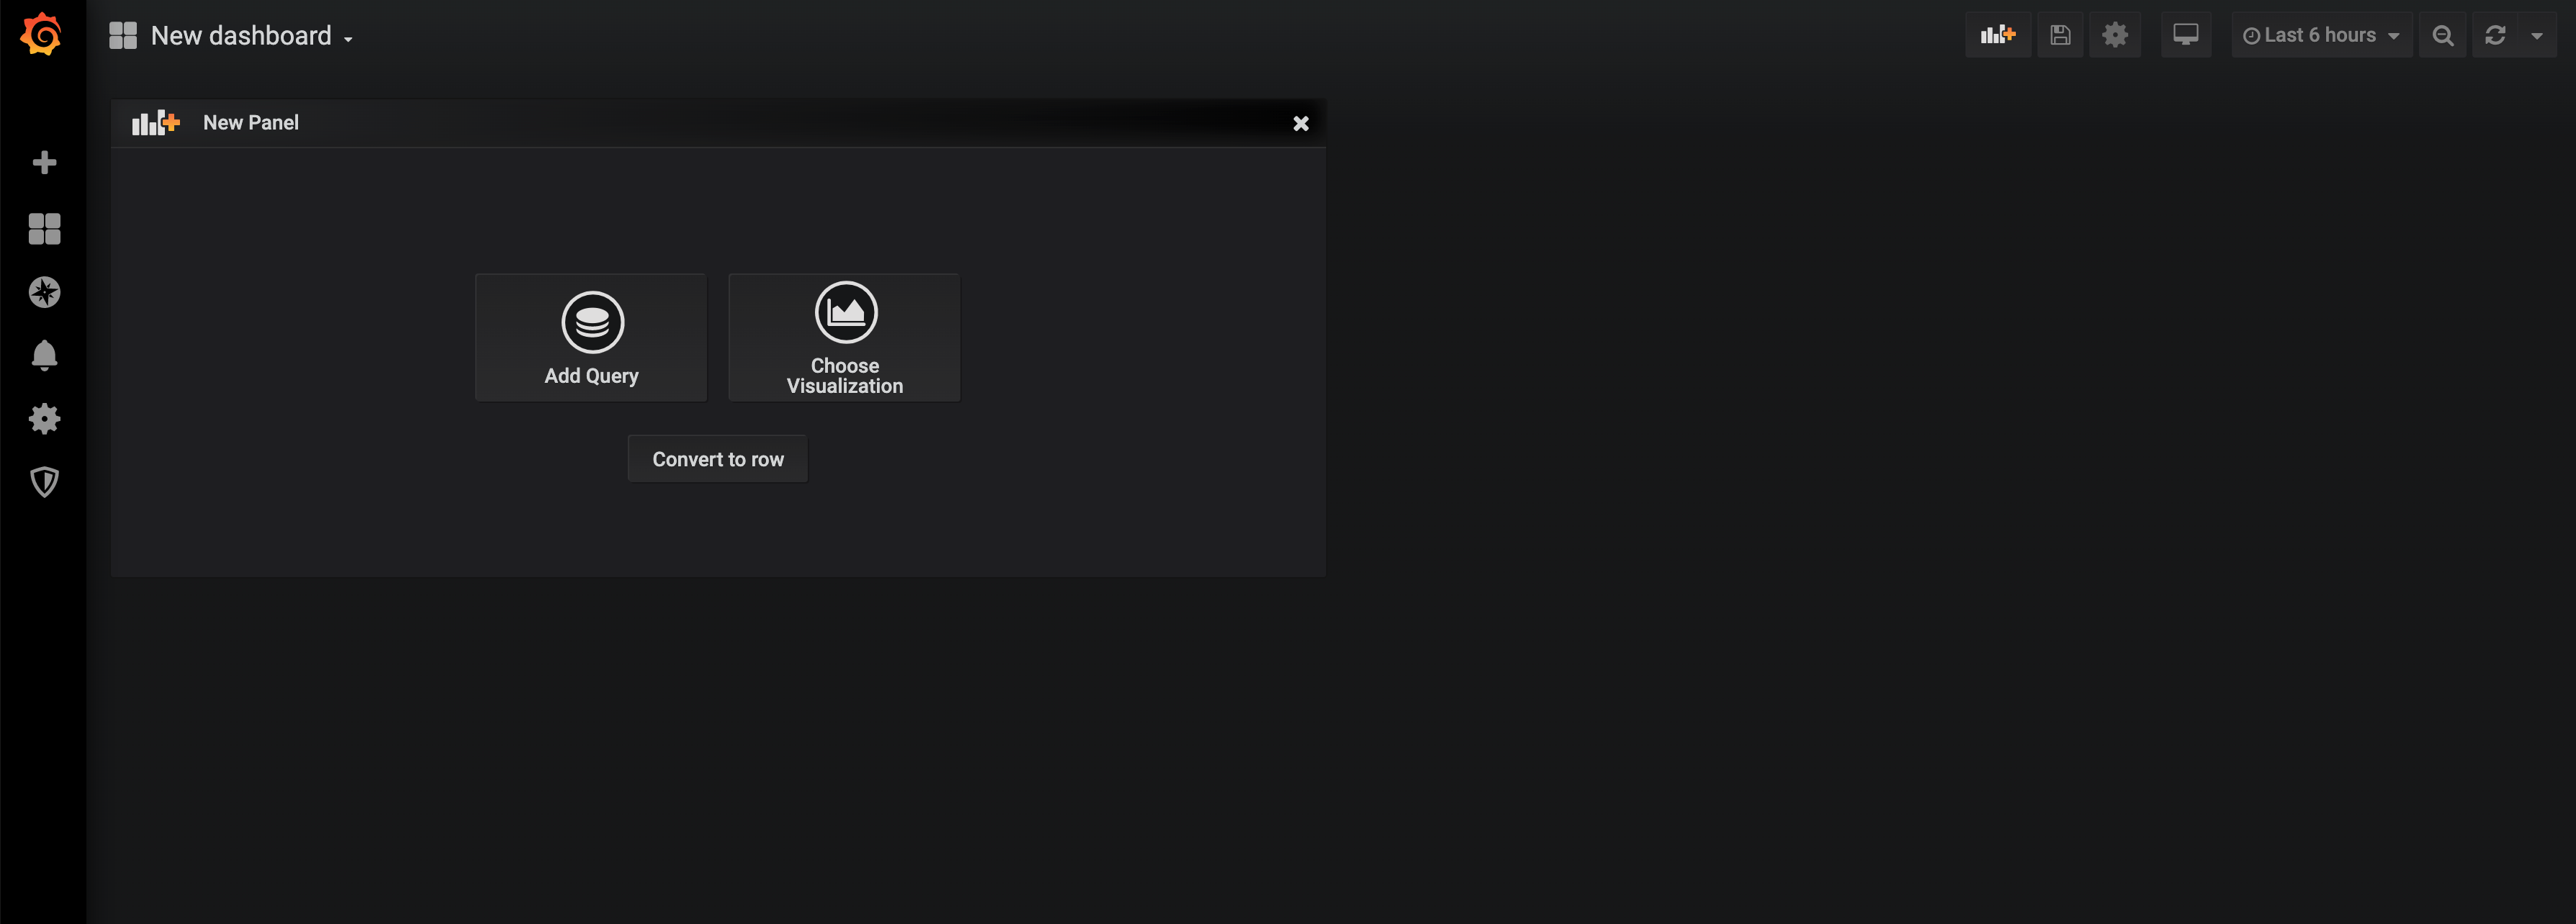
In your Grafana home page, click on "Build a dashboard" or "Create" icon from left pane. This will create an empty dashboard for you. Now, click on "add panel" icon at the header. We will be adding visual representations in the panels.
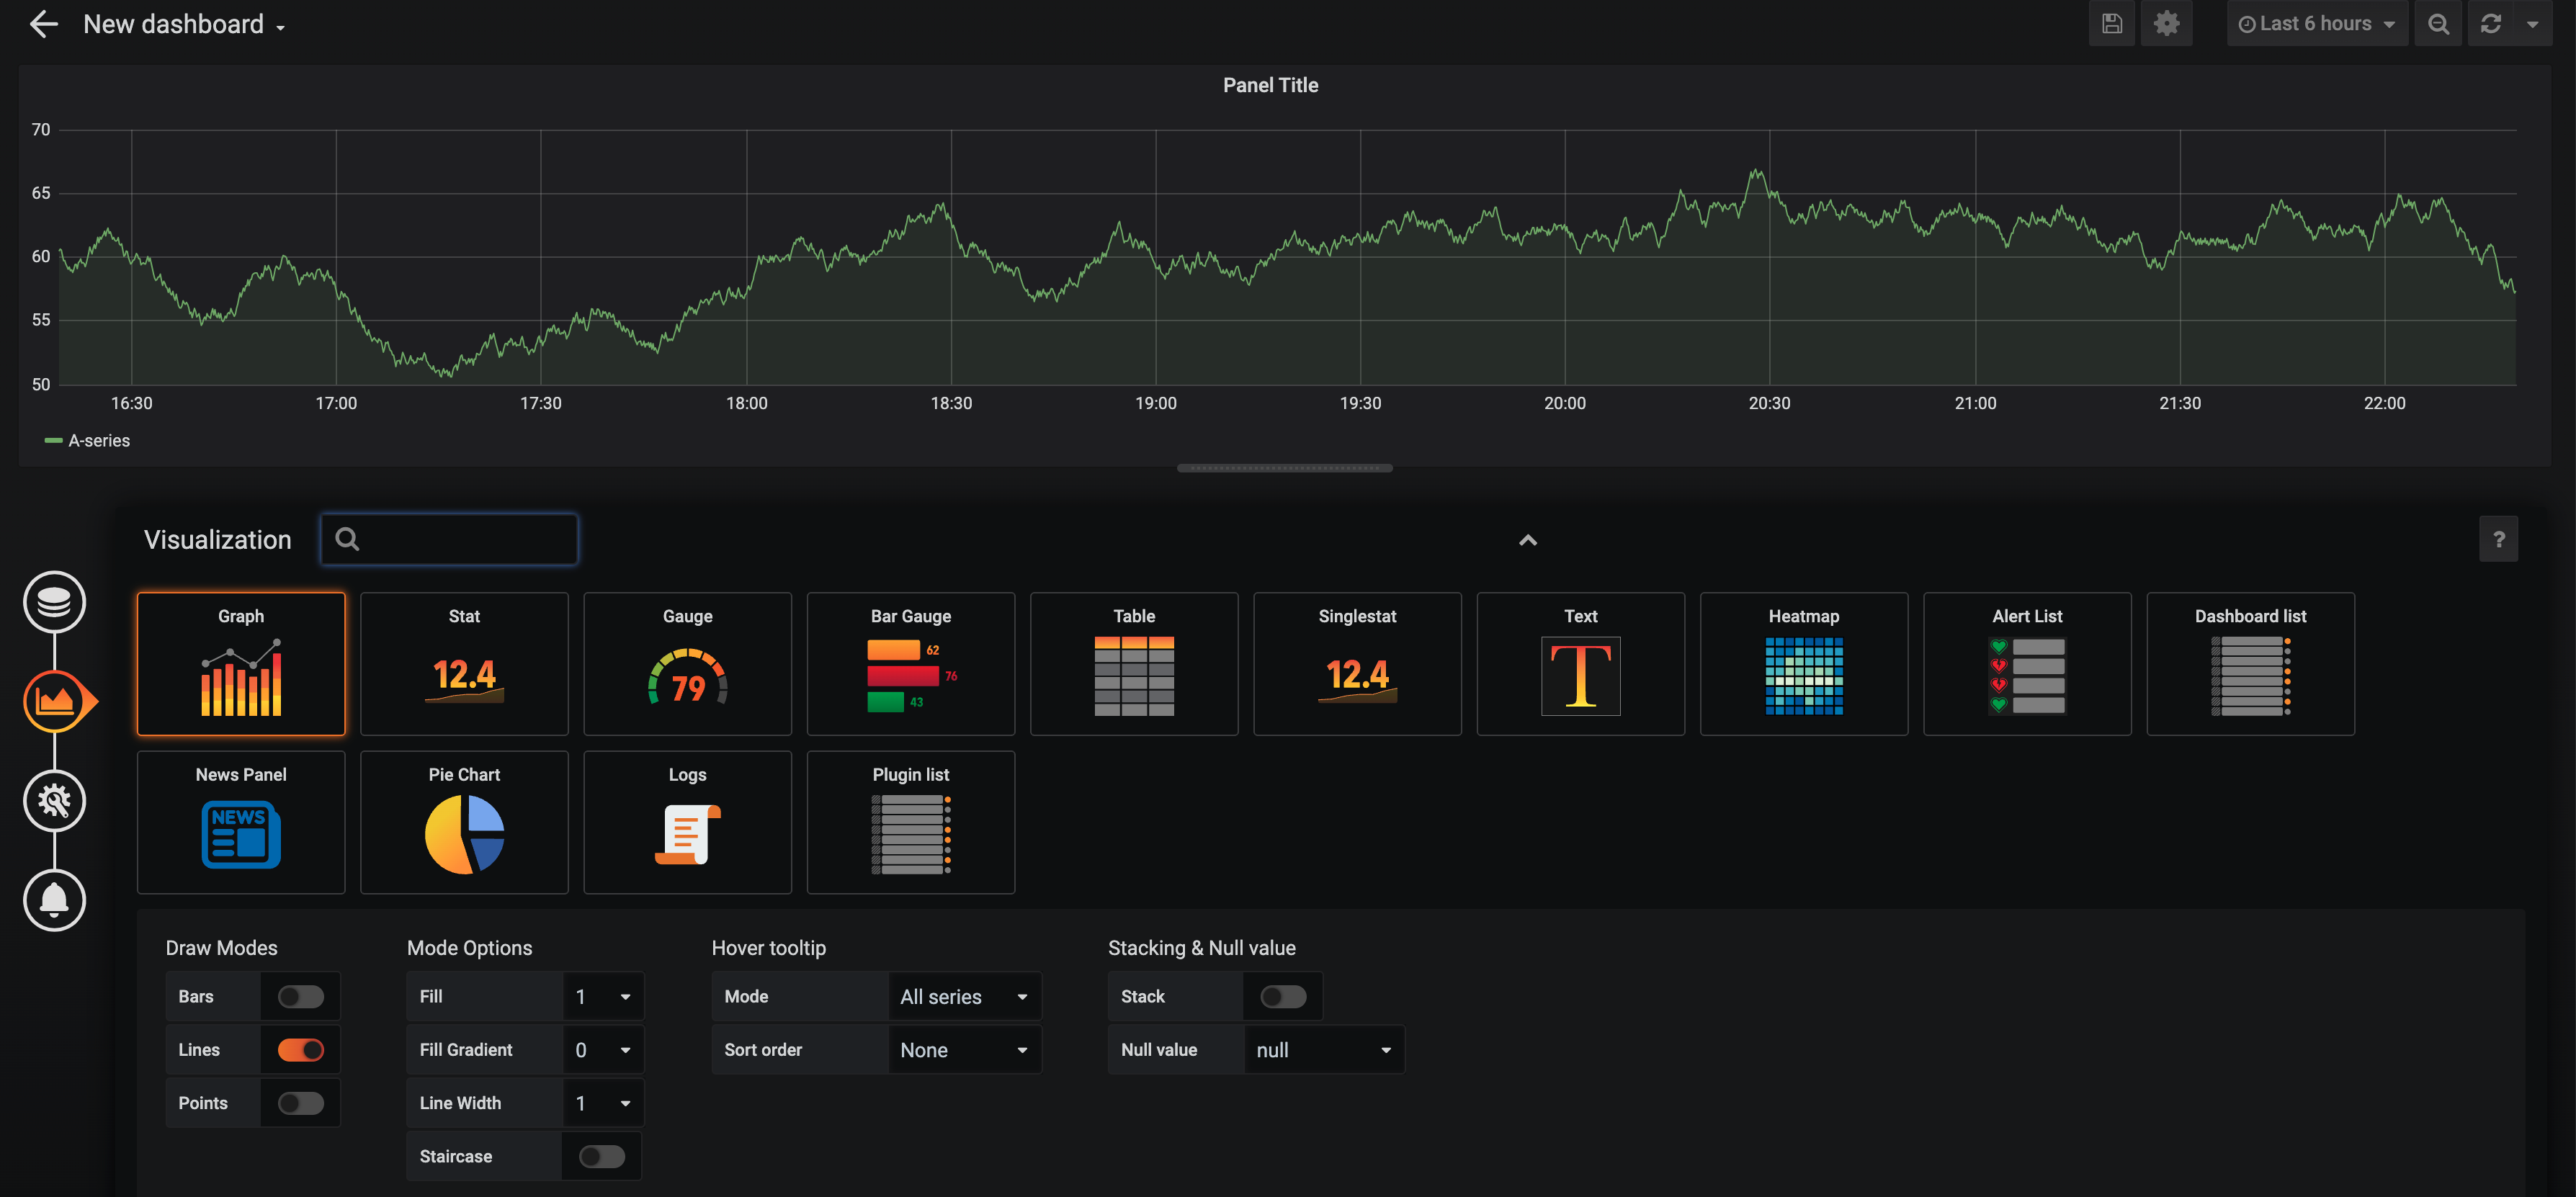
Click on choose vizualisation and choose Pie-Chart. If you don't find the plugin, follow this to install.
Set up the query like below, as per your requirement.
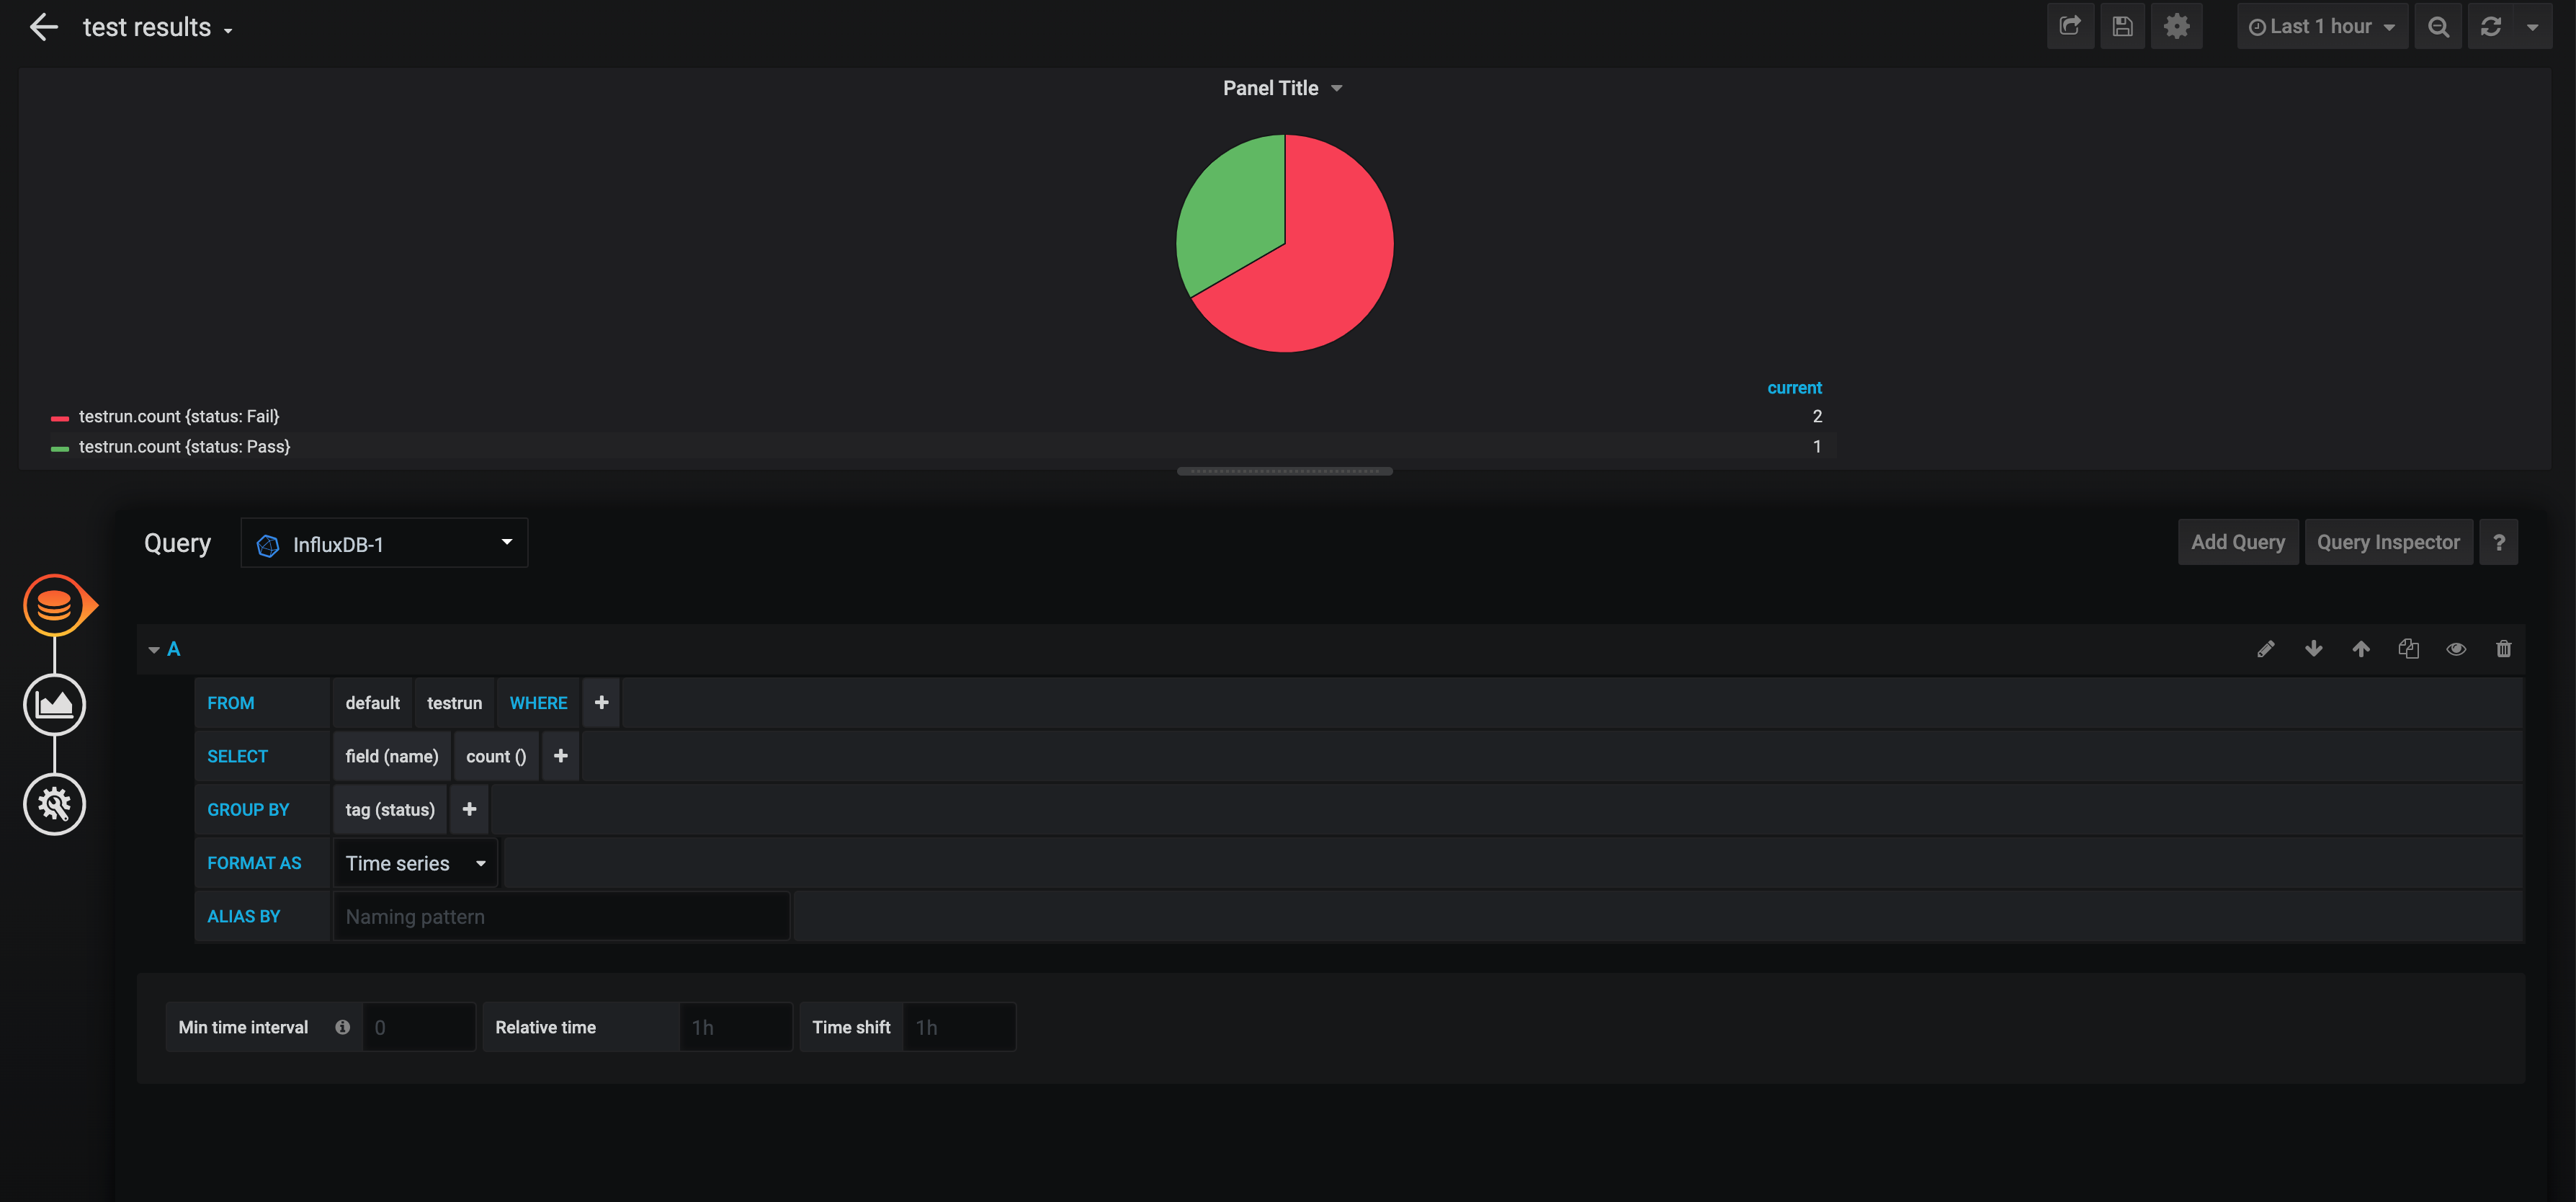
The graphs are real-time and will be updated as soon as there is data-change.
Dashboard with some other graphs
That's it, now you don't need to share test-results with your clients or to your team through an email or in a shared folder. Results will be updated here after every test-run.
You can find sample project here.
Happy Reading!!
Opinions expressed by DZone contributors are their own.
Comments