View Test Results in Grafana - Part 1
In this article, see how to setup Grafana and InfluxDB to store and view test reports
Join the DZone community and get the full member experience.
Join For FreeA good test framework should have a proper reporting mechanism to view and analyze test results. The results should also be sharable. There are many ways to achieve them like test-reports, test execution logs, external plugins. In this article and the next article, we are going to see about a different approach in test reporting. Ever thought of uploading the results into database and view them in a graphical manner in Grafana? Let's see how to achieve this in this series.
Grafana
Grafana is an open-source tool for data-analytics, view data-metrics, and monitoring apps. Data sources for Grafana can be variety of DataBases like MySQL, Postgres, InfluxDB, Graphite, etc. We are going to use InfluxDB as a data source for our application.
Influx DB Setup (Mac)
Let's see how to setup the DB in a mac machine. For setup in other OS, check here. Bring the influxDB running by running below set of commands
xxxxxxxxxx
brew install influxdb
brew services start influxdb
influxd
If you face any issues, while running any of the commands, check influxdb.conf and change the port settings and run like below.
xxxxxxxxxx
influxd -config "path to influxdb.conf"
ex.
influxd -config /usr/local/etc/influxdb.conf
Make sure InfluxDB is started and is displaying logs.

Create Database
Once the db is running, next we need to create a database to store our results. Create it using the below "create" command.
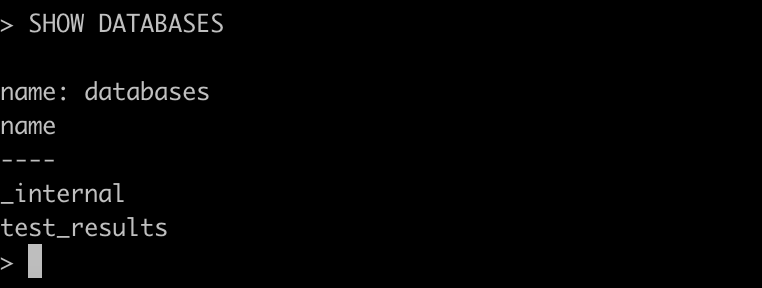
"Show Databases" command will list the databases. Verify the db that you created is listed.
More about InfluxDB here.
xxxxxxxxxx
create database <db_name>;
SHOW DATABASES
Install Grafana (Mac)
After your db is ready, the next step is to install Grafana and setup the datasource. Install Grafana using the below commands.
xxxxxxxxxx
brew install grafana
brew services start grafana
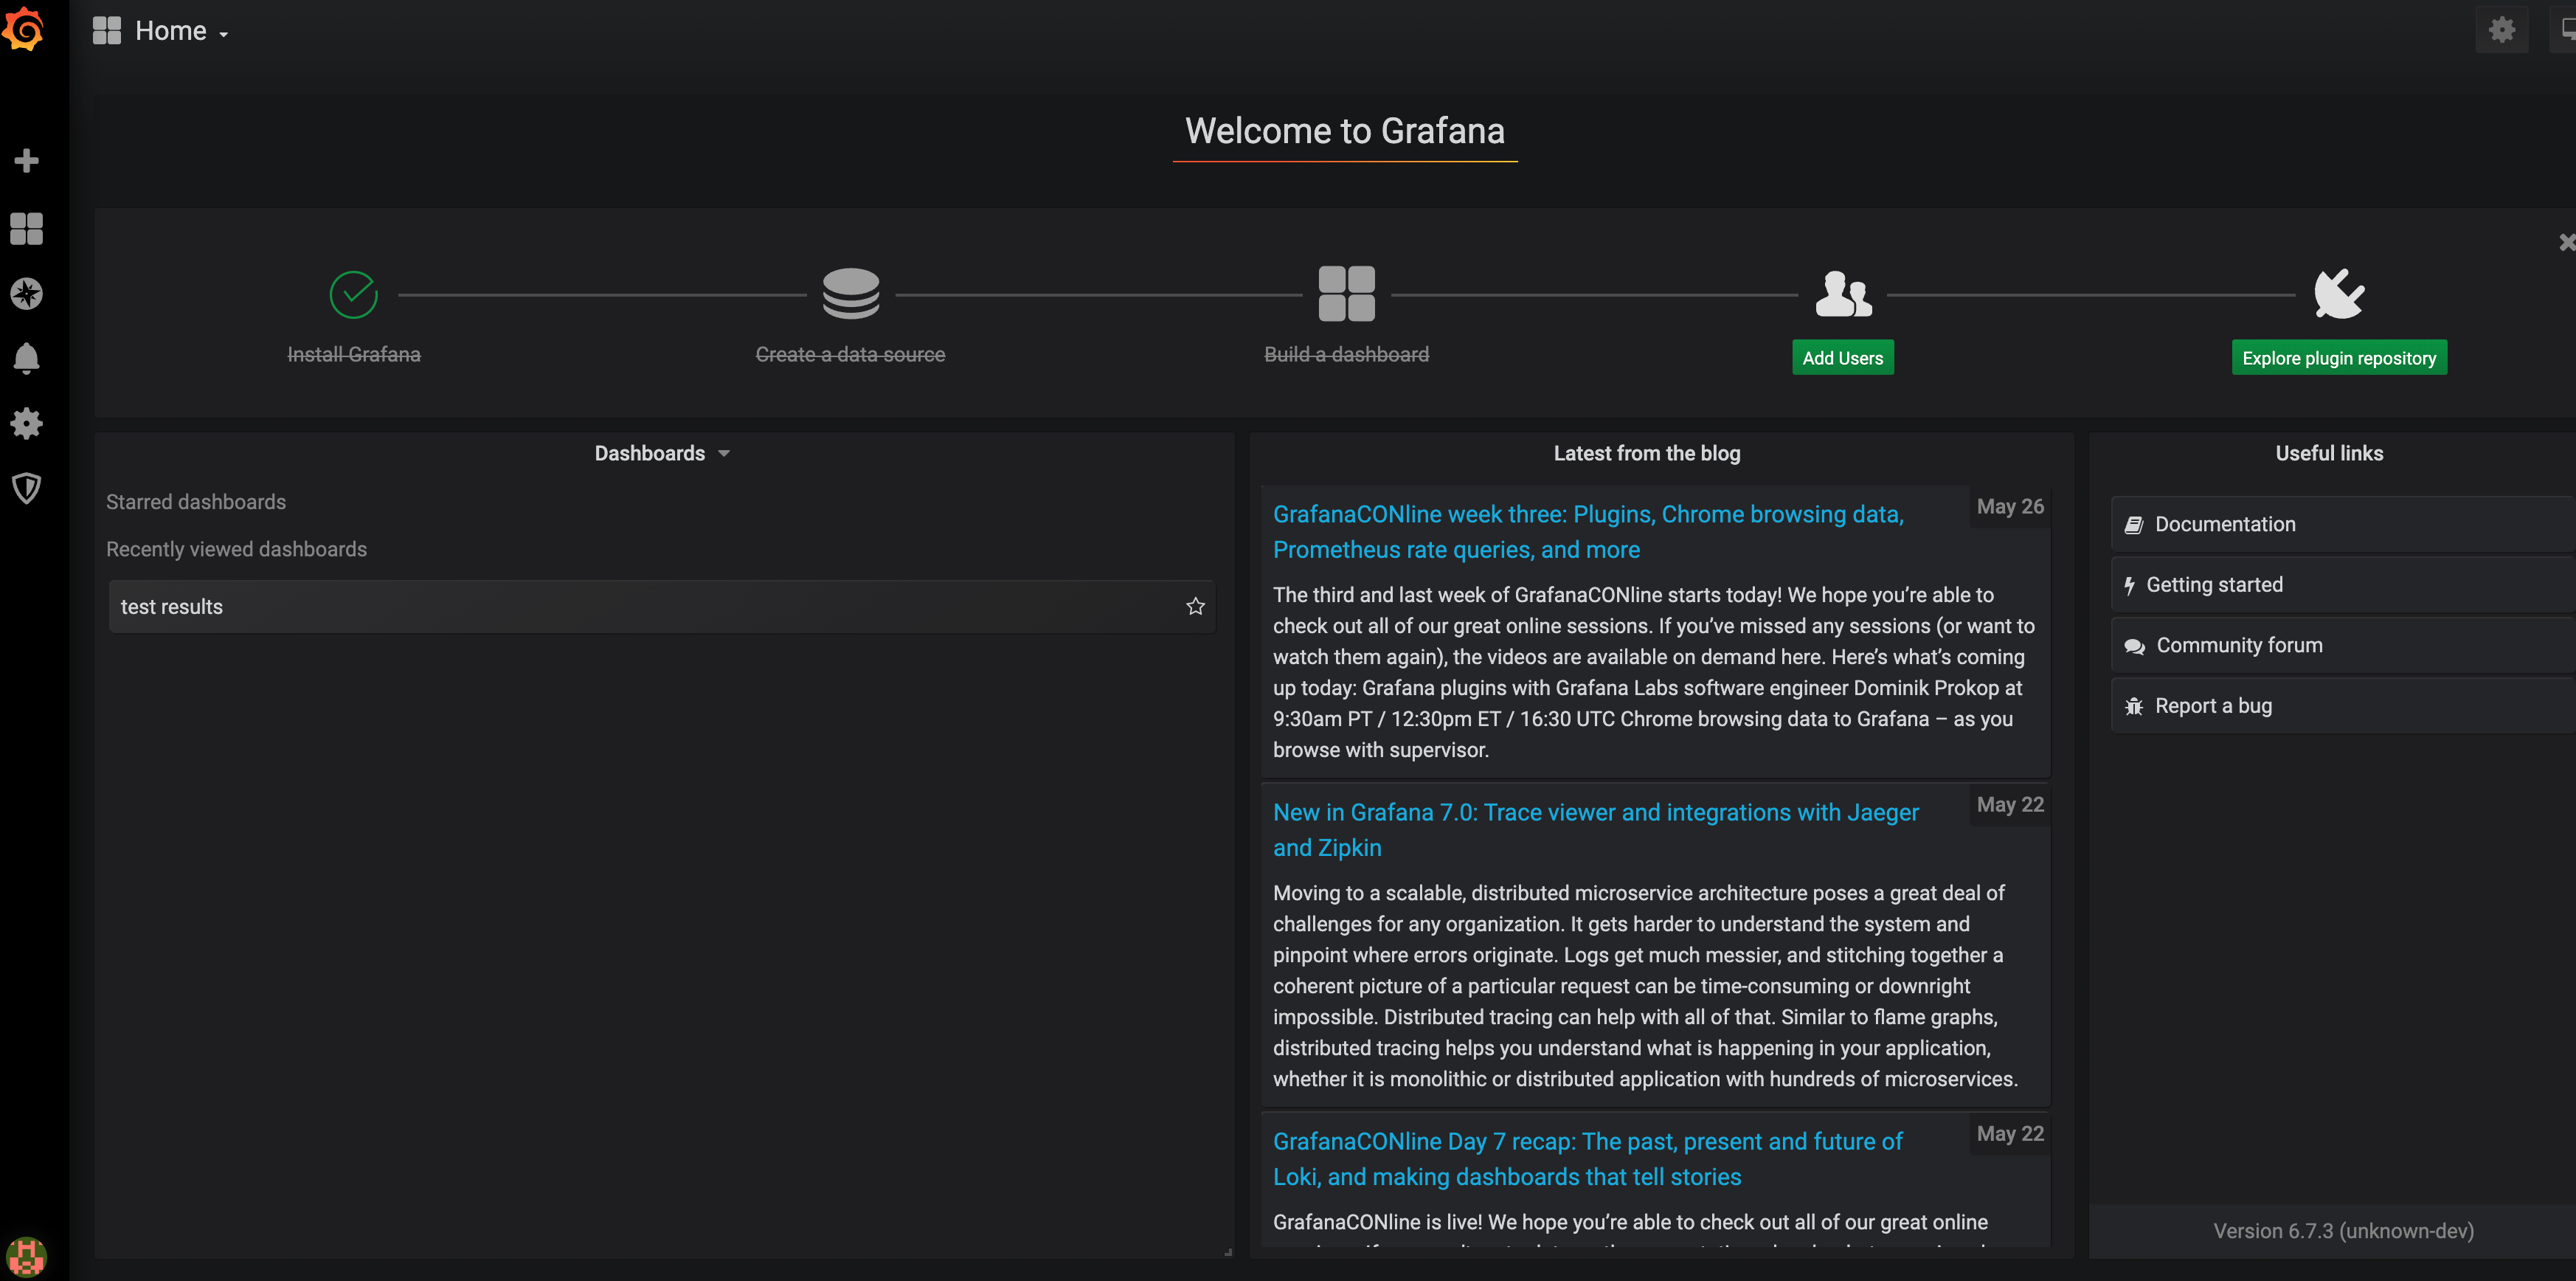
Once it is successfully started, launch Grafana using http://localhost:3000/.
Add Data-Source
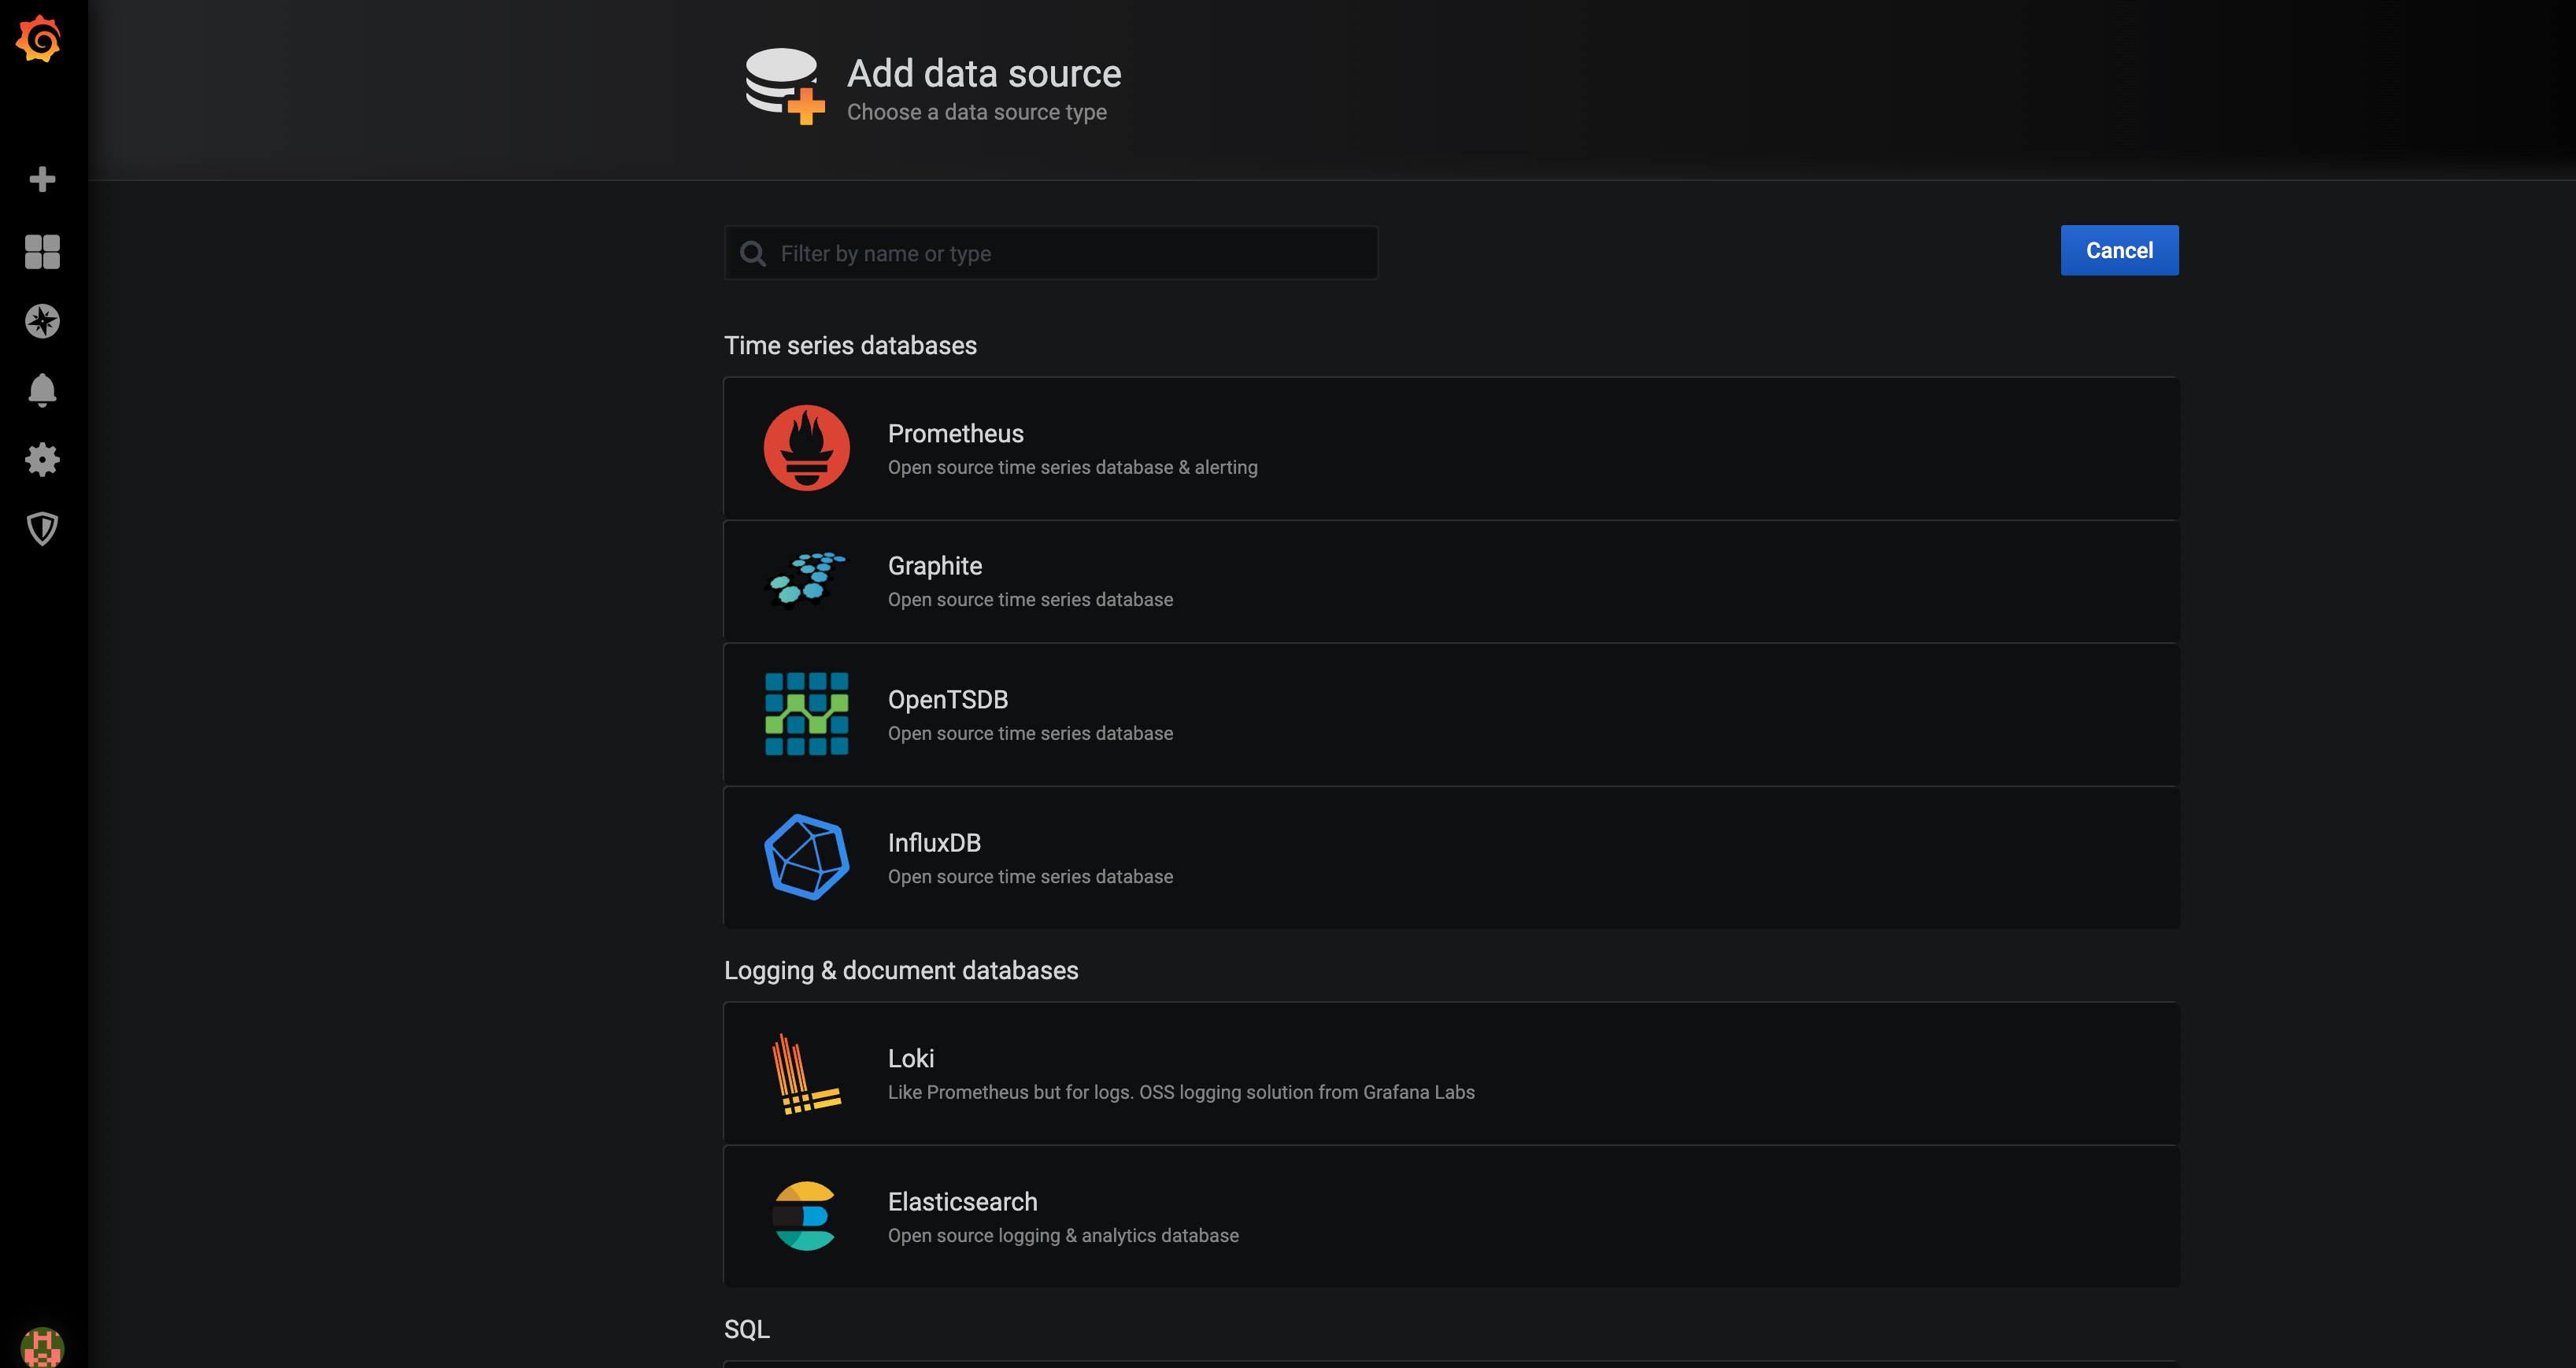
After you can see the welcome screen of Grafana, click on create a data-source or click on configuration menu from the left pane. Now choose "InfluxDB" from the option.
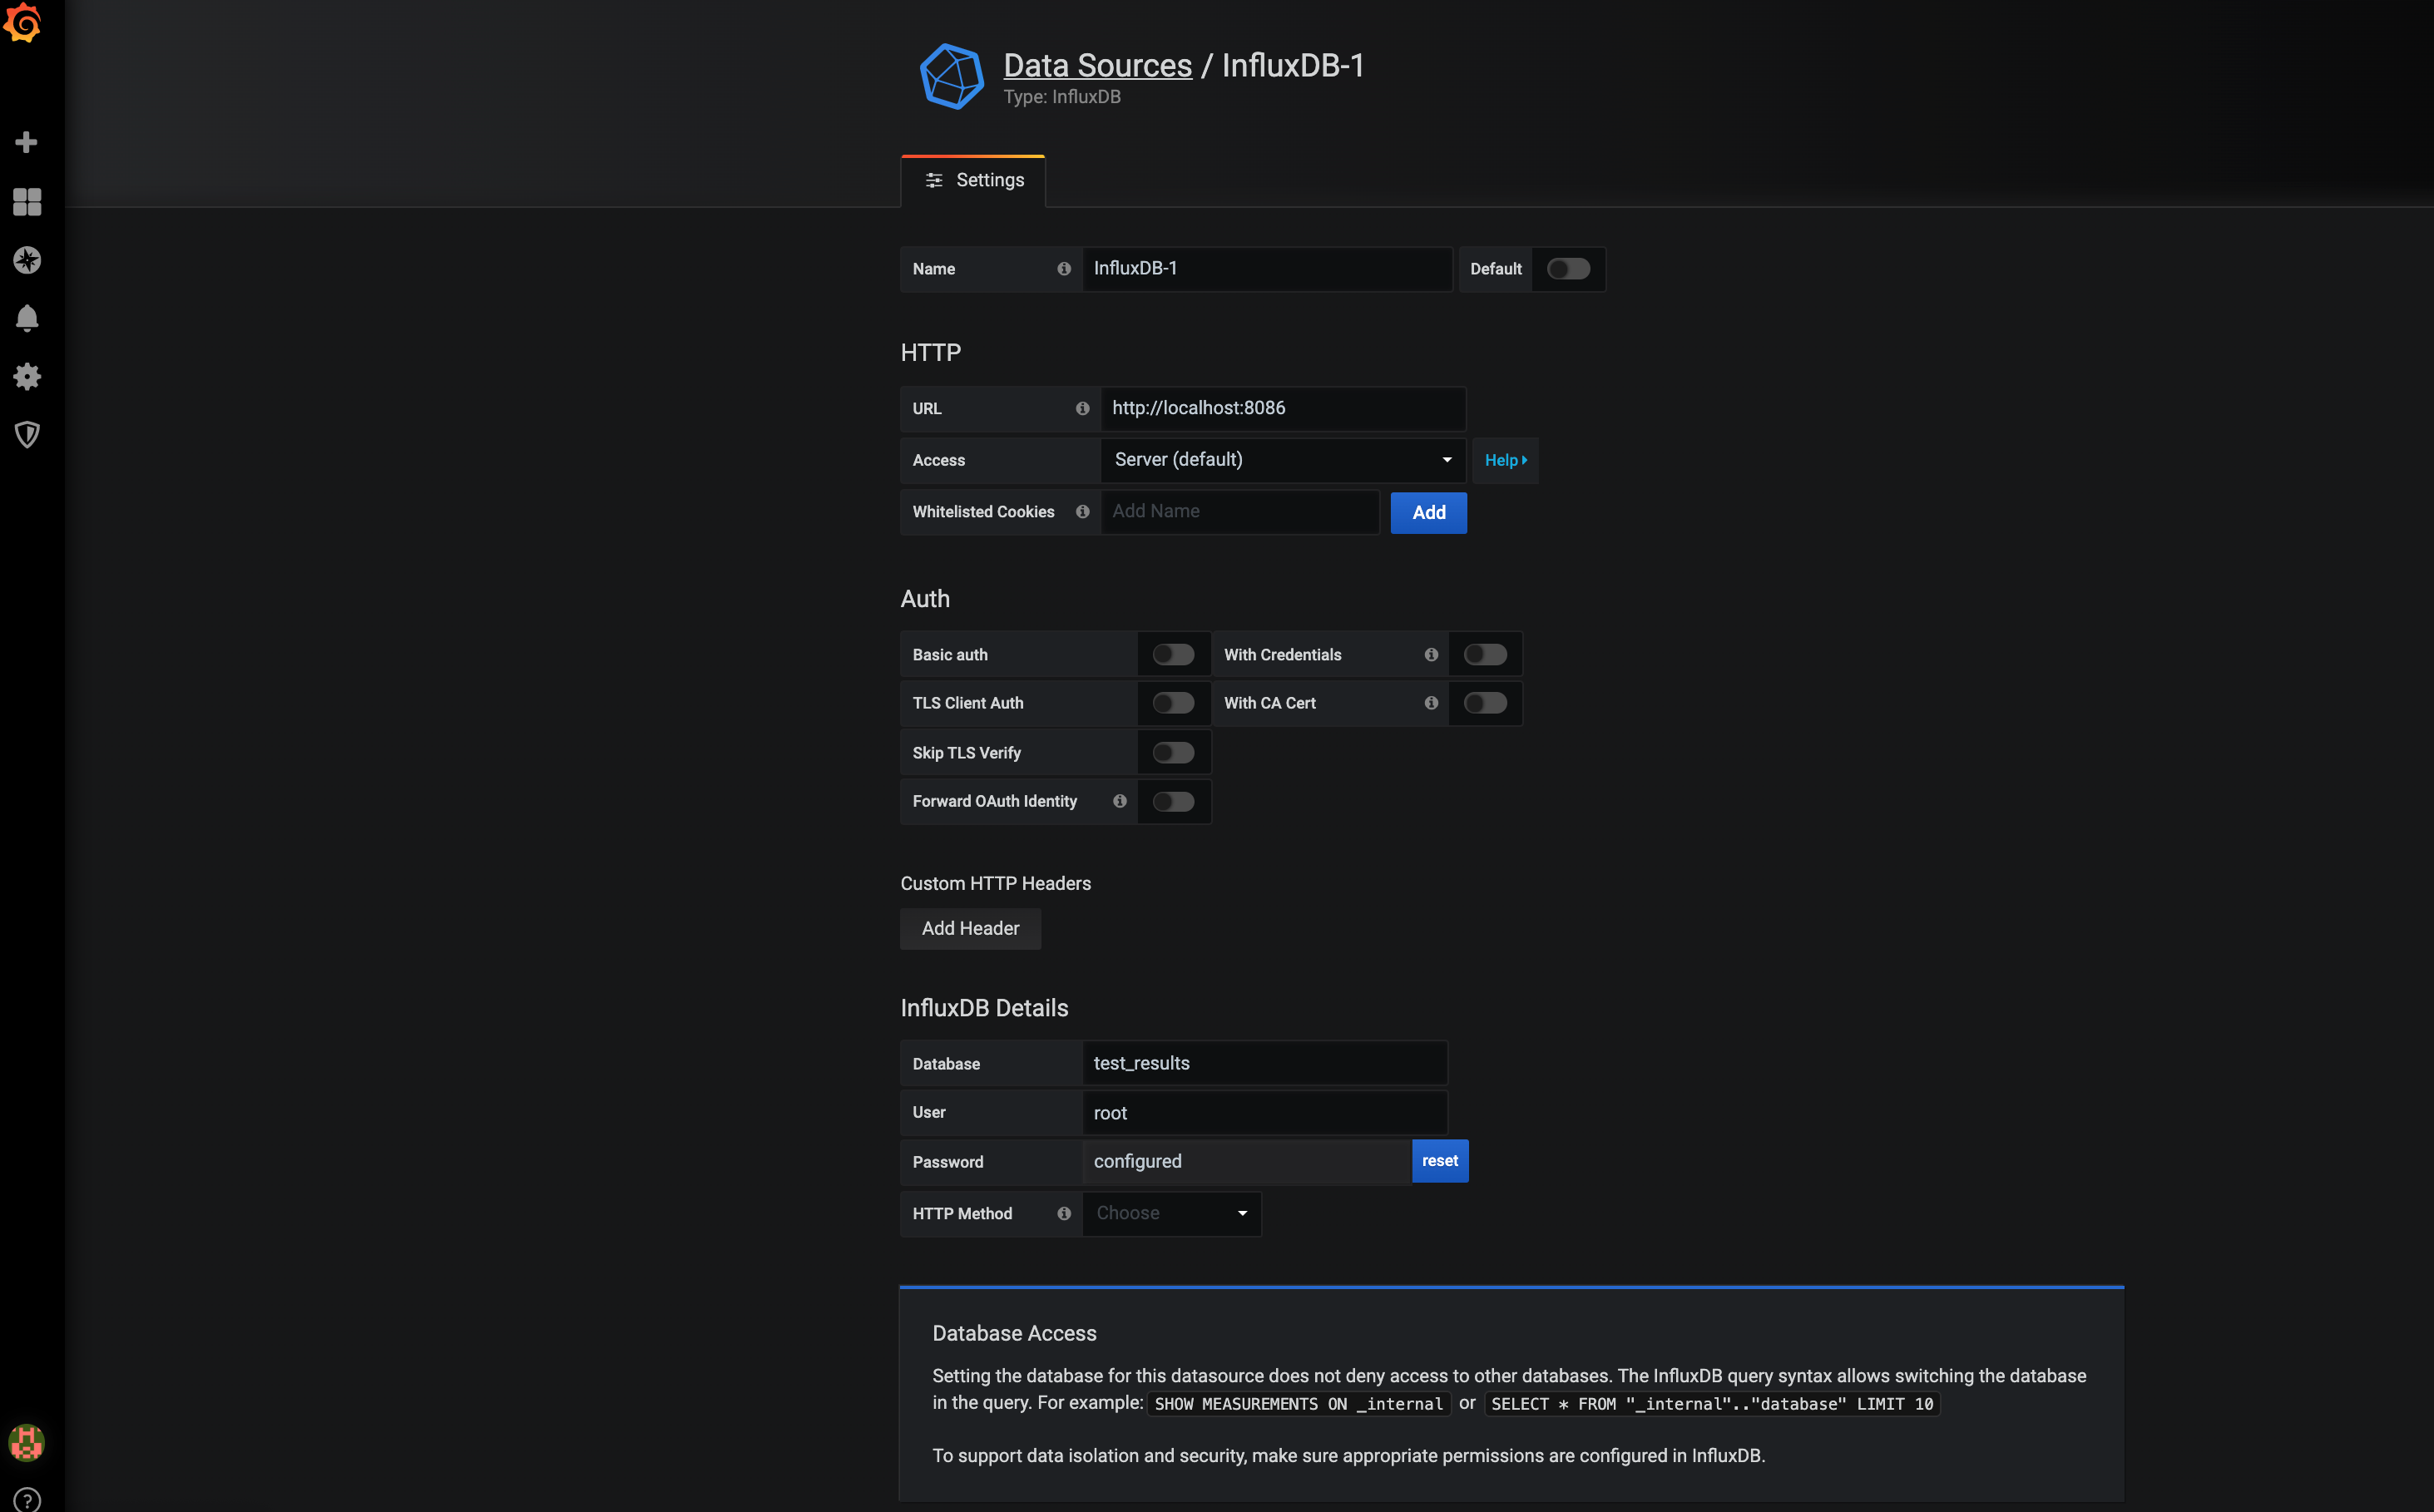
Give the below details in the form displayed.
URL: http://localhost:8086
Database: <database name>
User: root
Password: root
Test and save the connection.
That's it! Both Grafana and InfluxDB are ready to store and display the test-results.
In the next article in this series, we will see about how to how to achieve this with a simple test framework using TestNG. The sample code is here.
Happy Reading!!
Opinions expressed by DZone contributors are their own.
Comments