Visualizing a Career Path
Explaining a career path to someone who doesn't have the same background (as can happen in larger orgs) is hard. Discover a helpful approach for this issue here.
Join the DZone community and get the full member experience.
Join For FreeIf you work for a larger organization, the chances are that you may sooner or later find yourself reporting to someone with a very different background and, as a result, perspective on an organization, roles, etc.; for example, someone with a developer background reports to a marketer. Trying to explain a career and how it has led you to a place and how you might wish it to progress is difficult if the person you’re talking with has little exposure or understanding. Or, it could be simply that the person you’re talking to is a visual thinker.
This is where I found myself recently. So, to facilitate a conversation, I thought I'd try to describe my career and desired direction more visually. After all, CV-style bio/representations are rather abstract, focus on a timeline, and need a domain understanding to appreciate the value.
Visualizing an Organization
To visualize an organization everyone can relate to, the representation must be pretty generic and true to many organizations. The following might not fit every organization, but it should fit any organization with an engineering element, whether software, architecture, or widgets. The size of each segment may fluctuate between organizations, but that is less of an issue than the ideas they represent.

A simple abstract representation of a business
Let’s bring this diagram to life a little more by showing how different parts of the organization sit in the Venn diagram. While the following diagram with its callouts creates more of a specific spin, we’ve avoided organizational-specific names.
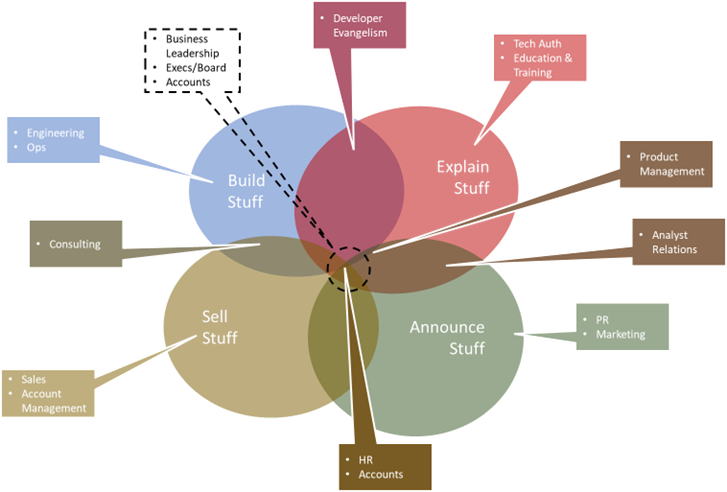
The simple diagram has now been given some "life" and "context" by pinning roles to it. You’ll note that leadership sits in the center, not because that could be perceived as the most influential and important part of the diagram, but because most leaders have a solid grasp of most aspects of a business.
If we assume the further toward the outer edge of each area, the more we’re focused on the skills of that space. Where we have overlap, we see a blending of skills. You may argue with some jobs attributed to the overlapping areas – for example, does a consulting role use sales and build (engineering) skills? From my experience, it does as you need to make compelling arguments for a solution, often needing to understand what the customer wants to "buy."
Plotting a Career Path
With this, we can plot our different roles, and how we link the different points shows our career trajectory. I’ve added my career to illustrate the point – you can compare this against my LinkedIn profile if that helps.
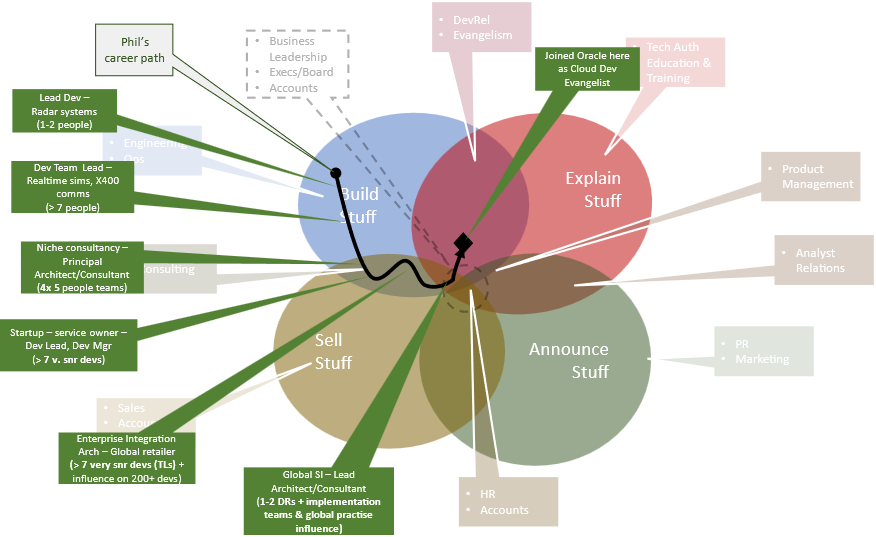
We’ve now plotted our career journey on the diagram. Notice how my path fluctuates in the "Build Stuff/Sell Stuff" area as it reflects the shift in and out of consulting roles.
With the path plotted and with callouts highlighting facts that may be important to a conversation. For example, suppose I wanted to move in the direction of announcing stuff (i.e., marketing). In that case, it will be a real stretch out of my comfort zone, given that my career has always had a solid engineering basis. We can plot our career aspirations and even the possible steps we want to progress such a journey.
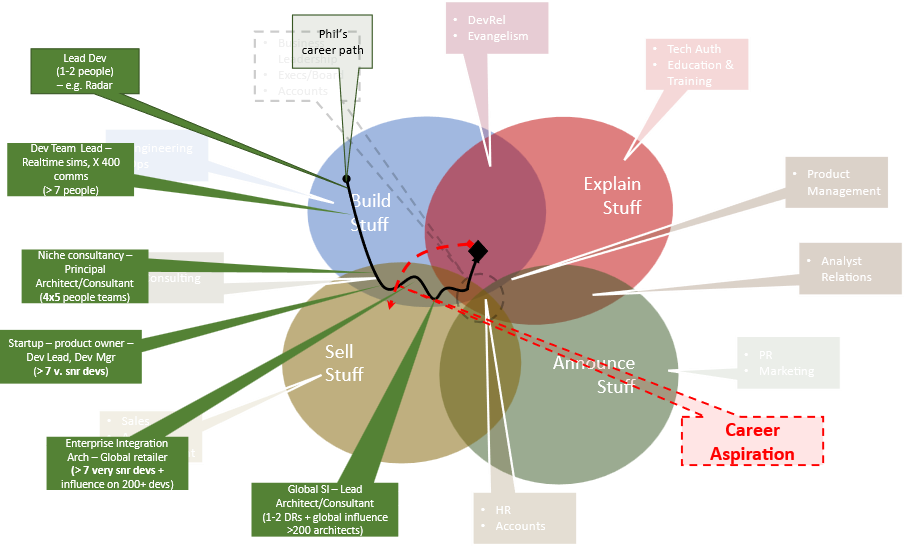
We’ve added to the path a line indicating an aspiration to go into a pre-sales role. You could even derive from how it has been drawn that an interim step could be moving back to a consulting role.
As you can see, it becomes much easier to suggest and infer aspects of someone’s possible career path and aspirations. Even without any genuine appreciation of roles and likely skills involved, it would be pretty reasonable to infer such a career journey is going to stretch, and it may even involve an interim role to help the transition. At this point, this isn’t a career path I am looking to take.
Becoming More Scenarios in the Same Role
But what if you want to stay in the same role but progress in seniority? I would suggest that visualization will still help provide positioning and context within the organization. But rather than illustrating the career path with just an x-y axis, we probably need to use an additional axis or shape and size. For example, showing gaining seniority with concentric rings. For example:
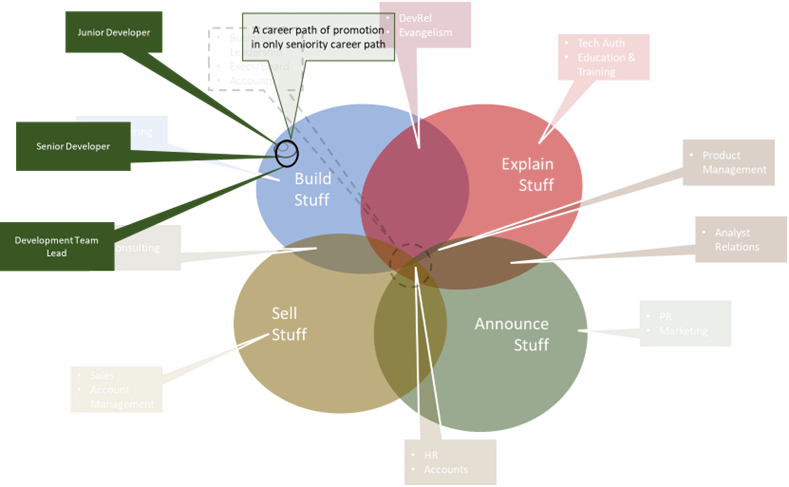
In the diagram, the rings are also colored slightly differently to help make each one distinguishable. But using increasingly larger rings to help show increasing seniority in the same role covers more space on the diagram, reflecting a typical increase in scope for the role.
Conclusion
I’ve found this visualization helpful to both help me think about my career path and express what I hope to achieve going forward. It has also helped me appreciate that my career has perhaps had more lateral movement than vertical in terms of responsibilities, but experience has grown the scale of potential influence.
The true test of this is if you can just provide the diagram without the supporting written narrative.
The diagrams have been created with points and can be found here. Feel free to take the presentation and put it to use. All I ask is that if you find it helpful, let us know, and please try to acknowledge the source.
Opinions expressed by DZone contributors are their own.
Comments