Visualizing and Analyzing Java Dependency Graph with Gephi
Gephi comes with tools to analyse properties of a graph.
Join the DZone community and get the full member experience.
Join For FreeIn my daily job I'm often involved in code/architecture review projects and thus always interested in the latest fancy tools for visualizing certain structural aspects of software. Then last year I did this marvelous Coursera MOOC called Social Network Analysis which requires participants to do a little project to get the certificate. And so I thought, well, okay, let's try to use Gephi, a nice graph visualization platform which we were using throughout the MOOC, and apply it to java software namely JUnit...
What makes this approach interesting appart from being a nice leisure project? Gephi comes with tools to analyse properties of a graph, for instance you can compute certain metrics of nodes like Betweenness Centrality and compare it to a random Erdős–Rényi model of a graph
Astonishingly enough Gephi comes with an example of a full graph of package dependencies of some JDK but actually there's neither a built in function or plugin to read in package dependencies from a java project. This is why I wrote a little python script for the Gephi Scripting Console which allows me to process JDepends XML output.
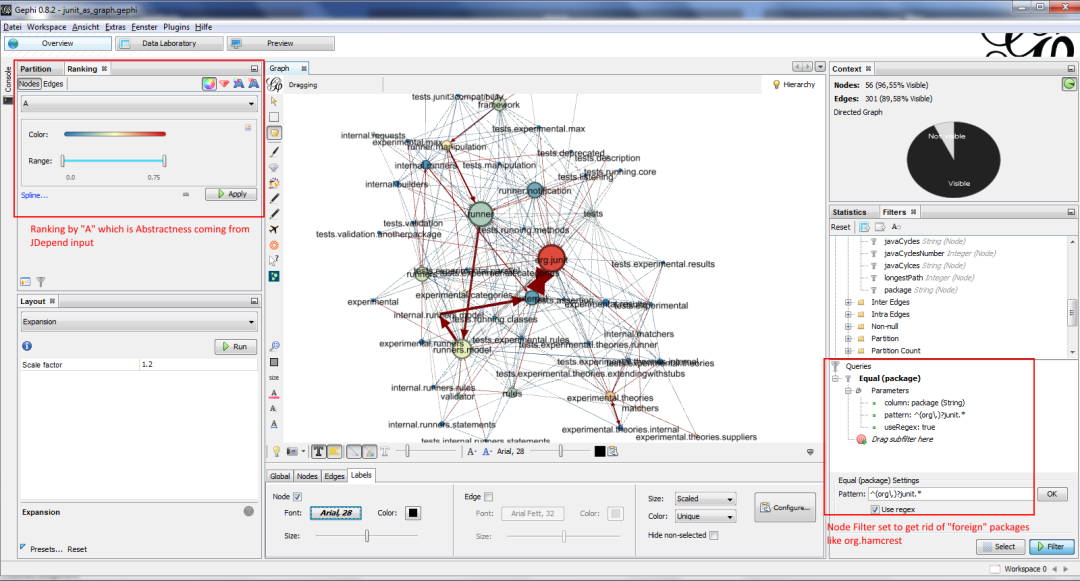
Following Picture shows Gephis "Overview" view with JUnit already loaded and the Nodes Partitioned (colored) by their Abstractness (Parameter "A") which was imported from JDepends XML output.
Okay... here's what I did - Check out my Github repository https://github.com/huberp/graph_sourcecode_analysis
The Workflow steps to produce a Package graph in Gephi is:
- Prerequisites: You have chosen your favorite Java(tm) IDE and installed the JDepend plugin. I use eclipse as my favorite IDE
- Run JDepend on your project.
- Export JDepend output as XML file, let's name it <jdepend.xml>. I have included an example for such an XML created from JUnit(tm). check out folder /examples
- Git Clone this repository to your local machine, let's say to folder <yourpath>
- Open the file jdepend-xml-to-nodes_and_edges.py
- Edit the line which starts with
cfg_yourJDependInputFile =. Point the value to your file <jdepend.xml> including the full path. Save it!cfg_stripCommonBasePackage. Create a list of Package prefixes which will be stripped of in order to make the lables shorter. Note: The full qualified package name is still available in column package. In my JUnit example I've used["org.junit.","junit."]
- Open Gephi and create a new Project
- In Gephi - Change to Datalaboratory View and open the Scripting Console (somewhere on the left side)
- Now type into the Scripting Console Window:
execfile("<yourpath>\\jdepend-xml-to-nodes_and_edges.py")and press <Enter>. Note: Please use double backslash on Windows, e.g.execfile("D:\\temp\\jdepend-xml-to-nodes_and_edges.py") - Hopefully the script runs without errors. Checkout both the Nodes and the Edges Tab of the Datalaboratory View. It should be populated with entries now.
- Now you're ready to switch to Gephis' Overview View and checkout the dependency graph.
- Finally it's time to figure out what Gephi can do:
- Try out several Layout Algorithms.
- Go and compute Graph Metrics like for instance Eccentrisity.
- Colour your nodes by Partition Parameter
Some Experiments
I created the first Version of this script back in 2013 for the Peer Project of the Coursera MOOC Social Network Analysis. I have included my report in this repository which contains some analysis for JUnit showing that JUnit has, well, a Architecture that is close to a very random Erd?s–Rényi Graph...;-)
Here's some files for you:
- As a shortcut I have included a .gephi graph file for Junit, ready for you to do some experiments. Check out <yourpath>/examples/junit/junit_as_graph.gephi
- Here's my report for the Social Network Analysis MOOC: Report
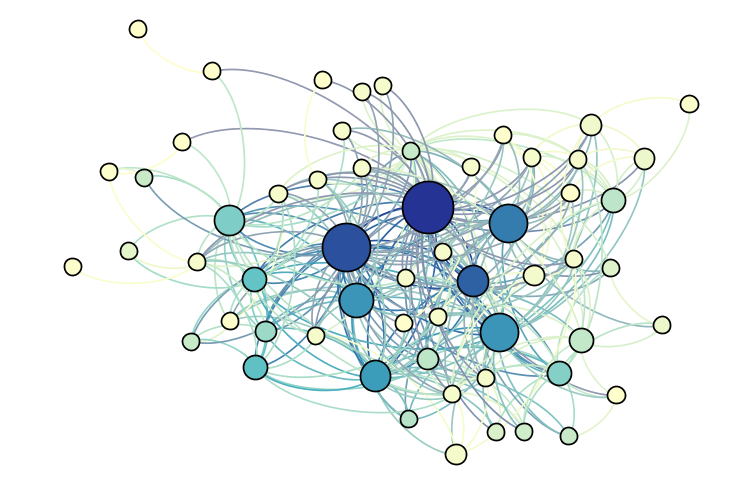
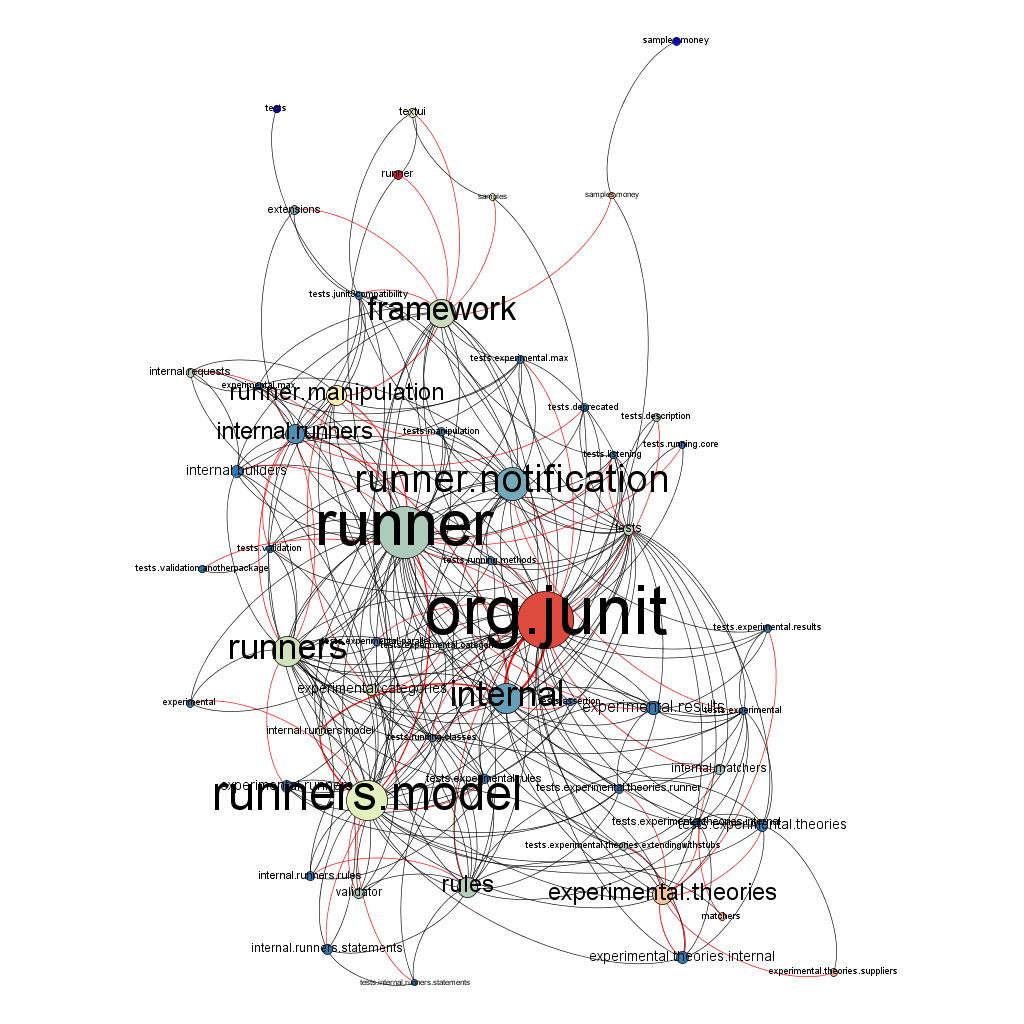
It describes the whole forkflow and does some analysis on JUnit. It shows that actually Junits Architecture has seen from a metrics perspective only resemblance to a random graph. One might conclude that the process of "designing an architecture" should provide a different picture... - And this is are visualisations of JUnit (2nd is the "Preview" View of the Abstractness-Ranking which has been shown above)
Opinions expressed by DZone contributors are their own.
Comments