Visualizing the Air Quality Index (AQI) Across Punjab, Pakistan, and India
Learn how to use IQAir data for visualizing air quality in Punjab to gain insight into the widespread impact of air pollution across the region.
Join the DZone community and get the full member experience.
Join For FreeAir pollution has become a pressing issue in South Asia with recent reports from major news outlets, such as the BBC and CNN, highlighting Lahore in Pakistan as a city struggling with critically poor air quality. Using open data from IQAir, this article plots the Air Quality Index (AQI) for Lahore and expands the analysis to include other locations within Punjab, covering cities in both Pakistan and India. By visualizing AQI levels across these areas, we can shed light on the air pollution crisis, its implications, and potential areas for environmental intervention.
The notebook file used in this article is available on GitHub.
Introduction
Air pollution has emerged as a significant environmental and health concern across South Asia, particularly in densely populated urban areas. Among the most affected cities is Lahore in Pakistan, which has repeatedly been ranked as one of the most polluted cities globally. Recent reports from several news outlets have highlighted Lahore's ongoing struggle with hazardous air quality levels, drawing attention to the urgent need for solutions. In this article, we use data from IQAir to examine the Air Quality Index (AQI) not only in Lahore but also in other cities across Punjab, in both Pakistan and India. By analyzing AQI data across these regions, we can gain insights into the scope of the pollution crisis and identify areas where targeted interventions could help mitigate its impact.
Create a SingleStore Cloud Account
A previous article showed the steps to create a free SingleStore Cloud account. We'll use the Standard Tier and take the default name for the Workspace Group and Workspace. The Standard Tier is required as, at the time of writing this article, only the Standard Tier currently supports writing files to Stage, which we'll need for saving our Folium map so that we can download it.
We'll use the free Community API plan at IQAir for our weather and pollution data. We'll store our IQAir API Key in the secrets vault using the name IQAIR_API_KEY.
Import the Notebook
We'll download the notebook from GitHub (linked in the introduction).
From the left navigation pane in the SingleStore cloud portal, we'll select DEVELOP > Data Studio.
In the top right of the web page, we'll select New Notebook > Import From File. We'll use the wizard to locate and import the notebook we downloaded from GitHub.
Run the Notebook
After checking that we are connected to our SingleStore workspace, we'll run the cells one by one.
We'll begin by installing the necessary libraries and importing dependencies.
We'll then load our IQAir API Key:
api_key = get_secret("IQAIR_API_KEY")Next, we'll define the countries and state:
# Define the countries and state
countries = ["Pakistan", "India"]
state = "Punjab"

# Initialise the list to store locations in the specified tuple format
locations = []
Now, we'll loop through each country finding the cities using the IQAir API:
# Loop through each country
for country in countries:
    # Fetch cities for the specified state and country
    response_cities = requests.get(
        f"http://api.airvisual.com/v2/cities?state={state}&country={country}&key={api_key}"
    )
    cities_data = response_cities.json()

    # Check if the request was successful
    if cities_data["status"] == "success":
        # Create each tuple and add it to the locations list
        locations.extend([(country, state, city["city"]) for city in cities_data["data"]])
    else:
        print(f"Error fetching cities for {state} in {country}: {cities_data.get('data', 'No additional information')}")

    # Wait before the next API call to avoid rate limits
    time.sleep(12)
We'll now print the list of cities:
# Print the locations list to verify
print(tabulate(
    locations,
    headers = ["Country", "State", "City"],
    tablefmt = "pretty",
    stralign = "left"
))
Example output:
+----------+--------+-----------------+
| Country  | State  | City            |
+----------+--------+-----------------+
| Pakistan | Punjab | Bahawalpur      |
| Pakistan | Punjab | Lahore          |
| Pakistan | Punjab | Lodhran         |
| Pakistan | Punjab | Mangla          |
| Pakistan | Punjab | Multan          |
| Pakistan | Punjab | Pindi Bhattian  |
| Pakistan | Punjab | Rahim Yar Khan  |
| Pakistan | Punjab | Rawalpindi      |
| Pakistan | Punjab | Rojhan          |
| India    | Punjab | Amritsar        |
| India    | Punjab | Bathinda        |
| India    | Punjab | Doburji         |
| India    | Punjab | Fatehgarh Sahib |
| India    | Punjab | Jalandhar       |
| India    | Punjab | Ludhiana        |
| India    | Punjab | Patiala         |
| India    | Punjab | Salodi          |
+----------+--------+-----------------+
Sometimes weather stations may not be available in some cities, so the number of cities may vary from run to run.
Next, we'll prepare two DataFrames to receive the weather and pollution data, as follows:
weather_columns = [
    "Timestamp",
    "Country",
    "State",
    "City",
    "Latitude",
    "Longitude",
    "Temperature",
    "Pressure",
    "Humidity",
    "Wind Speed",
    "Wind Direction"
]

pollution_columns = [
    "Timestamp",
    "Country",
    "State",
    "City",
    "Latitude",
    "Longitude",
    "AQI US",
    "AQI CN"
]

weather_df = pd.DataFrame(columns = weather_columns)
pollution_df = pd.DataFrame(columns = pollution_columns)
Now, we'll iterate over the locations and build up the DataFrames:
# Iterate over locations to fetch and add data to the dataframes
for location in locations:
    country, state, city = location

    try:
        # Fetch data from the API
        response_api = requests.get(
            f"https://api.airvisual.com/v2/city?city={city}&state={state}&country={country}&key={api_key}"
        )
        response_api.raise_for_status()
        parsed_json = response_api.json()
        dt = datetime.now().strftime("%Y-%m-%d %H:%M:%S")

        # Extract coordinates
        coordinates = parsed_json.get("data", {}).get("location", {})
        latitude = coordinates.get("coordinates", [np.nan, np.nan])[1]
        longitude = coordinates.get("coordinates", [np.nan, np.nan])[0]

        # Extract weather data
        weather = parsed_json.get("data", {}).get("current", {}).get("weather", {})
        temperature = weather.get("tp", np.nan)
        pressure = weather.get("pr", np.nan)
        humidity = weather.get("hu", np.nan)
        wind_speed = weather.get("ws", np.nan)
        wind_direction = weather.get("wd", np.nan)
        weather_data = [dt, country, state, city, latitude, longitude, temperature, pressure, humidity, wind_speed, wind_direction]

        # Append the weather data to the weather dataframe
        weather_df = pd.concat([weather_df, pd.DataFrame([weather_data], columns = weather_df.columns)], ignore_index = True)

        # Extract pollution data
        pollution = parsed_json.get("data", {}).get("current", {}).get("pollution", {})
        aqi_us = pollution.get("aqius", np.nan)
        aqi_cn = pollution.get("aqicn", np.nan)
        pollution_data = [dt, country, state, city, latitude, longitude, aqi_us, aqi_cn]

        # Append the pollution data to the pollution dataframe
        pollution_df = pd.concat([pollution_df, pd.DataFrame([pollution_data], columns = pollution_df.columns)], ignore_index = True)

        # Add delay to avoid hitting the rate limit
        # 5 requests every 60 seconds, therefore 1 request every 12 seconds
        time.sleep(12)
    except requests.exceptions.RequestException as e:
        print(f"Failed to fetch data for {city}, {state}: {e}")
We'll now create our database:
DROP DATABASE IF EXISTS iqair_demo;
CREATE DATABASE IF NOT EXISTS iqair_demo;
And then create the connection:
from sqlalchemy import *

db_connection = create_engine(connection_url)
At this point we'll write the weather and pollution data to SingleStore, which will allow us to perform further analysis, if required:
weather_df.to_sql(
    "weather",
    con = db_connection,
    if_exists = "replace",
    index = False,
    chunksize = 1000
)

pollution_df.to_sql(
    "pollution",
    con = db_connection,
    if_exists = "replace",
    index = False,
    chunksize = 1000
)
Now we'll use Plotly Express to create a pollution map:
# Ensure AQI US is numeric
pollution_df["AQI US"] = pd.to_numeric(pollution_df["AQI US"], errors = "coerce")

# Now plot the map
fig = px.scatter_mapbox(
    pollution_df,
    lat = "Latitude",
    lon = "Longitude",
    color = "AQI US",
    size = "AQI US",
    color_continuous_scale = "OrRd",
    size_max = 20,
    zoom = 5,
    title = "Air Quality Index (AQI) in Punjab, Pakistan-India",
    hover_name = "City",
    hover_data = {
        "AQI US": True,
        "Timestamp": True
    }
)

# Set map style and layout options
fig.update_layout(
    mapbox_style = "carto-positron",
    margin = {"r":0, "t":40, "l":0, "b":0}
)

fig.show()
Example output is shown in Figure 1.
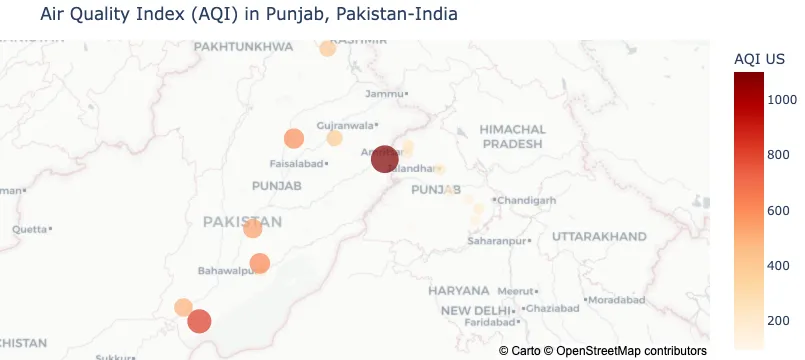
Figure 1: AQI in Punjab
With some slight modifications, we can use an AQI US color scheme:
# Define the ranges for each AQI category
aqi_bounds = [0, 51, 101, 151, 201, 301, 500]

# Define the names of each AQI category
aqi_categories = [
    "Good",
    "Moderate",
    "Unhealthy for Sensitive Groups",
    "Unhealthy",
    "Very Unhealthy",
    "Hazardous"
]

# Define the colors for each AQI category
aqi_colors = {
    "Good": "green",
    "Moderate": "yellow",
    "Unhealthy for Sensitive Groups": "orange",
    "Unhealthy": "red",
    "Very Unhealthy": "purple",
    "Hazardous": "maroon"
}

# Map AQI values to categories based on bounds
def get_aqi_category(value):
    for i, bound in enumerate(aqi_bounds):
        if value < bound:
            return aqi_categories[i - 1]
    return aqi_categories[-1]

# Apply category mapping to your DataFrame
pollution_df["AQI Category"] = pollution_df["AQI US"].apply(get_aqi_category)

# Now plot the map using the AQI categories with the discrete color scale
fig = px.scatter_mapbox(
    pollution_df,
    lat = "Latitude",
    lon = "Longitude",
    color = "AQI Category",
    color_discrete_map = aqi_colors,
    size = "AQI US",
    size_max = 20,
    zoom = 5,
    title = "Air Quality Index (AQI) in Punjab, Pakistan-India",
    hover_name = "City",
    hover_data = {
        "AQI US": True,
        "Timestamp": True
    },
    category_orders = {
        "AQI Category": [
            "Hazardous",
            "Very Unhealthy",
            "Unhealthy",
            "Unhealthy for Sensitive Groups",
            "Moderate",
            "Good"
        ]
    }
)

# Set map style and layout options
fig.update_layout(
    mapbox_style = "carto-positron",
    margin = {"r": 0, "t": 40, "l": 0, "b": 0}
)

fig.show()
Example output is shown in Figure 2.
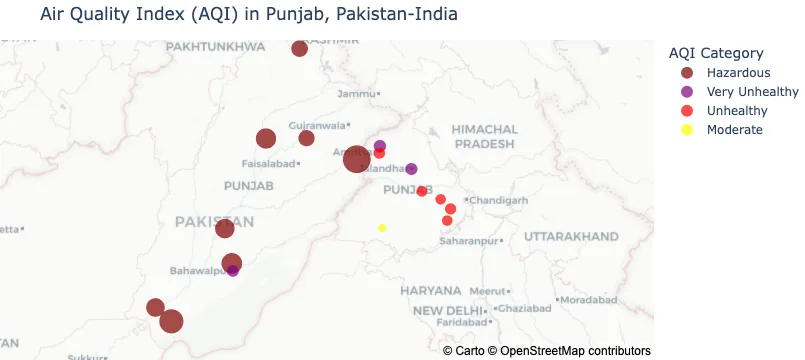
Figure 2: AQI in Punjab using the US Color Scheme
Clearly, for this particular data snapshot, pollution levels are very high.
Finally, we'll create a map using Folium:
# Centered on Lahore, Punjab
Lahore = [31.549722, 74.343611]

m = folium.Map(
    location = Lahore,
    control_scale = True,
    zoom_start = 6
)

# Prepare the data for the heatmap
heat_data = [
    [row["Latitude"], row["Longitude"], row["AQI US"]]
    for index, row in pollution_df.iterrows()
]

# Add the heatmap layer
HeatMap(
    data = heat_data,
).add_to(folium.FeatureGroup(name = "AQI Heatmap").add_to(m))

markers_group = folium.FeatureGroup(name = "AQI Markers").add_to(m)

# Add custom markers
for index, row in pollution_df.iterrows():
    folium.Marker(
        location = [row["Latitude"], row["Longitude"]],
        popup = f'{row["City"]} AQI US: {row["AQI US"]}',
        icon = folium.Icon(icon = "info-sign")
    ).add_to(markers_group)

folium.LayerControl().add_to(m)

plugins.Fullscreen(
    position = "topright",
    title = "Fullscreen",
    title_cancel = "Exit",
    force_separate_button = True
).add_to(m)

html_content = m._repr_html_()
We'll save the map to Stage and then we can download it locally:
with nb.stage.open("map.html", "w") as st:
    st.write(html_content)
Example output is shown in Figure 3.
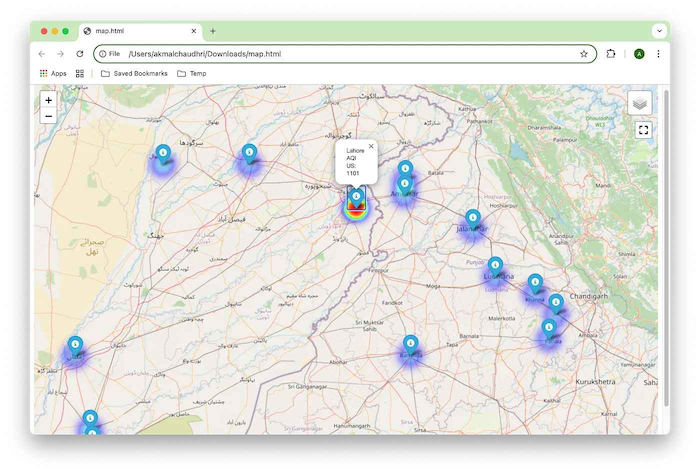
Figure 3: AQI using Folium
Summary
In this article, we've plotted the air quality across various cities in Punjab, Pakistan, and India, with a particular focus on Lahore, which has been frequently reported in the media for its poor air quality. By plotting the data from IQAir, the AQI for Lahore and other cities in the region was visualized through several maps. The results highlighted the widespread impact of air pollution across the region, showing that cities in both Pakistan and India often experience unhealthy levels of pollution. Environmental interventions are required and should be prioritized to address the growing concerns over public health and sustainability.
Published at DZone with permission of Akmal Chaudhri. See the original article here.
Opinions expressed by DZone contributors are their own.
Comments