We Crunched 1 Billion Java Logged Errors – Here’s What Causes 97% Of Them
Tools like Splunk, ELK, and Sumo Logic have made it faster to search logs but all these tools suffer operational noise which is the silent killer of IT and businesses.
Join the DZone community and get the full member experience.
Join For Free97% of Logged Errors are Caused by 10 Unique Errors
It’s 2021 and one thing hasn’t changed in 30 years. DevOps teams still rely on log files to troubleshoot application issues. We trust log files implicitly because we think the truth is hidden within them. If you just grep hard enough or write the perfect regex query, the answer will magically present itself in front of you.
Tools like Splunk, ELK, and Sumologic have made it faster to search logs but all these tools suffer from one thing – operational noise. Operational noise is the silent killer of IT and your business today. It’s the reason why application issues go undetected and take days to resolve.
Log Reality
Here’s a dose of reality, you will only log what you think will break an application, and you’re constrained by how much you can log without incurring unnecessary overhead on your application. This is why debugging through logging doesn’t work in production and why most application issues go undetected.
Let’s assume you do manage to find all the relevant log events, that’s not the end of the story. The data you need usually isn’t there and leaves you adding additional logging statements, creating a new build, testing, deploying, and hoping the error doesn't happen again. Ouch.
Time for Some Analysis
We capture and analyze every error or exception that is thrown by Java applications in production. This is what we found from analyzing over 1,000 applications monitored by OverOps.
High-level aggregate findings:
- Avg. Java application will throw 9.2 million errors/month
- Avg. Java application generates about 2.7TB of storage/month
- Avg. Java application contains 53 unique errors/month
- The top 10 Java Errors by Frequency were:
- NullPointerException
- NumberFormatException
- IllegalArgumentException
- RuntimeException
- IllegalStateException
- NoSuchMethodException
- ClassCastException
- Exception
- ParseException
- InvocationTargetException
So there you have it, the NullPointerException is to blame for all that’s broken in log files. Here are some numbers from a random selection of enterprise production applications over the past 30 days:
- 25 JVMs
- 29,965,285 errors
- ~8.7TB of storage
- 353 unique errors
- Top Java errors by frequency were:
- NumberFormatException
- NoSuchMethodException
- Custom Exception
- StringIndexOutOfBoundsException
- IndexOutOfBoundsException
- IllegalArgumentException
- IllegalStateException
- RuntimeException
- Custom Exception
- Custom Exception
Time for Trouble (Shooting)
If you work in DevOps and have been asked to troubleshoot the above application, which generates a million errors a day, what do you do? Let’s zoom in on when the application had an issue right? Let’s pick a 15 minute period. However, that’s still 10,416 errors you’ll be looking at for those 15 minutes.
Do you now see this problem called operational noise? This is why humans struggle to detect and troubleshoot applications and it’s not going to get any easier.
What if We Just Fixed 10 Errors?
Let’s say we fixed 10 errors in the above application. What percent reduction do you think these 10 errors would have on the error count, storage, and operational noise that this application generates every month? 1%, 5%, 10%, 25%, 50%?
How about 97.3%. Yes, you read that. Fixing just 10 errors in this application would reduce the error count, storage, and operational noise by 97.3%.
The top 10 errors in this application by frequency are responsible for 29,170,210 errors out of the total 29,965,285 errors thrown over the past 30 days.
Take the Junk Out of Your App
The vast majority of application log files contain duplicate info which you’re paying to manage every single day in your IT environment. You pay for:
- Disk storage to host log files on servers
- Log management software licenses to parse, transmit, index, and store this data over your network
- Servers to run your log management software
- Humans to analyze and manage this operational noise
The easiest way to solve operational noise is to fix application errors versus ignore them. Not only will this dramatically improve the operational insight of your teams, but you’ll also help them detect more issues and troubleshoot much faster because they’ll actually see the things that hurt your applications and business.
The Solution
If you want to identify and fix the top 10 errors in your application, download OverOps for free, install it on a few production JVMs, wait a few hours, sort the errors captured by frequency, and in one click OverOps will show you the exact source code, object, and variable values that caused each of them. In a few hours, your developers will be able to make the fixes.
The next time you do a code deployment in production, OverOps will instantly notify you of new errors which were introduced and you can repeat this process. Here are two ways we use OverOps to detect new errors in the SaaS platform:
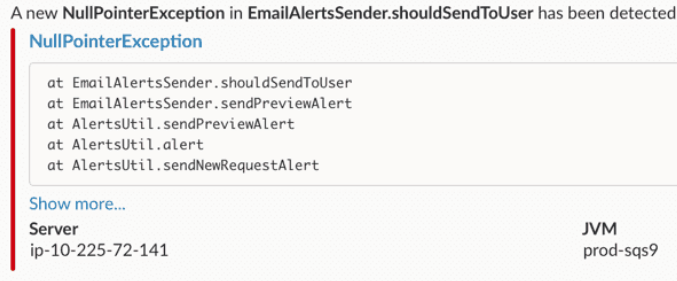
Slack Real-time Notifications: to inform our team of every new error introduced in production as soon as it’s thrown, and a one-click link to the exact root cause (source code, objects & variable values that caused the error).

Email Deployment Digest Report: to show the top 5 new errors introduced with direct links to the exact root cause.

Final Thoughts
We see time and time again that the top few logged errors in production are pulling away most of the time and logging resources. The damage these top few events cause, each happening millions of times, is disproportionate to the time and effort it takes to solve them.
Published at DZone with permission of Nick Andrews. See the original article here.
Opinions expressed by DZone contributors are their own.

Comments