Weblogic Thread Monitoring Tips
By
 ·
·
Interview
·
·
Interview
Likes
(0)
Likes
There are no likes...yet! 👀
Be the first to like this post!
It looks like you're not logged in.
Sign in to see who liked this post!
Comment
Save
24.4K Views
Join the DZone community and get the full member experience.
Join For FreeIf you are working as a middleware administrator or application support individual, you may have realized by now how crucial it is to have proper knowledge of the JVM along with a good understanding of the Java concurrency principles (yes you have to learn how to analyze thread dumps).
There is one principle I’m sure about: it is never too late to improve our knowledge and troubleshooting skills. Reaching a skill “plateau” is quite common and typically not due to our ability to learn but because of our fear and lack of willingness to embrace the challenges.
One of such challenges is possibly your ability to understand and assess the health of the JVM & middleware threads of the Java EE container you are responsible for such as Oracle Weblogic Server. If this is your situation then this post is for you.
Question:
How can you monitor the JVM threads in an efficient manner using the Weblogic admin console? Also, please elaborate how you can differentiate between healthy threads vs. slow running threads. Finally, what other tools can help you achieve this task?
Answer:
Please note that Weblogic Server 10.3.5 was used for the following example.
Oracle Weblogic Server is always installed with an admin console that provides you with out-of-the-box monitoring functions of the various Java EE resources exposed via the JMX API. Weblogic threads (created and assigned by the WLS kernel to the default self-tuning thread pool) are also fully exposed.
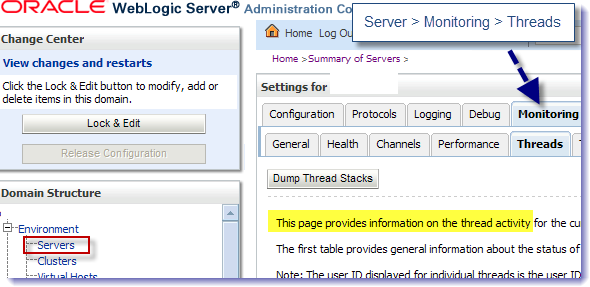
This monitoring page allows you to:
- Monitor the full list of all Java threads under Weblogic control.
- Correlate any slow running thread with your application, request and assigned Work Manager, if any.
- Generate a JVM Thread Dump of the Weblogic managed server directly from the page via the Dump Thread Stacks button.
Thread states - summary view
This section provides a summary of all different Weblogic threads and states.
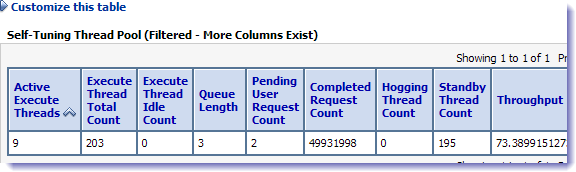
Thread states - detailed view
The detailed view is much more interesting. This is where you will be spending most of your analysis time. Make sure that you add all proper columns including the associated Work Manager, application name etc.


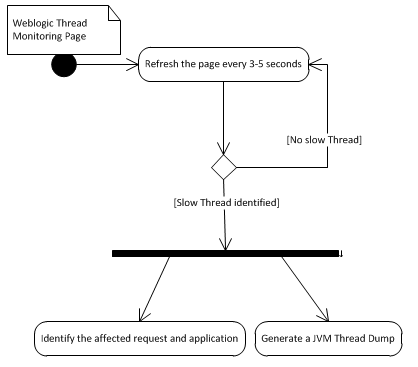
The live Weblogic thread monitoring analysis process I usually follow is as per below. This approach is very useful for production environments when you are trying to determine the source of a performance slowdown or just to give you an idea of the health of the Weblogic threads.
- Refresh the page every 3-5 seconds.
- In between the refresh actions, identify the threads that are still executing the same request (slow running threads). This can be determined if you see the same Weblogic thread “Name” executing the same “Current Request” with the same “Total requests” value. Other criteria’s would be if Weblogic “promote” the affected thread(s) to Hogger or STUCK.
- Continue until you are done with your monitoring activity.
- As soon as one or a few slow running threads are found, identify the affected request(s) and application(s).
- Immediately after, generate a JVM Thread Dump using the Dump Thread Stacks button and copy/paste the output to a text editor for live or future analysis.

I also recommend that you use other tools to monitor the JVM and threads such as JVisualVM. JVisualVM will give a full view of all the threads, including GC related threads. It will also allow you to monitor the Java heap and correlate any finding with the health of the activity of the garbage collector.
Finally, if you suspect that you are dealing with a deeper thread concurrency problem such as thread lock contention or Java-level deadlock, you will need to generate a native thread dump (JVisualVM, kill -3 PID, jstack etc.) which will allow you to review the different monitor locks and locked ownable synchronizers.
Java (programming language)
Published at DZone with permission of Pierre - Hugues Charbonneau. See the original article here.
Opinions expressed by DZone contributors are their own.
Comments