What is 'Load Average?'
Load average is an age-old metric, which is in existence since the 1970s to indicate whether the system is under heavy/average/low load.
Join the DZone community and get the full member experience.
Join For FreeLoad average is an age-old metric, which is in existence since the 1970s to indicate whether the system is under heavy/average/low load. It is useful to indicate whether the system’s load is on an increasing trend or a decreasing trend. In this article, let’s learn more about 'Load Average.'
How to Understand 'Load Average?'
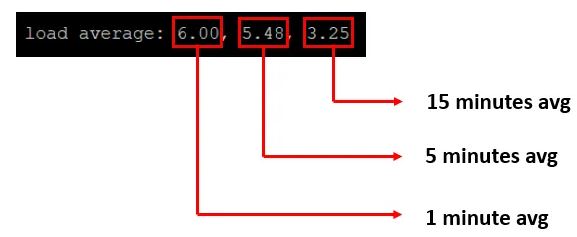
In most cases, 'Load Average' is reported as an average of 1 minute, 5 minutes, and 15 minutes. Please refer to the below screenshot:

The 1-minute load average is 6.00.
The 5-minute load average is 5.48.
The 15-minute load average is 3.25.
It’s hard to say whether the 'Load Average' is high, normal, or low without knowing the number of CPUs present in the system. You can find out the number of CPUs in the system through one of the approaches given here.
1 CPU:
In the above example, we saw a 1-minute load average of '6.00.' Suppose the above system has just 1 CPU, then it indicates 'Load Average' is quite high on this machine. It means this system is processing 600% load at the last minute. We derive 600% because:
= (Load Average / Number of CPUs) x 100
= (6.00 / 1) x 100
= 600%
Thus, the system is 500% overloaded more than the capacity it can handle.
12 CPUs:
Say suppose the above system has 12 CPUs, which means ‘Load Average’ is normal. Since the 1-minute 'Load Average' is '6.00,' it means only 50% of the compute capacity is utilized. We derive 50% because
= (Load Average / Number of CPUs) x 100
= (6.00 / 12) x 100
= 50%
24 CPUs:
Suppose the above system has 24 CPUs, which means the 'Load Average' is quite low. Since the 1 minute 'Load Average' is '6.00,' it means only 16.66% of the compute capacity is utilized. We derive 16.66% because
= (Load Average / Number of CPUs) x 100
= (6.00 / 24) x 100
= 16.66%
In this scenario, we can fairly conclude that this system is underutilized.
What is the Use of 1-minute, 5-minute, and 15-minute 'Load Average?'
'Load Average' intervals help determine whether the system’s demand for computing is increasing over the period or decreasing over time.
Increasing Load Average
Look at the above 'Load Average' reporting. You can notice in the above example 'Load Average' in the system has been increasing. i.e., 15 minutes before this system’s 'Load Average' was '3.25.' 5 minutes before the system’s 'Load Average' was '5.48,' and the last 1-minute 'Load Average' was '6.00.' It indicates the demand for computing is increasing on this system.
Decreasing Load Average
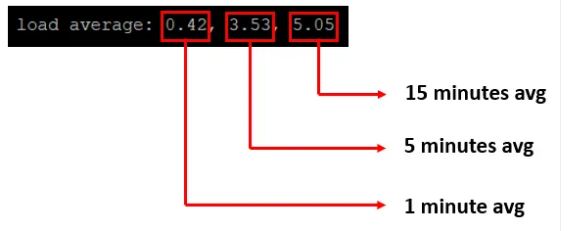
Look at the above 'Load Average' reporting. You can notice in the above example, 'Load Average' in the system has been decreasing. i.e., 15 minutes before this system’s 'Load Average' was '5.05.' 5 minutes before the system’s 'Load Average' was '3.53,' and the last 1-minute 'Load Average' was '0.42.' It indicates the load on this system has been on the decreasing trend.
Does 'Load Average' Measure Only CPU Demand?
It is often told that 'Load Average' only indicates the CPU demand on the system. But it’s not true. 'Load Average' indicates not only CPU demand but also file I/O demand, network I/O demand, disk I/0 demand, and cycles waiting for locks. Here is an interesting case study we conducted to prove this theory.
What is a Good or Bad 'Load Average?'
Load average is fairly a relative term. What might be a good 'Load Average' for one application can be a bad load average for another application. If you ask me what a rule of thumb is, I would say if the 'Load Average' percentage goes beyond 80%, you might want to investigate it.
How to Find 'Load Average?'
'Load Average' can be found from various sources:
a. Unix/Linux command-line tool 'top' reports 'Load Average' in the field as highlighted in the below image:
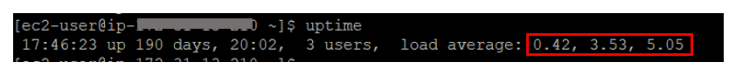
b. Unix/Linux command-line tool 'uptime’ reports ‘Load Average’ in the field as highlighted in the below image:
c. 'Load Average' is also printed in the '/proc/loadavg' file: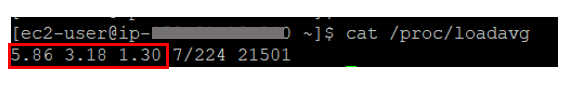
Conclusion
'Load Average' is a good metric that has been in existence since the early 1970s. It gives a high-level pulse of the system. There should be good reasons why this metric has survived for more than a half-century. But if you want to do a detailed root cause analysis where performance degradation is happening, 'Load Average' wouldn’t be sufficient enough. You want to use other tools like top, vmstat, iostat, yCrash,…
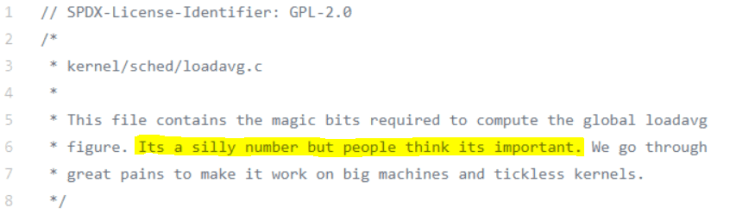
We would also like to conclude this article in the same way Genius Greg Brandon concluded his 'Load Average' blog with the quote from a comment in the Linux source code kernel/sched/loadavg.c written by scheduler maintainer Peter Zijlstra:
Opinions expressed by DZone contributors are their own.
Comments