Proper Kubernetes Health Check for a Kafka Streams Application
Take Kafka for its checkup.
Join the DZone community and get the full member experience.
Join For Free
When you grass your cattle, you typically configure a health check to keep your herd alive. A very common livenessProbe is about doing a GET request to an endpoint, and if the service replies with a two hundred, then we’re fine, otherwise, the pod is destroyed and a new one is brought to live:
livenessProbe httpGet path/health porthttpWith Kafka Streams, it’s not that straightforward. A basic streams application reads data from a topic, performs transformations, and puts it back into another topic. In particular, it does not expose any information about its health.
Let’s go through a few possibilities, none of which is perfect, to pick the best-suited method for your specific situation. If you have other or better ideas, feel free to comment; I’d be more than happy to extend this post.
You may also like: Monitoring Kubernetes in Production: How To Guide (Part 1 of 5).
1. Create a Dedicated HTTP Endpoint
This sounds pretty easy. Along with your Kafka Streams app run a Java HTTP Server, which exposes a health-check endpoint to report the streams state:
import java.io.IOException;import java.net.InetSocketAddress;import com.sun.net.httpserver.HttpServer;import org.apache.kafka.streams.KafkaStreams;class Health { private static final int OK = 200; private static final int ERROR = 500; private final KafkaStreams streams; private HttpServer server; Health(KafkaStreams streams) { this.streams = streams; } void start() { try { server = HttpServer.create(new InetSocketAddress(Config.HOST, Config.PORT), 0); } catch (IOException ioe) { throw new RuntimeException("Could not setup http server: ", ioe); } server.createContext("/health", exchange -> { int responseCode = streams.state().isRunning() ? OK : ERROR; exchange.sendResponseHeaders(responseCode, 0); exchange.close(); }); server.start(); } void stop() { server.stop(0); }}Then, configure the streams app accordingly:
KafkaStreams streams = new KafkaStreams(...); streams.start(); Health health = new Health(streams); health.start(); Runtime.getRuntime().addShutdownHook(new Thread(() -> { try { streams.close(); log.info("Stream stopped"); health.stop(); } catch (Exception exc) { log.error("Got exception while executing shutdown hook: ", exc); } }));This works just fine. If the stream is running, which means its state is either RUNNING or REBALANCING, the app will reply with a 200 response code and Kubernetes won’t touch the pod. In case of a failure, the pod will be re-instantiated.
The drawback of this approach is including an HTTP server in each Kafka Streams application.
2. JMX Based Health Check — 1st Attempt
The Kafka Streams application exposes metrics via JMX if started with the following params:
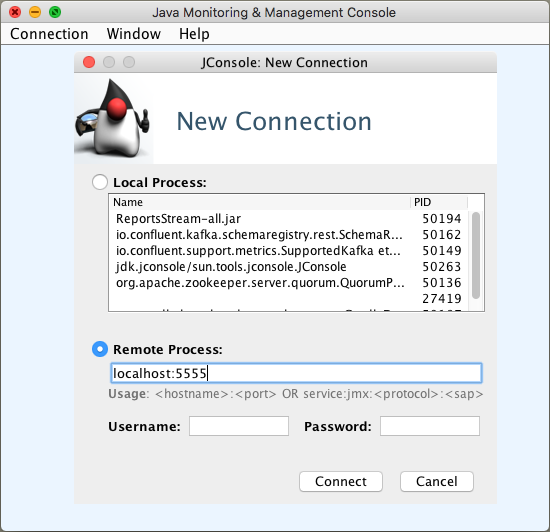
-Dcom.sun.management.jmxremote.port=5555 \-Dcom.sun.management.jmxremote.authenticate=false \-Dcom.sun.management.jmxremote.ssl=falseWhen you connect with Java Monitoring & Management Console a.k.a. jconsole, you’ll get access to a couple of metrics:

No, unfortunately we’re not done, since the status of the app is not among them.
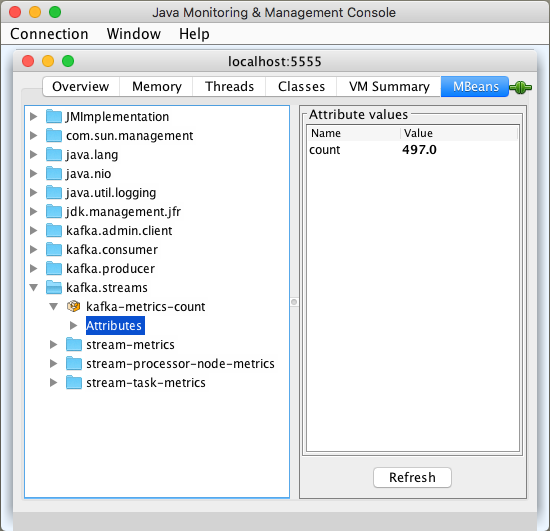
One workaround is to monitor the count metric in the kafka.streams:type=kafka-metrics-count object. If it is higher than 1.0, then I assume the stream is running:

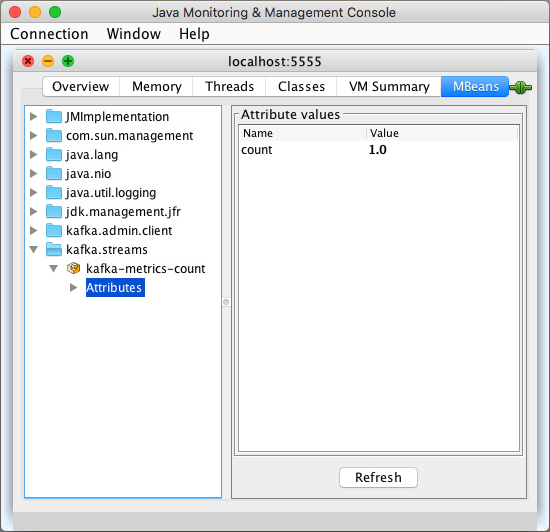
We’ve figured out that when the stream dies, the value for count is 1.0:

How can we build a health check around this knowledge? Kubernetes allows us to run a shell command which, when finishes successfully, exits with 0 and treats that app as healthy.
To read MBeans, we can use Jmxterm, which is available for download. It can run in non-interactive mode reading a particular MBean attribute — that’s exactly our case. The command for the health check looks like this:
livenessProbe exec commandhealthcheck.shThe healthcheck.sh script contains one command:
if [ `echo "get -s -b kafka.streams:type=kafka-metrics-count count" | java -jar jmxterm-1.0.0-uber.jar -l localhost:5555 -v silent -n` = "1.0" ] ; then exit 1; fiThis approach has drawbacks: we need to provide the jmxterm jar file, as well as the script file in the Kubernetes pod. Let’s try to get rid of the script first.
3. JMX Based Health Check — 2nd Attempt
Since we only require to know one particular metric, I’ve written a dedicated Java app, which can be downloaded from here. If the value of the count attribute is 1.0, it throws an exception and finishes with a non-zero exit code.
The health check command is no longer complex and can be typed directly in the command section:
livenessProbe exec commandjava-jarkafka-streams-health-check-1.0.0.jarStill, the jar file needs to be a part of the pod. If you’re not happy to do that, let’s explore another solution:
4. Man Does Not Live by Health Check Alone
It may not always be desired to kill the bad pod and start a new one if a stream dies. It depends on the failure the stream encountered. Instead of reviving the pod in an automated fashion, you may want to receive an alert, that the app is no longer running and fix the issues manually before starting the app again.
Kubernetes defines a quite common pattern called sidecar. You create a pod which consists of the main container, the Kafka Streams application, and an accompaniment, a jmx exporter application. The official helm charts shipped by Confluent follow this style.
The Kafka broker, Schema Registry, Rest Proxy, and KSQL have a jmx exporter on the side. Just take a look at this deployment descriptor configuring the prometheus-jmx-exporter container on the side of the main container running KSQL.
The benefits are that we follow a kind of a standard approach. Finally, we do have more metrics to look into.
However having a sidecar means, we need to provide additional resources and budget for the additional container— one for every Kafka Streams app.
With a sidecar in our Kafka Streams application, we may no longer need a health check. The benefit of relying just on metrics and alerts and abandon health checks is that we don’t clutter our Kafka Streams application container with additional jar files.
There are no free lunches in life! We have to configure a monitoring system and alerts notifying us, when the Kafka Streams app dies — we need to go deeper.
Adding a Sidecar Container
First, let’s configure the Kafka Streams application to be run inside a docker container. As already mentioned, we also need to pass a few com.sun.management.jmxremote JVM arguments to expose JMX MBeans. Since it’s a good idea to automate the building and publishing of a docker image, let’s use a great gradle plugin and configure the docker image and the application itself in the build.gradle file:
docker { javaApplication { if (System.getenv('GOOGLE_APPLICATION_CREDENTIALS')) { registryCredentials { url = 'https://eu.gcr.io' username = '_json_key' password = file(System.getenv('GOOGLE_APPLICATION_CREDENTIALS')).text } } baseImage = 'openjdk:11-jdk' maintainer = 'Grzegorz Kocur "grzegorz.kocur@softwaremill.com"' tag = 'eu.gcr.io/myproject/' + project.name.toLowerCase() + ':' + dockerVersion jvmArgs = [ "-Dcom.sun.management.jmxremote.port=5555", "-Dcom.sun.management.jmxremote.authenticate=false", "-Dcom.sun.management.jmxremote.ssl=false"] }}Please note — there is no need to set the java.rmi.server.hostname property, since, inside the pod, containers share their network namespaces and communicate with each other using localhost. This simplifies things a lot.
Now, it’s time for the jmx exporter sidecar. It needs a configuration file. A good practice is to decouple the application and its configuration. In Kubernetes, there is a dedicated object for this — the ConfigMap:
apiVersionv1kindConfigMapmetadata namejmx-exporter-configdata jmx-prometheus.yml+ jmxUrlservicejmxrmi///jndi/rmi//localhost5555/jmxrmi lowercaseOutputNametrue lowercaseOutputLabelNamestrue sslfalse rulespattern".*"It’s a very basic example — the jmx exporter will connect to the Kafka Streams application at localhost on port 5555 and read all metrics. It’s important to use the same port as in the main application configuration.
When the ConfigMap is created on Kubernetes we can consume it within a deployment by mounting it as a volume:
spec template spec volumesnamejmx-config configMap namejmx-exporter-configThe last step is to add the sidecar container to the pod:
spec template spec containersnameprometheus-jmx-exporter imagesolsson/kafka-prometheus-jmx-exporter commandjava-jarjmx_prometheus_httpserver.jar5556/etc/jmx-exporter/jmx-prometheus.yml ports5556 namemetrics volumeMountsnamejmx-config mountPath/etc/jmx-exporterand expose it using a Kubernetes Service:
apiVersionv1kindServicemetadata namekafka-stream-service labels appkafka-streamsspec typeClusterIP portsport .Values.prometheus.jmx.port targetPortmetrics namemetrics protocolTCP selector appkafka-streamsWe recommend using Prometheus Operator within a Kubernetes instance. Then, you can configure a ServiceMonitor to add the jmx exporter as a target for the Prometheus instance automatically:
apiVersionmonitoring.coreos.com/v1kindServiceMonitormetadata namejmx-exporter-servicespec selector matchLabels appkafka-streams endpointsportmetricsOnce Prometheus reads the metrics we can create alerts and configure an alert manager to send the required notifications using a communication channel of your choice: Slack or text messaging seems to be a good idea.
Again, Prometheus Operator simplifies things a lot. All we have to do is to create a Kubernetes object of type PrometheusRule:
apiVersionmonitoring.coreos.com/v1kindPrometheusRulemetadata labels appprometheus-operator releaseprometheus-operator namekafka-streamsspec groupsnamekafka-streams.rules rulesalert annotations message"Kafka stream died for {{ $labels.job }}." exprsum(kafka_streams_kafka_metrics_count_count) by (job) / count(kafka_streams_kafka_metrics_count_count) by (job) == 1 for5m labels severitycriticalThe expr field defines the alert trigger. In this example, it will fire if all the kafka_streams_kafka_metrics_count_count metrics for all jobs are completed.
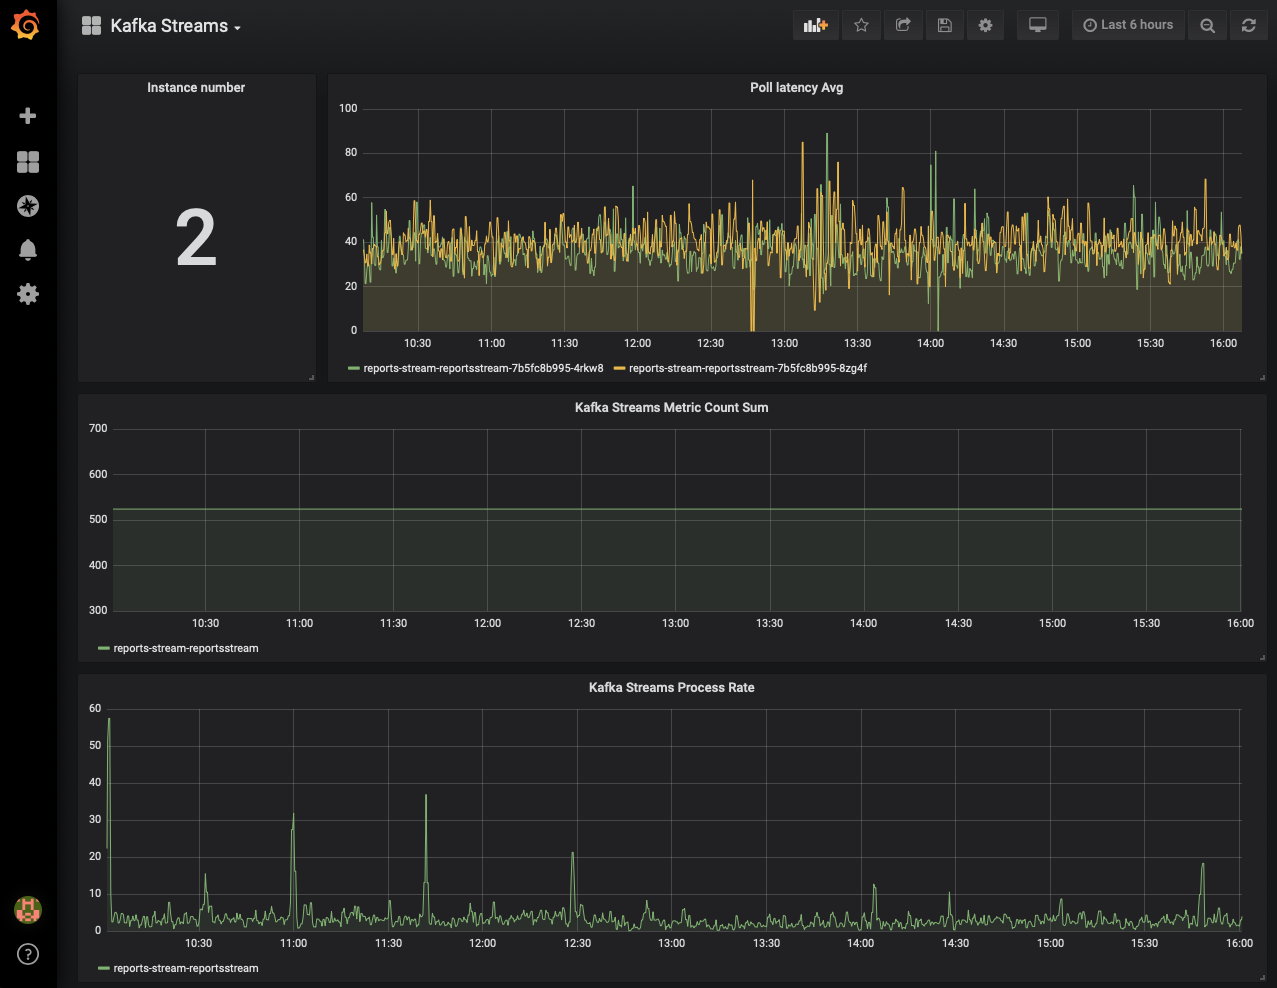
As already said, besides alerts we have the Kafka Streams application metrics in Prometheus and we can visualize them with Grafana:

Have Your Cake and Eat it too
Having both, the metrics as well as a health check, we can keep the self-healing features of a Kubernetes pod and be notified if reviving fails continuously.
When the application dies because of data mismatch, we could be notified after the third attempt, that the app won’t run without our intervention.
Nuff Said
Monitoring Kafka Streams applications turned out not to be trivial. You need to decide, if viewing metrics and possibly defining alerts will satisfy your SLA requirements. In some cases a restart performed in an automated fashion is required and this is where the livenessProbe feature kicks in. Finally, mixing both approaches should provide most confidence in respect of your application’s availability and health.
If you want to take a step forward, have a look at scaling a Kafka Streams application automatically with Kubernetes.
Further Reading
Published at DZone with permission of Jaroslaw Kijanowski. See the original article here.
Opinions expressed by DZone contributors are their own.

Comments