

Writing Logs Into Elastic With NLog, ELK, and .NET 5.0
I'm going to use NLog to write my .NET 5.0 web app logs into Elastic and show you how you can monitor and search your logs with different filters in Kibana.
Join the DZone community and get the full member experience.
Join For FreeIf you are using Microservice-based architecture, one of the challenges is to integrate and monitor application logs from different services and the ability to search on this data based on message string or sources, etc.
So, What Is The ELK Stack?
"ELK" is the acronym for three open source projects: Elasticsearch, Logstash, and Kibana. Elasticsearch is a search and analytics engine. Logstash is a server-side data processing pipeline that ingests data from multiple sources simultaneously, transforms it, and then sends it to a "stash" like Elasticsearch. Kibana lets users visualize data with charts and graphs in Elasticsearch.
On the other hand, NLog is a flexible and free logging platform for various .NET platforms, including the .NET standard. NLog makes it easy to write to several targets. (database, file, console) and change the logging configuration on the fly.
If you combine these two powerful tools, you can get a good and easy way for processing and persisting your application's logs.
In this article, I'm going to use NLog to write my .NET 5.0 web application logs into Elastic. After that, I will show you how you can monitor and search your logs with different filters in Kibana.
Configuration
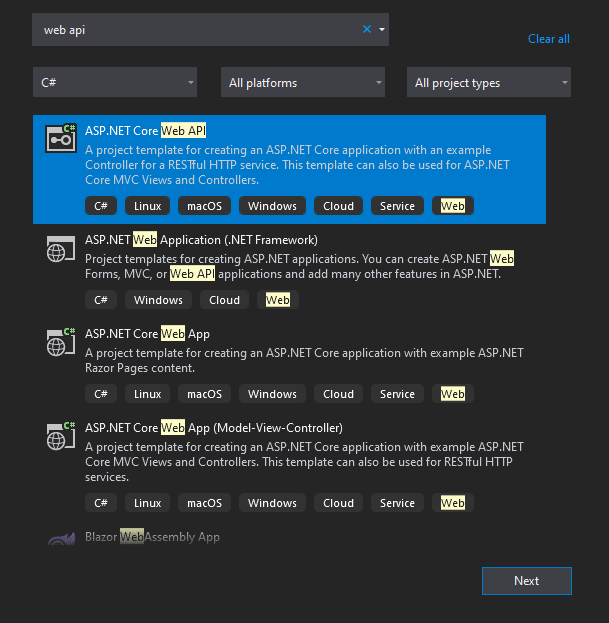
First of all Open Visual Studio and select a new project (ASP.NET Core Web API).

On the next page set the target framework on .NET 5.0(current) and also check Enable OpenAPI support option for using swagger in the project.

We need some Nuget packages. In order to install them, from the Tools menu select Nuget Package Manager and then select Manage Nuget packages for solutions.
In the opened panel search the below packages and install them one by one.
NLog.Web.AspNetCore
NLog.Targets.ElasticSearch

After you installed the packages, you need to add a config file for NLog. In order to add the file, right-click on the current project in the solution and select add => new Item, then add a web configuration file and name it nlog.config.

<?xml version="1.0" encoding="utf-8" ?>
<nlog xmlns="http://www.nlog-project.org/schemas/NLog.xsd"
      xmlns:xsi="http://www.w3.org/2001/XMLSchema-instance"
      autoReload="true">

    <extensions>
        <add assembly="NLog.Web.AspNetCore"/>
        <add assembly="NLog.Targets.ElasticSearch"/>
    </extensions>


    <targets async="true">

        <target name="elastic" xsi:type="ElasticSearch" index=" MyServiceName-${date:format=yyyy.MM.dd}"
                uri="http://localhost:9200"
                layout ="API:MyServiceName|${longdate}|${event-properties:item=EventId_Id}|${uppercase:${level}}|${logger}|${message} ${exception:format=tostring}|url: ${aspnet-request-url}|action: ${aspnet-mvc-action}" >
        </target>

    </targets>

    <rules>
        <logger name="*" minlevel="Debug" writeTo="elastic" />
    </rules>
</nlog>
In the target tag, we define our configuration like Elastic service URI, layout pattern, Elastic index name, etc.
Let’s take a look at these tags and their attributes.
Index: MyServiceName -${date:format=yyyy.MM.dd}: it means we will have a different index for every day’s log. For example, MyServiceName-2021.08.03 related to all the logs of the third of August.
ElasticUri: Elastic URI address.
Layout: your log message pattern, you can determine which information you want to have in the message of your log.
In the rules tag, the minimum level for the writing log is defined.
You can read more detail about nlog tag config here.
After we understand the structure and meaning of the config file, the next step is to set up an NLog logger instead of a .NET built-in logger. To achieve this, open program.cs and change the Main method like this:
var logger = NLogBuilder.ConfigureNLog("nlog.config").GetCurrentClassLogger();
            try
            {
                logger.Debug("init main");
                CreateHostBuilder(args).Build().Run();
            }
            catch (Exception exception)
            {
                logger.Error(exception, "Stopped program because of exception");
                throw;
            }
            finally
            {
                NLog.LogManager.Shutdown();
            }
Change the CreateHostBuilder in program.cs as well:
public static IHostBuilder CreateHostBuilder(string[] args) =>
            Host.CreateDefaultBuilder(args)
                .ConfigureWebHostDefaults(webBuilder =>
                {
                    webBuilder.UseStartup<Startup>();
                })
                .ConfigureLogging(logging =>
                {
                    logging.ClearProviders();
                    logging.SetMinimumLevel(LogLevel.Trace);
                })
                .UseNLog();  // NLog: Setup NLog for Dependency injection
In the next step, open Startup.cs, and in the ConfigureService method add the code below:
services.AddLogging();
Now you are able to write your log into Elastic with injecting ILogger in every class constructor.
[ApiController]
    [Route("[controller]")]
    public class WeatherForecastController : ControllerBase
    {
        private ILogger<WeatherForecastController> _logger;

        public WeatherForecastController(ILogger<WeatherForecastController> logger)
        {
            _logger = logger;
        }

        [HttpGet]
        public IActionResult Get()
        {
            _logger.LogDebug("Debug message");
            _logger.LogTrace("Trace message");
            _logger.LogError("Error message");
            _logger.LogWarning("Warning message");
            _logger.LogCritical("Critical message");
            _logger.LogInformation("Information message");

            return Ok();
        }
    }
From now on, If you run your application and send a request with Postman, all types of logs will be written into Elastic.
Monitoring and Searching Logs
Well, we successfully configured our application to write the logs into Elastic, but how we can monitor and search out logs? For this purpose, Elastic has Kibana as a tool that lets users visualize data with charts and graphs in Elasticsearch.
After you install the Elastic, you can have access to Kibana.

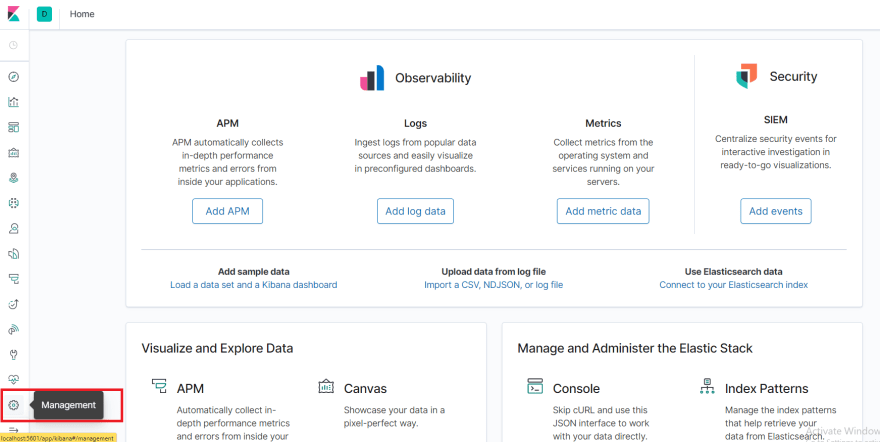
First of all, we should be able to create a pattern in which our application's log will be fetched by that pattern. For doing this, select the Management option in the left panel.

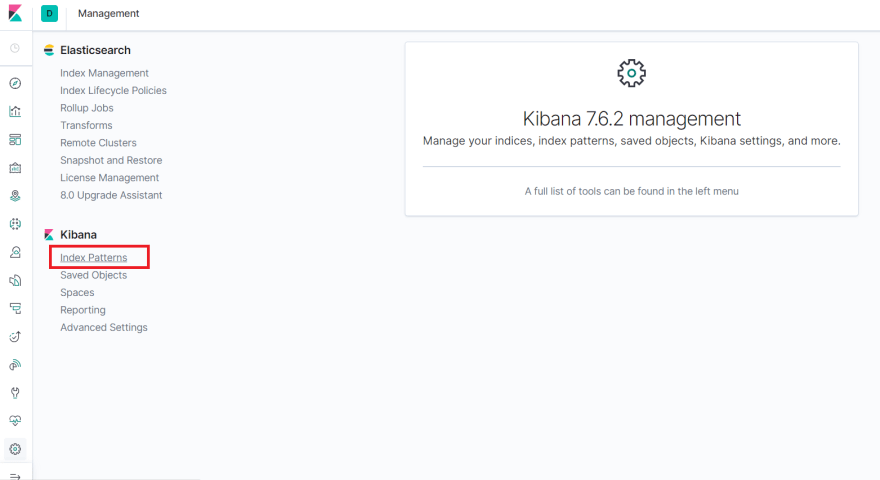
In the management panel select Index Pattern link in the left side

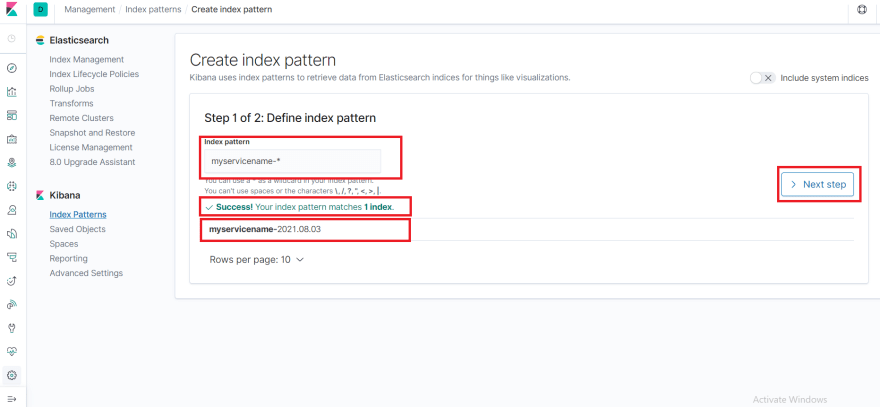
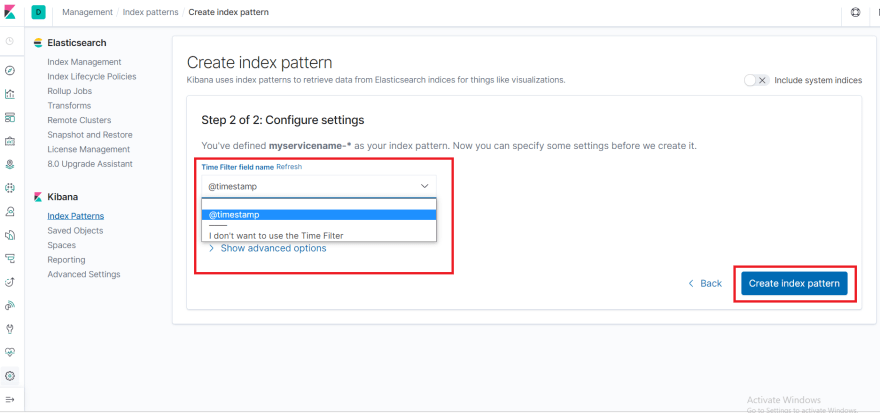
In the shown panel, click on Create index pattern button. You will see Create index pattern panel, there is an Index pattern input box which you should input your Index name(in our example we set the index name in the nlog.config file like this: MyServiceName-${date:format=yyyy.MM.dd}).
If you want your pattern to include wild character instead of the date you should write down myservicename-* in the input (it means we want to create a pattern that is able to load all logs with a prefix of myservicename- ).
If there were any logs with this pattern, a Success message will be shown beneath the input box. You can select the pattern and click on the next step.
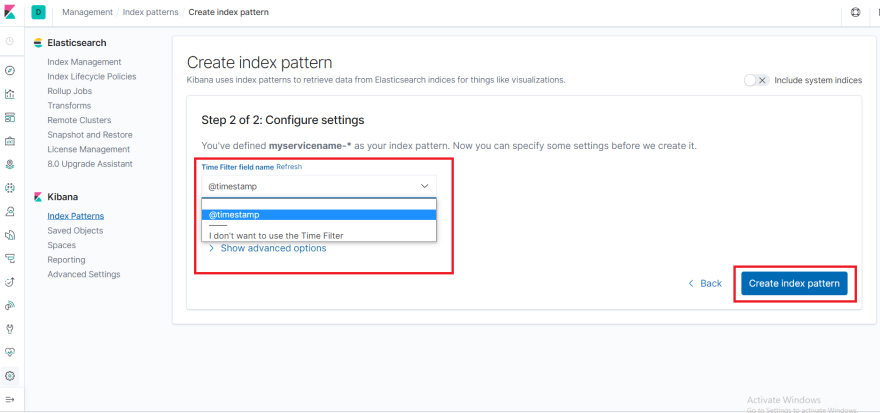
In the next panel, you can add a Time filter to your pattern, which means you will be able to filter logs according to the insertion date. After you selected @timestamp, click on Create index pattern button to complete this process.
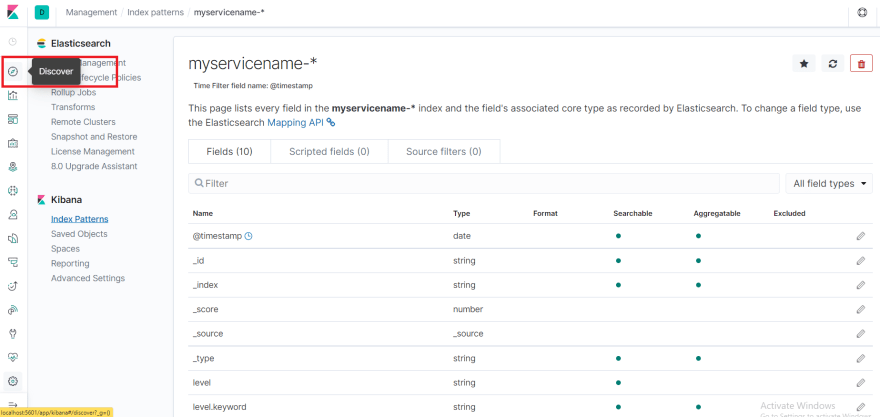
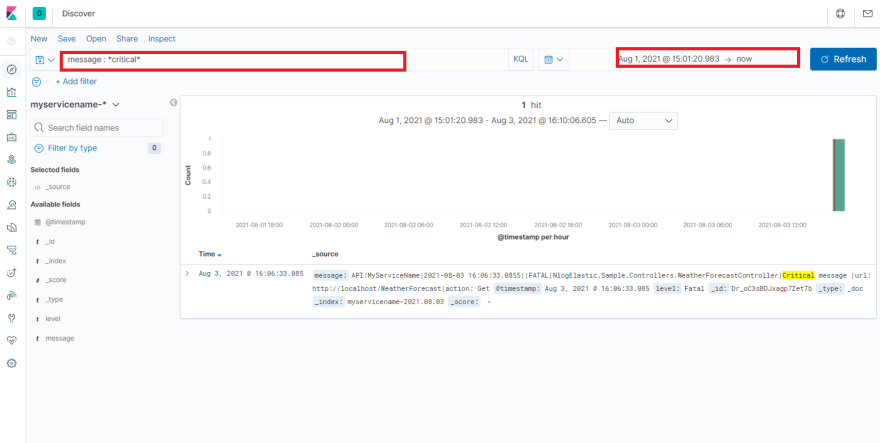
discover
As you see, we have several logs with different types related to our application. If you do not see any log, be sure that you have selected your newly defined pattern on the left side of the dashboard:
 For filtering our logs according to the log message or insertion date you can use the filter bar located beneath the menu bar.
For example, in this picture, I have search logs that contain critical in their log messages.
After you set your filter click on the green update button on the right side.






That’s it. Now you can easily filter your application's logs with different patterns.
Follow me on Medium.
Opinions expressed by DZone contributors are their own.
Comments