Key Takeaways From Integrating a RAG Application With LangSmith
Learn how to integrate LangSmith with a RAG application to trace workflows, debug issues, and analyze performance, token usage, and cost in real-world AI systems.
Join the DZone community and get the full member experience.
Join For FreeIn this article, I am sharing what I learned while integrating a RAG-based application with LangSmith. It covers how the integration works and the key insights gained from using LangSmith for observability and evaluation.
LangChain
LangChain is a framework for building applications powered by large language models in a more structured and modular way. It helps developers connect LLMs with prompts, tools, memory, agents, and external data sources to create more capable applications. In simple terms, LangChain makes it easier to design, manage, and scale complex AI workflows.
LangSmith
What I liked about LangSmith is that it made the internal flow of my application much easier to understand, especially when I wanted to see how each step in the workflow was behaving. It gives clear visibility into prompts, model responses, chains, and agent flows, making it much easier to trace issues, debug failures, and see how an application behaves in real usage. In simple terms, LangSmith acts like an observability layer for AI apps, helping teams monitor performance, improve reliability, and build with more confidence.
What also makes LangSmith especially useful is its support for dataset creation and experimentation. Teams can build and manage datasets from real use cases, then use them to test prompts, compare model responses, and evaluate how an application performs across different scenarios. This makes improvement more systematic, because instead of relying only on trial and error, developers can measure changes and make decisions with much more confidence.
What I Evaluated
As part of the evaluation, I integrated a RAG application with LangSmith to gain better visibility into how the system behaves at each step. I also explored how LangSmith presents tracing information and what kind of details it displays for each run.
Getting Started With LangSmith
To begin using LangSmith, sign up for an account on the LangSmith portal. Once registered, you can access the platform and start setting up your workspace for observability, dataset creation, and experimentation.
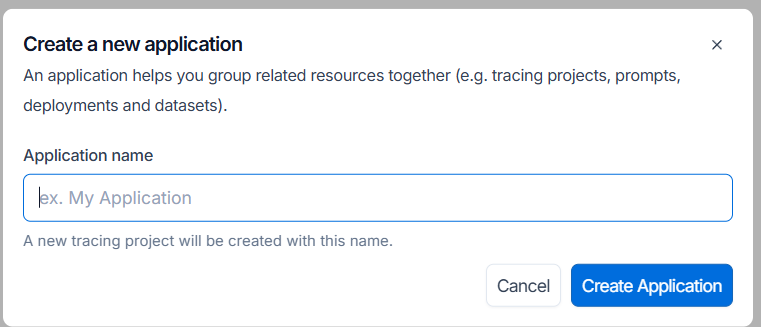
Create an application in LangSmith to keep traces, datasets, and experiments organized in a more structured and manageable way.
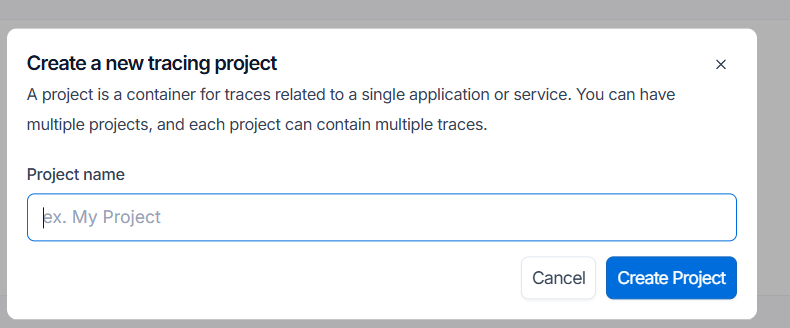
Create a project in LangSmith so that all traces related to a particular application or workflow are grouped in one place. I found this especially useful because it kept the tracing data organized and made it easier to focus on one workflow without mixing it with traces from other projects.
Generate an API key for the LangSmith application, since it is required in the application code to connect with the platform. The API key can be created from the Settings section, which is available through the link at the bottom of the LangSmith portal.
Configure the required LangSmith environment variables in your application by setting LANGSMITH_TRACING_V2, LANGSMITH_API_KEY, and LANGSMITH_PROJECT. This allows the application to enable tracing, authenticate with LangSmith, and associate all observability data with the correct project.
Viewing Trace Data
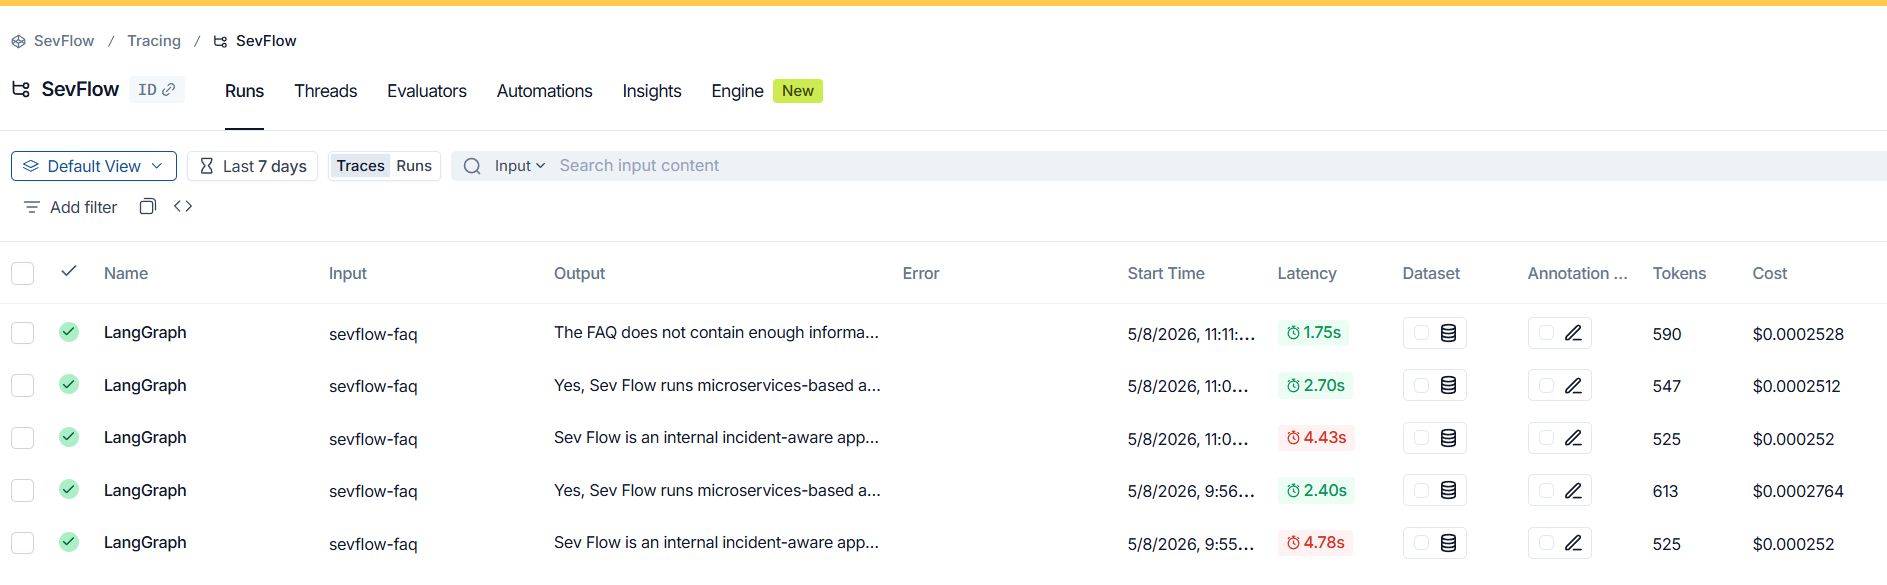
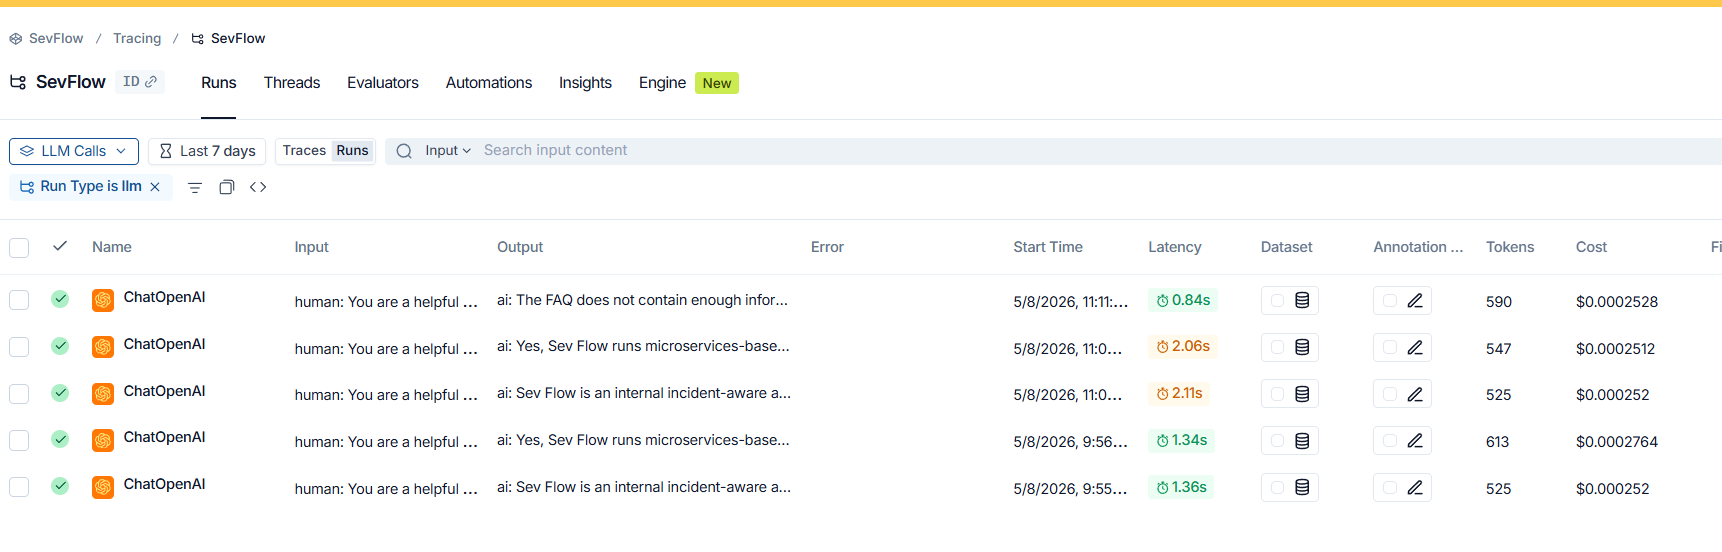
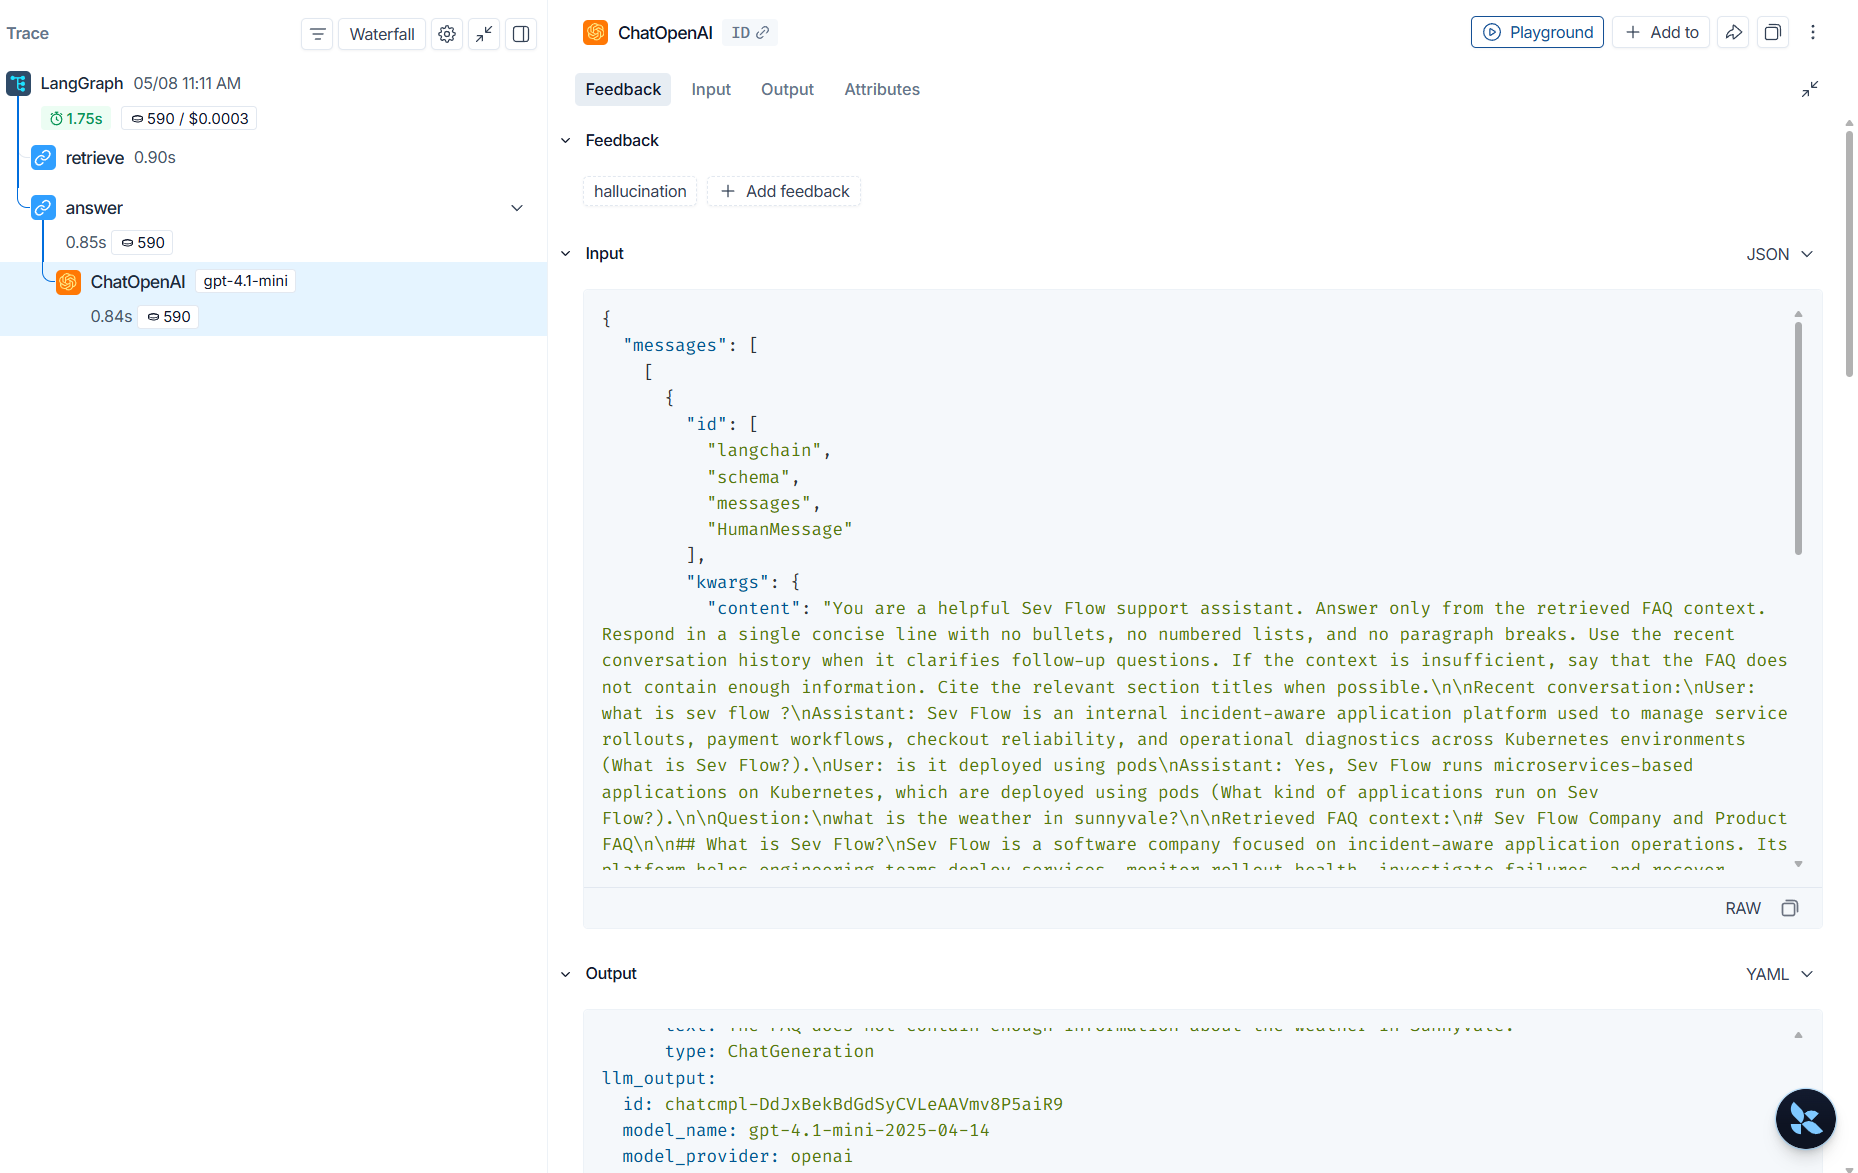
After configuring the required environment variables, run the agent workflow so that tracing data is sent to LangSmith. Once the workflow executes, you can open the newly created project and view the trace details captured for each run, including insights such as latency, token usage, and cost. If you want to focus only on LLM interactions, you can change the default view to LLM Calls from the drop-down menu.
Click on a trace name to view the detailed execution information captured for that run. This includes feedback, inputs, outputs, and additional attributes, helping you understand how the workflow executed and how the model responded at each step.
Attributes and Runtime Metadata
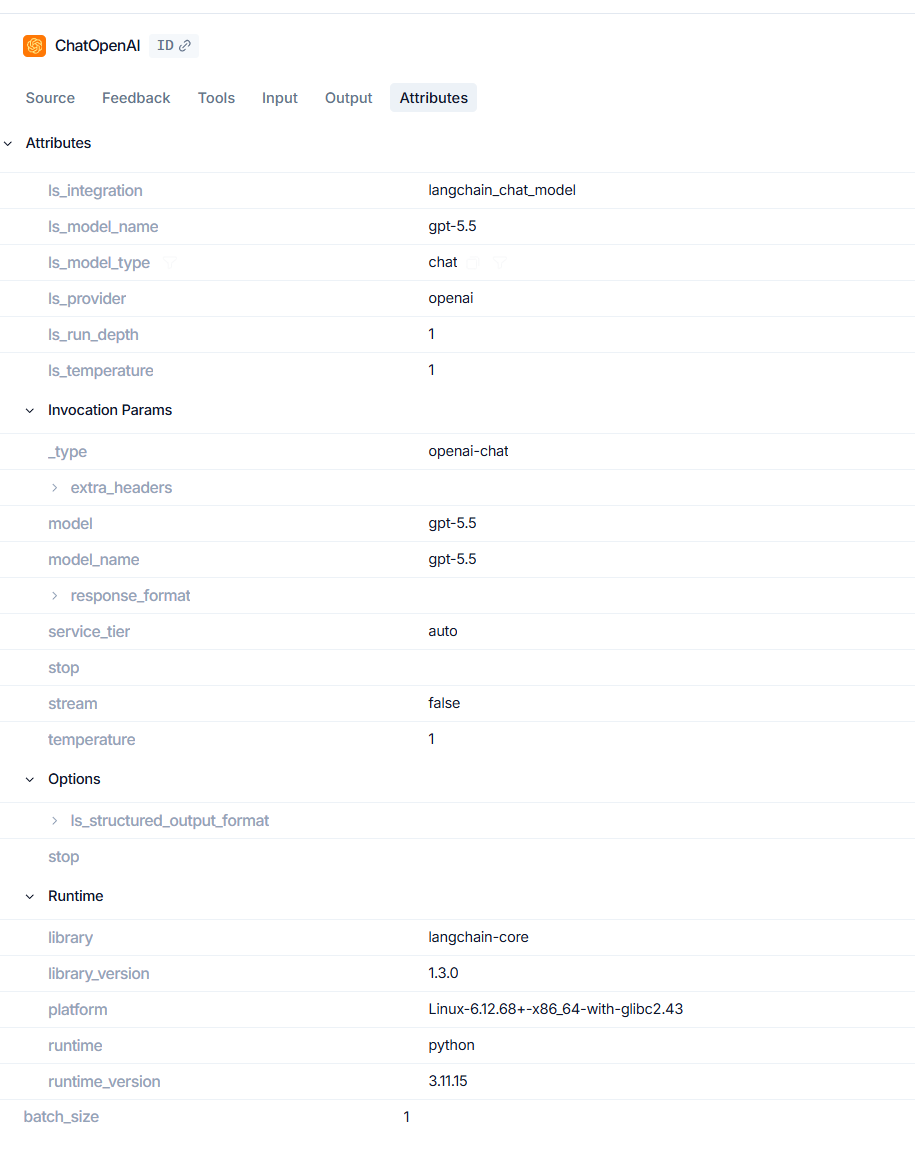
The attributes section provides useful metadata about each run, including details such as the provider, model name, temperature, and LangChain library version. It also captures environment information like the platform version, runtime, and runtime version, which helps provide deeper technical context for every trace.
Threads View
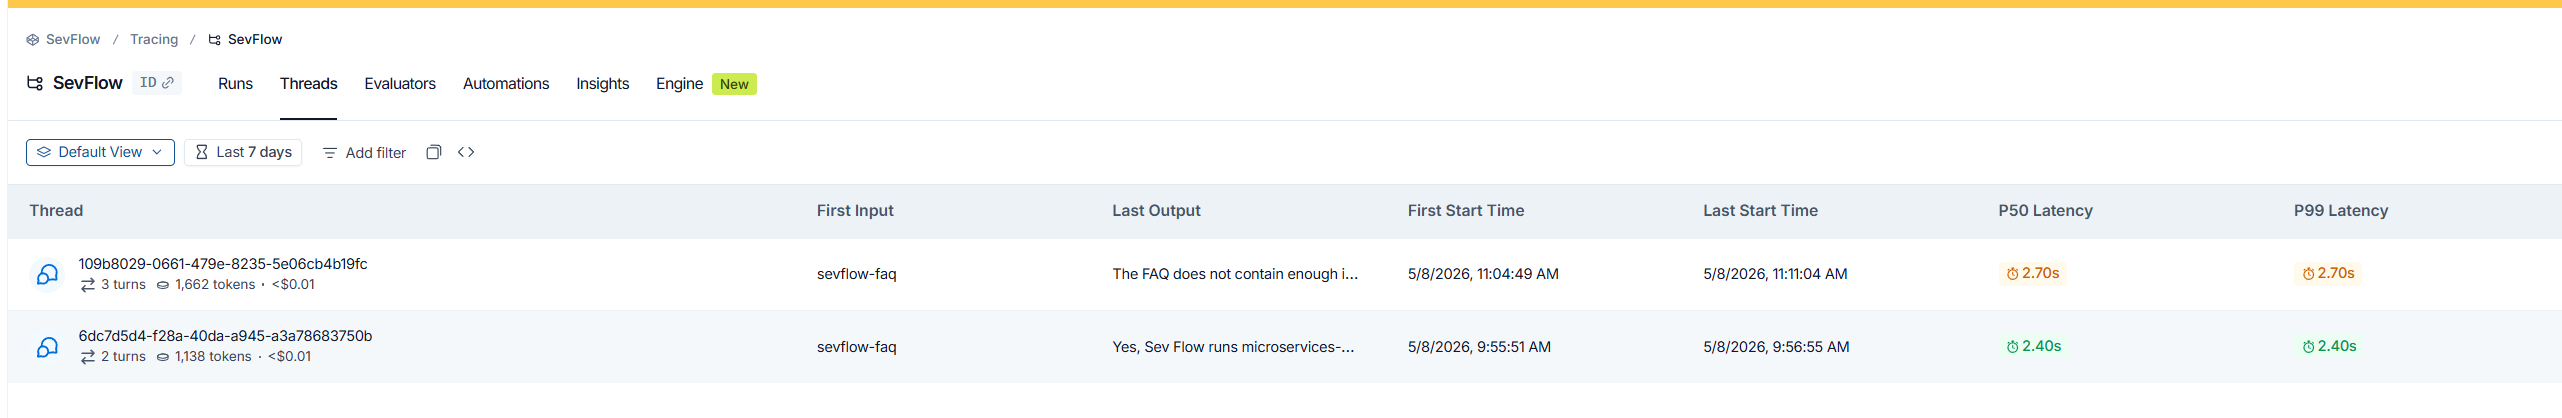
If the application is thread based, the user can explore its activity through the Threads section in LangSmith. Each thread can be viewed separately, which makes it easier to follow the flow of individual conversations or interactions in a more organized way. This is especially useful when the application handles multiple sessions, because it helps isolate the history, behavior, and responses of each thread without confusion.
One of the key advantages is that it gives better clarity during debugging and analysis, making it simpler to understand how a specific conversation progressed over time. I found the Threads view particularly helpful when looking at conversation level behavior.
Cost Breakdown
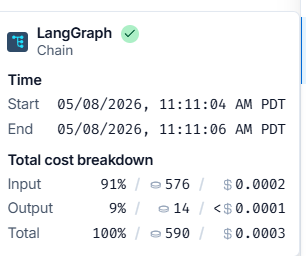
Developers can also view the cost breakdown, which shows the number of tokens used for both input and output. This provides a clearer understanding of how much each run consumes and how that usage affects the overall cost. A key advantage of this feature is that it helps identify expensive prompts, lengthy responses, or inefficient workflows that may be increasing usage unnecessarily.
With this level of visibility, teams can make better optimization decisions to control cost without compromising application quality. The cost breakdown was one of the most practical features for me because it connected model activity directly with usage
Conclusion
Integrating a RAG or agent based application with LangSmith makes it much easier to observe, understand, and improve how the system behaves in real world usage. From tracing workflow execution to analyzing details such as token usage, latency, and overall performance, LangSmith provides a structured way to monitor and evaluate application behavior.
Overall, integrating LangSmith with my RAG application gave me a much clearer view of what was happening behind the scenes. More than just tracing requests, it helped me understand performance, token usage, and the behavior of each run in a way that felt practical and immediately useful.
Disclaimer
The views expressed in this article are my own and do not necessarily reflect the views of my employer.
Opinions expressed by DZone contributors are their own.
Comments