Once you’ve setup your test plan (as outlined above), you’ll probably want to follow a two step process:
- Run a test in the GUI mode with a single/low thread count and listeners added and enabled. This will enable you to check that it’s operating as desired and troubleshoot if necessary.
- Run from the non-GUI command line mode with listeners disabled or removed (as outlined below).
Running JMeter
Running Your First Load Test in Non-GUI Mode
You can run a JMeter test from a single machine or in distributed mode.
Running a Test from a Single Machine
The JMeter GUI is designed for developing and debugging tests, so it’s inadvisable to run a high-volume load test here. Always use the non-GUI command line mode to run the test itself. Here’s the format you should use:
jmeter -n -t /path/to/test_script.jmx -l /path/to/test_results.jtl
Tip: Make sure you disable all listeners when running the tests, as many of them use up a lot of memory. You can open the test_results.jtl file with the listener of your choice after the test ends.
|
COMMAND LINE SHORTCUTS |
|
-n |
Specifies JMeter is to run in non-gui mode |
|
-t |
The name of the JMX file that contains the Test Plan |
|
-l |
The name of JTL file to log the sample results on |
|
-j |
The name of the JMeter run log file |
|
-R |
The list of remote servers (run the test in the specified remote servers) |
|
-H |
The proxy server hostname or IP address |
|
-P |
The proxy server port |
Running a Distributed JMeter Test
Sometimes a single JMeter host doesn’t have enough CPU or RAM to create the required load. In such cases, you have two options:
-
Local Area Network (LAN)-Based Tests
Here you launch JMeter in a clustered mode. In this mode, you have the:
• Master: the system running the JMeter GUI, which controls the test.
• Slave: the system running the JMeter server. This takes commands from the GUI and sends requests to the target system.
• Target: the webserver you’re stress testing.
The master controller initiates the test on multiple slave systems. View the step by step guide here: http://jmeter.apache.org/ usermanual/jmeter_distributed_testing_step_by_step.pdf.
But there are problems with this method; the number of JMeter “Slaves” you have is limited by the number of physical or virtual machines in your intranet. For this reason, many users opt for the unlimited scalability of cloud-based distributed testing.
-
Cloud-Based Tests
If you want unlimited scalability, you need to find a way to run JMeter in the cloud.
The benefits here are that you can run hundreds of load and performance tests in parallel, and at a massive scale, from geographically distributed users.
Although this isn’t offered within JMeter itself, it’s easy to find cloud- testing platforms and companies that enable full integration with the open source tool. Just search for JMeter in the Cloud and see.
Starting the Test
Now you can start load testing! To double-check the slave systems are working, open up JMeter.log in notepad. If it’s working correctly, you should see the following in the log:
Jmeter.engine.RemoteJMeterEngineImpl:Starting backing engine
Logging and Error Messages
All application-level audit entries go into the JMeter log file—the main source of troubleshooting information. To view the log file, go to Options > Log Viewer. You’ll see this in the bottom pane on the main JMeter window. If you’re in GUI mode, you’ll see the number of error messages in the top-right corner. The log file also records information about the test run and can be very useful when determining the cause of an error.
A Typical JMeter Log File

Errors in the JMeter test itself (such as Assertions failures) are shown in the JTL log file. You can also see these in a more user-friendly format in the Listener that you set up (For example: the View Results Tree Listener).
It’s important to set the actions you want JMeter to take if there’s an error. To do this, go to your thread group, and you’ll see an option called “Actions to be taken after a Sampler Error.” Here you can choose to continue with the test, start the next thread loop, stop the thread, stop the test, or stop the test now.
Debugging
You could argue that debugging is one of the most important software development practices. If software doesn’t work immediately upon coding, you need to detect bugs and fix them.
Here are a few useful JMeter debugging methods:
Real Time Sampler/Expression Debugging
Testing an expression with the RegExp Tester (which is in the View Results Tree Listener) shows you that the expression is correct and will work when you run a test. However, sometimes a test will run well with the RegExp Tester but won’t work when you run the actual test. This is usually due to dynamic content.

In such cases, it’s easy to find the problem with the Debug Sampler. Just add the Debug Sampler before View Results Tree and run the test. After the test is completed, open up View Results Tree and select Debug Sampler.

The Debug Sampler has three options:
- JMeter Properties
- JMeter Variables
- System Properties
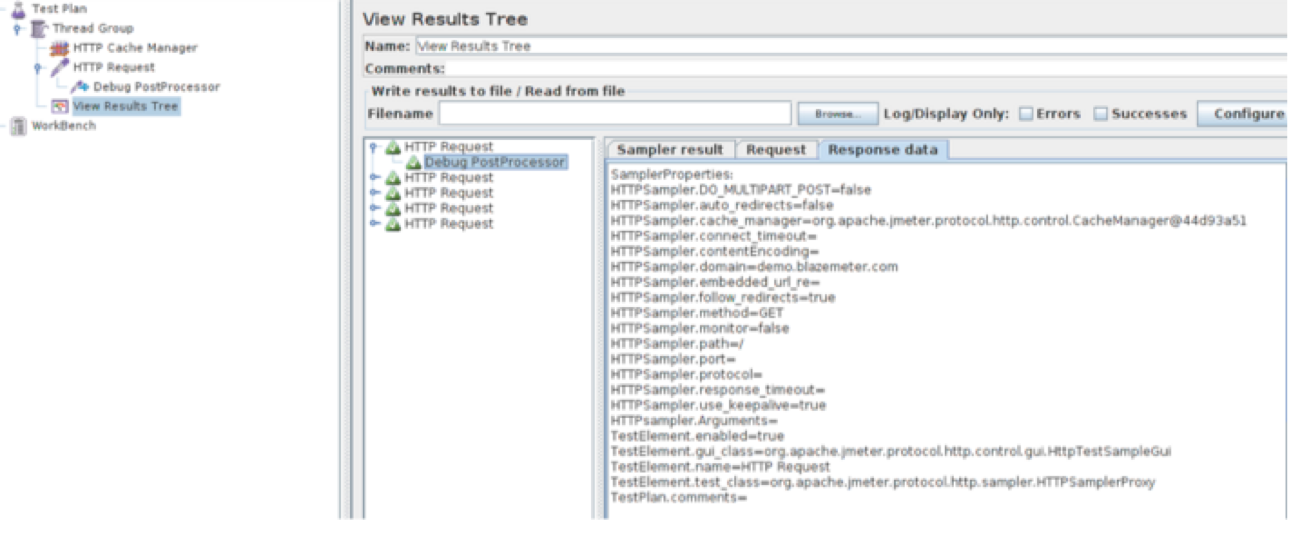
JMeter Variables should be true to debug Post Processors. If you want to debug a sampler, you need to add “Debug PostProcessor” as a child item. This prints sampler properties, which will help you find the actual problem in the sampler.

Debugging With Fake Sampler Generation
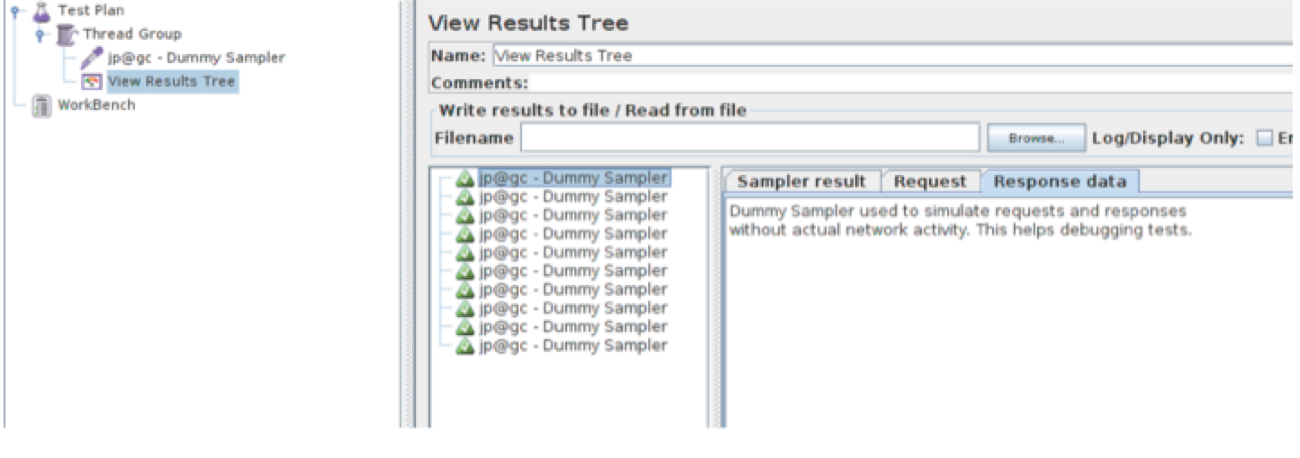
The Dummy Sampler is a plugin that can generate fake samplers with defined values. This sampler is useful when you have very complex scripts, or when running a test will take you too much time. You just need to copy and paste “Response data” into the Dummy Sampler. When you run the test, the Dummy Sampler will generate a sampler with the pasted response data.
Create a new test and add “Thread Group,” “jp@gc - Dummy Sampler,” and “View Results Tree.” Before running it, increase the number of users and run the test.

With this plugin, you can choose to view the latency, response time, response code, and response data—without any network activity.
Debugging JMeter Elements
You can debug all the items in the test tree by printing the debug log. Here’s how:
- Uncomment jmeter.loggerpanel.display=true in the jmeter.properties file. This change will open a log viewer every time JMeter is started.
- In the test tree select any item that you want to see the debug information for.
- Click the Help menu and then Enable debug. Run the test to see the debug information.
- Create a simple test with “HTTP Request” and add “HTTP Cache Manager.” Select HTTP Cache Manager click Help > Enable debug. Click Options > Log Viewer to see the log message. Now change the loop count to three and run a test.

You’ll now be able to see the debug log of the HTTP Cache Manager in the Log Viewer. To disable printing the debug information, select HTTP Cache Manager and click Help > Disable debug.
Configure JMeter
If you want to modify your JMeter properties, you should modify user.properties in the /bin directory. Alternatively, you can create your own copy of jmeter.properties and then specify it in the command line.
Parameterization
It’s vital that your load-testing tool can read dynamic data from external sources. If you’re testing the system with a large number of users, you need to make sure that JMeter can handle different types of external data inputs and pass the extracted data to the virtual users’ threads. Parameterization allows you to run load tests with dynamic data.
Instead of hard-coding certain parameters in the test plan, you can make your JMeter test-data-driven by populating the properties and variables from various sources, including:
- The command-line arguments or properties’ files (e.g. you set the application under test host as “jmeter -Jhost=www.example.com” and access it as “${__P(host,)}” in the HTTP Request samplers)
- The CSV files via the CSV Data Set Config test element of the CSVRead() function
- Arbitrary file types via the FileToString() or StringFromFile() functions
- Databases via JDBC test elements
Correlations
Dynamic data like those mentioned above (and more) often cause problems in your script—even if your app appears to be functioning properly. With JMeter, there are three steps you need to take for each value you need to parameterize:
- Identify the Value. With every request you capture in a JMeter recording, the request parameters are presented clearly in a text box—and they are often labeled something like “auth-token” or their value is a long string of random alphanumeric characters, like “h83ke0d8kgb8xow9cxynb84jSK.”
- Find Out Which Requests Issue the Value. For example: an authentication token is probably issued in the response to the login request. However, it’s not always the immediately preceding request that issues the value. In such cases, take a look at JMeter’s Results Tree to inspect the responses.
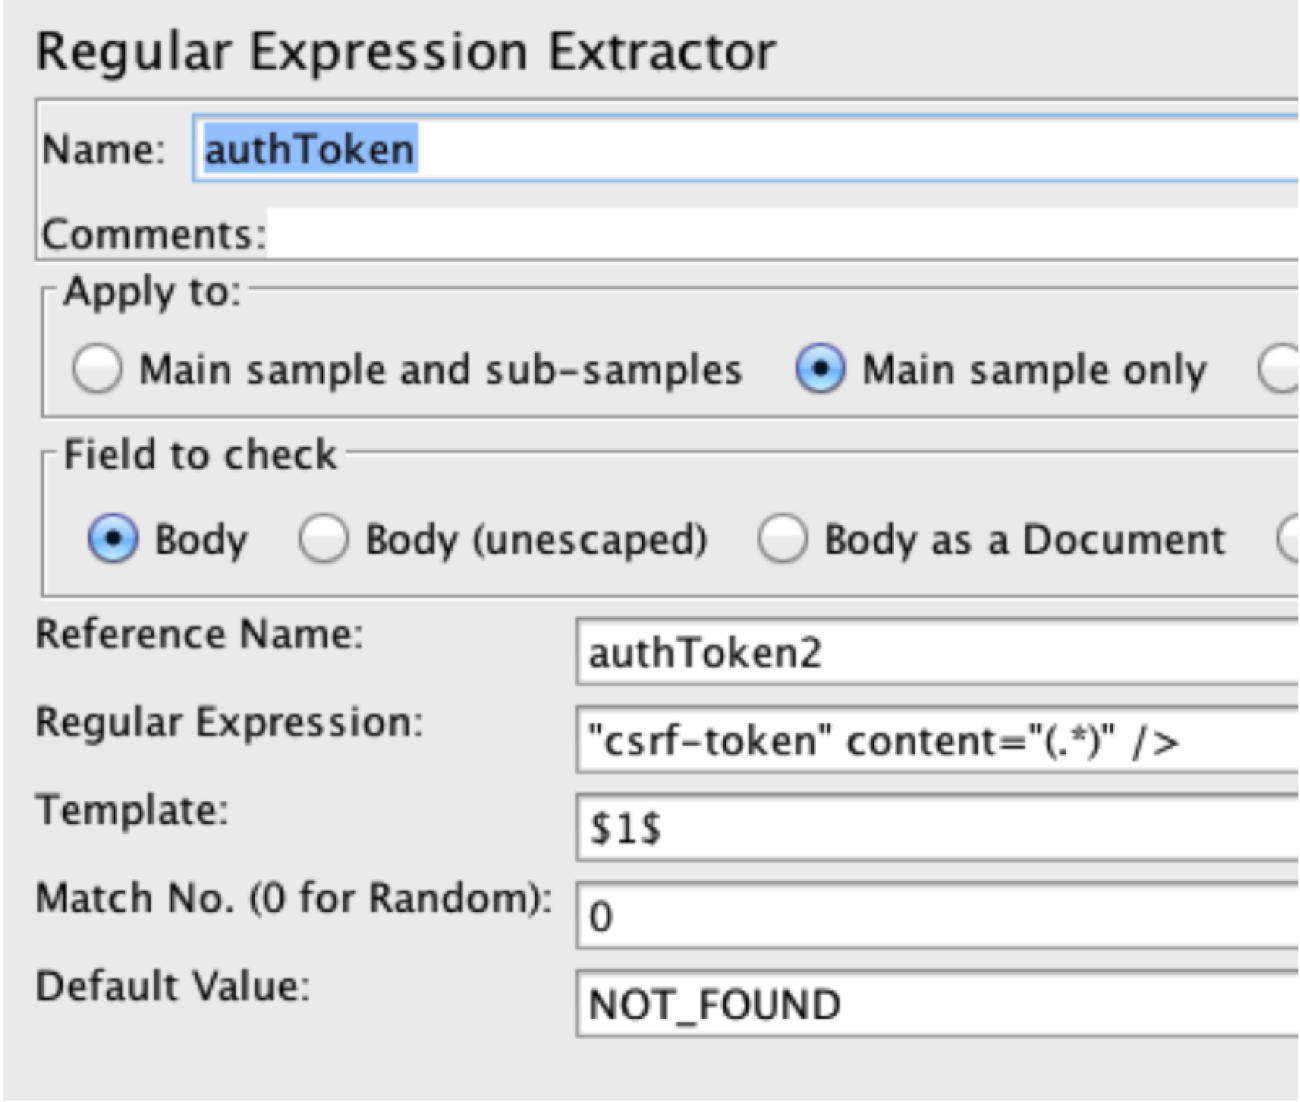
- Use a Regular Expression Extractor with a pattern that matches the expected content. Taking the example above, this might appear in the text as: <auth-token=“h83ke0d8kgb8xow9cxynb84jSK”>, in which case one easy regex would be “auth-token=(.*)”>. The parentheses tell JMeter to retain the value found inside them, and then places that value into the Reference Name you supplied for the extractor, which we may call something like “authenticity_token.”

The JMeter variable format would then be ${authenticity_token}, so you finally go and replace the original captured value wherever it appears in subsequent requests with the variable, and you’re good to go.

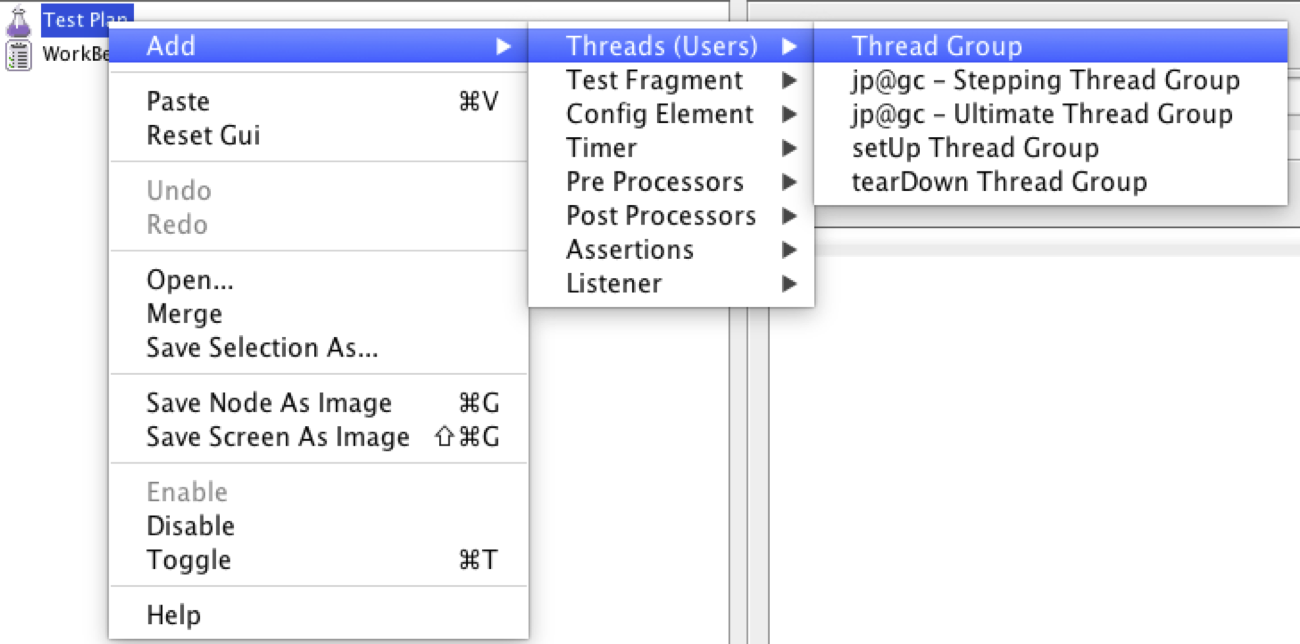
 Note: As a more convenient alternative, you can also use the Recording template. To do this, go to: File > Templates > Recording > Create.