DZone
Thanks for visiting DZone today,
Edit Profile
  • Manage Email Subscriptions
  • How to Post to DZone
  • Article Submission Guidelines
Sign Out View Profile
  • Post an Article
  • Manage My Drafts
Over 2 million developers have joined DZone.
Log In / Join
Refcards Trend Reports Events Over 2 million developers have joined DZone. Join Today! Thanks for visiting DZone today,
Edit Profile Manage Email Subscriptions Moderation Admin Console How to Post to DZone Article Submission Guidelines
View Profile
Sign Out
Refcards
Trend Reports
Events
Zones
Culture and Methodologies Agile Career Development Methodologies Team Management
Data Engineering AI/ML Big Data Data Databases IoT
Software Design and Architecture Cloud Architecture Containers Integration Microservices Performance Security
Coding Frameworks Java JavaScript Languages Tools
Testing, Deployment, and Maintenance Deployment DevOps and CI/CD Maintenance Monitoring and Observability Testing, Tools, and Frameworks
Partner Zones AWS Cloud
by AWS Developer Relations
Culture and Methodologies
Agile Career Development Methodologies Team Management
Data Engineering
AI/ML Big Data Data Databases IoT
Software Design and Architecture
Cloud Architecture Containers Integration Microservices Performance Security
Coding
Frameworks Java JavaScript Languages Tools
Testing, Deployment, and Maintenance
Deployment DevOps and CI/CD Maintenance Monitoring and Observability Testing, Tools, and Frameworks
Partner Zones
AWS Cloud
by AWS Developer Relations
11 Monitoring and Observability Tools for 2023
Learn more
  1. DZone
  2. Refcards
  3. Getting Started With Observability for Distributed Systems
refcard cover
Refcard #369

Getting Started With Observability for Distributed Systems

To net the full benefits of a distributed system, applications' underlying architectures must achieve various company-level objectives including agility, velocity, and speed to market. Implementing a reliable observability strategy, plus the right tools for your specific business requirements, will give teams the insights needed to properly operate and manage their entire distributed ecosystem on an ongoing basis.

This Refcard covers the three pillars of observability — metrics, logs, and traces — and how they not only complement an organization's monitoring efforts but also work together to help profile, interpret, and optimize system-wide performance.

Free PDF for Easy Reference
refcard cover

Written By

author avatar Nicolas Giron
Site Reliability Engineer (SRE), KumoMind
author avatar Hicham Bouissoumer
DevOps, KumoMind
Table of Contents
► What Is a Distributed System? ► What Is Observability? ► How Observability Supports an Entire Organization ► Getting Started With Distributed System Observability ► Conclusion
Section 1

What Is a Distributed System?

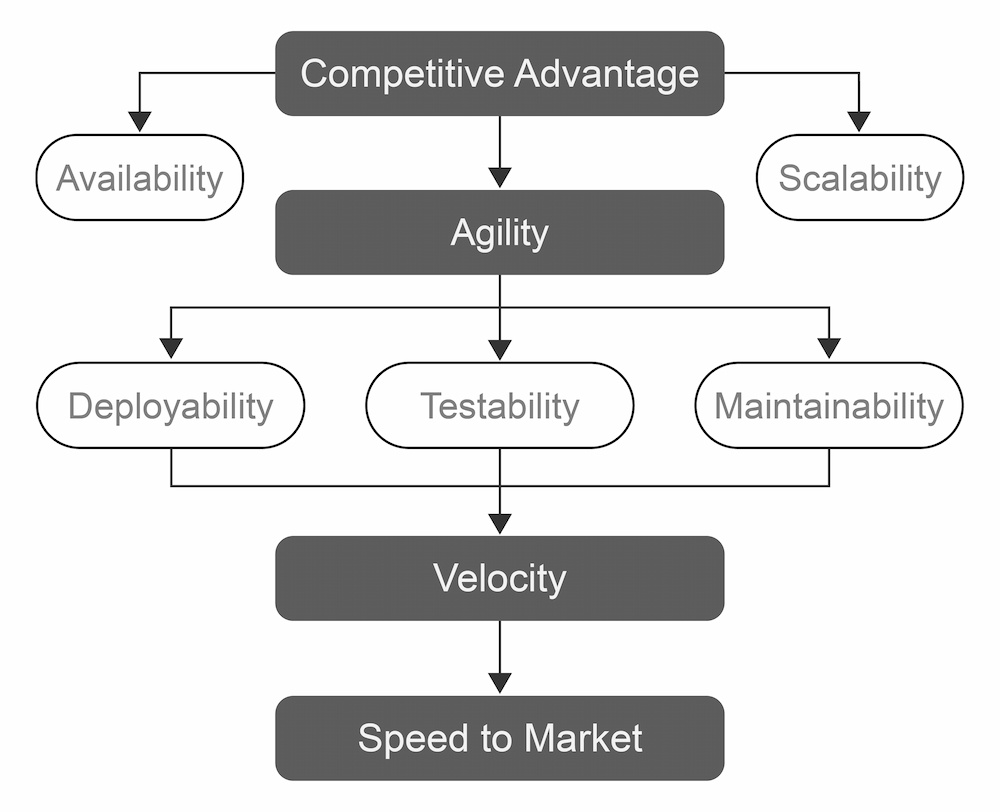
Businesses need to be agile to survive in today’s volatile, ever-changing marketplace, which means their applications' underlying architectures must also be agile. The five key architectural features to support agility, speed to market, and ultimately, competitive advantage in today's market are:

  1. Availability (fault tolerance)
  2. Scalability
  3. Deployability
  4. Testability
  5. Maintainability

To implement these features, companies rely on distributed systems — reliable architectures consisting of numerous components located on multiple servers that communicate and coordinate actions to appear as one coherent system for the end user.

Distributed systems are widely used today — Kubernetes, Apache Spark, and Apache Kafka, for example, are prominent distributed systems used to improve the way resources are consumed to attain the best performance possible. Achieving this is certainly not easy and requires coordination between development and operations teams for proper management and consumption of available resources.

Benefits of a Distributed System

A distributed system can be composed of multiple resources, physical servers, virtual machines, and containers; anything with compute capabilities available on the network can be used to create a cohesive unit consumed by the end user. This kind of architecture, as illustrated in Figure 1, has four global objectives at a company level: competitiveness, agility, velocity, and speed to market.

The competitiveness of an enterprise can be measured according to the level of its product availability. Today, this means an architecture must be capable of scaling to the extent needed to support the product, ultimately, in order to meet both client and end-user demand at all times. Speed to market is the ability to react quickly to change, relying on agility to do it right. Agility is needed in system management as well as in workflows that consume resources to accelerate change. Agility is achieved by integrating flexibility into deployments, tests, and maintenance, which works to improve team performance, thus allowing an increase in velocity.

The design of distributed systems is tailored to meet all these criteria. These systems' high performance and fault tolerance ensures business continuity of service and minimal impact on the end user.

Figure 1: Distributed system advantages at a business level

Disadvantages of a Distributed System

Any distributed system has its disadvantages. By design, a distributed system is spread across multiple resources, which increases the complexity of management at several levels (e.g., automation, installation, upgrade). Indeed, distributed systems are comprised of multiple components based on different lifecycles, using different set of tools and technologies that constantly evolve. Thus, the operations team requires a deep understanding of managing the distributed system to properly operate it in production.

Troubleshooting a distributed system can often be the most complicated phase for both operators and developers, as they must diagnose different systems simultaneously to identify abnormalities. Another disadvantage, though not the least, is the platform's associated costs, including human resources and the time allocated to operationalize it. Plus, the required compute resources can be exponential depending on the use.

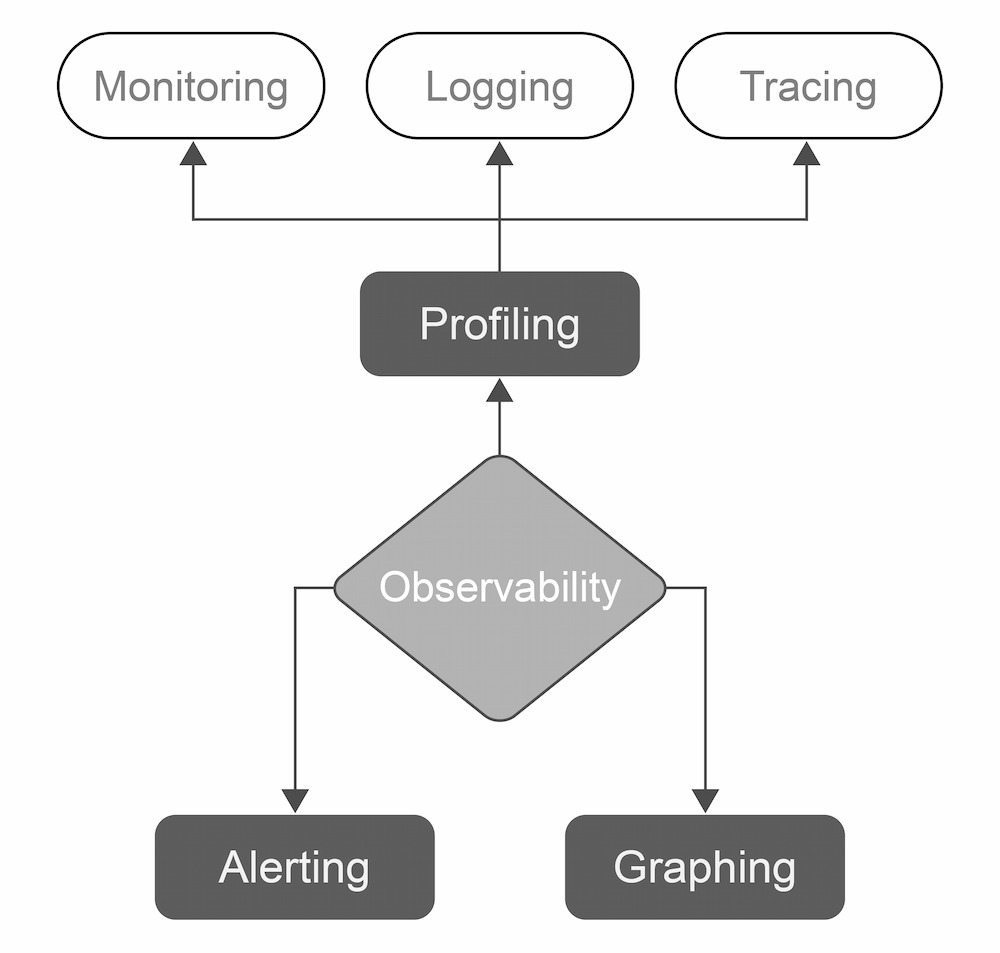
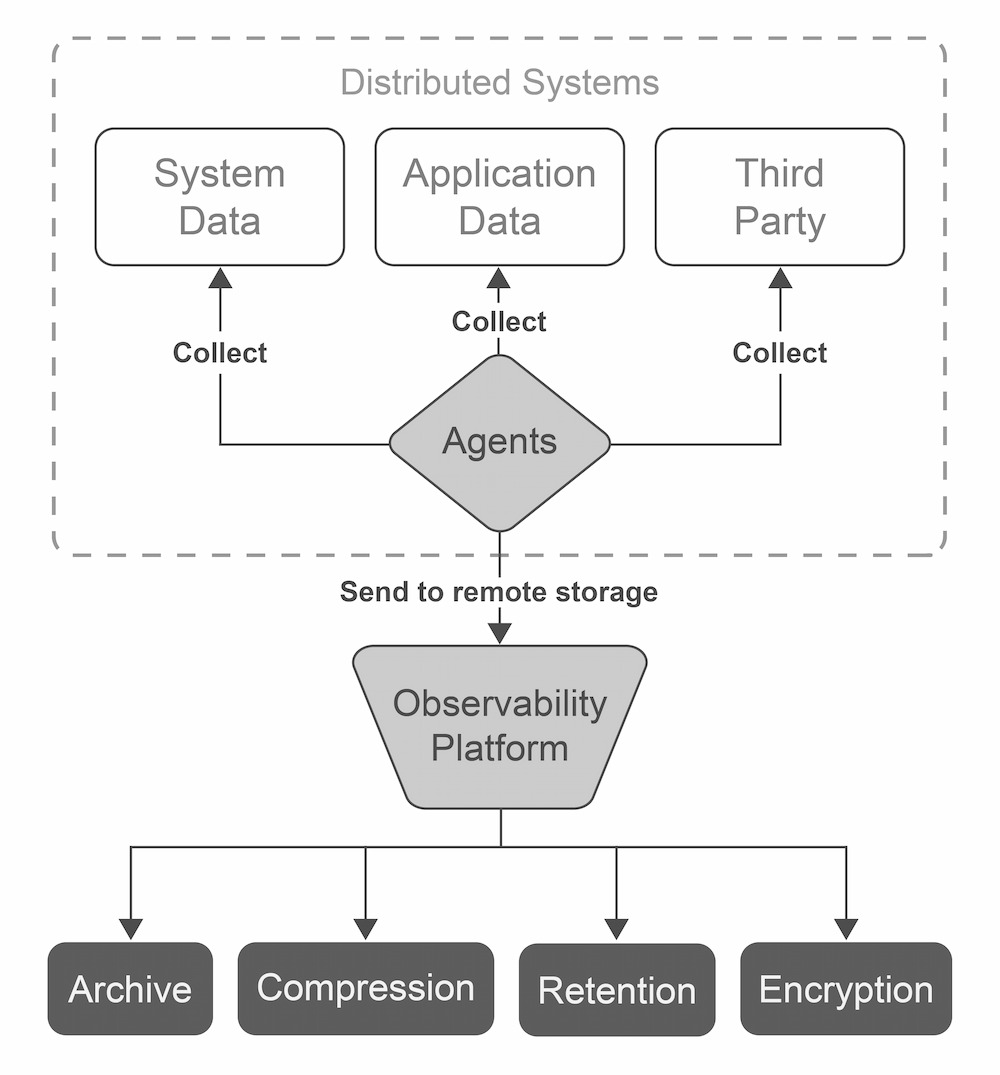
It is, therefore, crucial to have a reliable observability platform in order to quickly access all the data needed for diagnosis and optimization across all areas and at multiple levels of the distributed system.

Section 2

What Is Observability?

The software development industry is evolving rapidly, from system architectures to user expectations. High availability, reliability, and visibility are prerequisites for any company to remain competitive in their respective markets. Relying on legacy systems that only aggregate measurements does not provide the type of visibility needed to quickly identify and correct anomalies. New methods to efficiently find and solve problems are required for limiting downtime and mitigating the risk of negative business impact. Poor user experiences, for example, can result in harm to a company's reputation or loss of prospects — and even loss of existing customers.

Observability is now an essential component of any architecture to effectively manage a system, determine whether it works properly, and decide what needs to be fixed, modified, or improved on any level. The terms "monitoring" and "observability" are often used interchangeably; however, they have distinct meanings and different goals in their applications to a business' use case:

  • A monitoring platform obtains a state from a system based on a predefined set of measurements to detect a known set of problems.
  • Observability aims to measure the understanding of a system's state based on multiple outputs, meaning it is a capability — like reliability, scalability, or security — that must be designed and implemented during the initial system build, coding, and testing.

Like DevSecOps, observability is the responsibility of everyone. It requires appropriate implementation, user integration, and collaboration among organizational teams to facilitate adoption of the platform.

Pillars of Observability

As explained in the previous section, observability complements monitoring based on three pillars: logs, metrics, and traces. Monitoring indicates when the status of any application, system, cloud service, etc. is incorrect while observability indicates why. Monitoring is a subset and a key action for transforming observability from a reactive to proactive approach.

Metrics

Metrics are numerical measurements collected by traditional monitoring systems to represent the system state. Coupled with tags, metrics can be easily grouped, searched, and graphically represented to understand and predict a system’s behavior over time. The measures, by design, have many advantages: This type of data is suitable for storage, processing, compression, and retrieval, making it easier to compact, store, and query data with dashboards that reflect historical trends.

Metrics remain the entry point to any monitoring platform based on the collection of CPU, memory, disk, network measures, etc. And as such, they no longer belong solely to operators — a metric can be created by anyone. For example, a developer may choose to expose an application-specific set of measures such as the number of treatments performed, the time required to complete them, and the status of those treatments. Their objective is to link these data to different levels (system and application) to define an application profile in pursuance of identifying the necessary architecture for the distributed system itself. This results in improved performance, increased reliability, and security system wide.

Metrics used by development teams to identify improvement points in the source code can also be used by operators to determine the architecture needed to support user demand and by the executive team to control and improve the adoption and use of the application by customers.

Logs

Logs are immutable timestamped records of events that happened over time. Logs provide another point of view, in addition to metrics, of what occurred in the application at any given moment. There are three log file formats:

  • Plaintext – Most common format with no specific structure
  • Structured – Most recent format used with a specific structure (e.g., JSON files)
  • Binary – Format used by multiple applications to improve the performance of data management (e.g., MySQL binlog replication, system journal log, Avro)

Logs provide more granular visibility of the actions performed by an application. These are extremely important to development and operations teams, as they often include elements necessary for debugging and optimizing application performance. The complexity of distributed systems often creates various interconnected failures that can be difficult to identify, so diligent log management is essential to guaranteeing optimal service continuity.

Traces

A trace can be seen as a graphical representation of event logs. Distributed tracing tracks and observes service requests flowing through distributed systems by collecting data as the requests go from one service to another. Put simply, traces represent the lifecycle of a request across a distributed system. They are used by multiple teams — for instance:

  • Developers can measure and optimize least performant calls in the code.
  • SREs can identify potential security breaches.
  • DBAs can detect long-running queries that slow down the user experience. 

By analyzing traces, it is possible to measure the overall health of the system, point out bottlenecks, discover and resolve problems faster, and prioritize high-value areas for optimization and improvement. While metrics, logs, and traces serve their own purpose, they all work together to help you better understand the performance and behavior of your distributed systems.

Section 3

How Observability Supports an Entire Organization

One of the main goals of an observability platform is for the whole organization to adopt it. The collection of data is indeed an important element, but without representation or interpretation of this data, observability solutions, unfortunately, can lose value for a majority of the organization. However, there are two primary ways to represent the data an observability platform obtains, in part, for the purposes of demonstrating value through graphs and to receive notifications in case of a malfunction, thanks to alerts.

Graphs

Graphs are one of the simplest methods for representing the meaning of any data collected, allowing everyone in the company to get a global vision in time of the application's performance, status, and reliability. This can range from representation of the distributed system's performance needed by operators and developers to the graphical representation of how users are utilizing the application.

Alerts

Based on the representation of observability data over time, and therefore, of any application profile built by such data, it is possible to identify deviant behaviors across a distributed system. The ability to identify performance issues enables configuration of alerts that, when triggered, allow operators and developers to avoid unforeseen events. Teams can anticipate adverse events and consequently, take a proactive approach to any necessary resolutions. The creation of an observability platform requires a certain level of team maturity, both regarding data collection and data representation/interpretation, to simplify the adoption and use across an organization.

Figure 2: Detailed observability concept

Note: For more details on the pillars of observability, refer to this documentation.

As shown in Figure 2, the concept of observability is ultimately based on five major pillars — three for the collection of fundamental data to establish the profile of an application, and two to facilitate its interpretation.

Section 4

Getting Started With Distributed System Observability

Observability and distributed platforms are two complex concepts. Combining them accentuates the complexity and requires consideration of several important points to truly benefit from this approach. Observability is a key area to prioritize for successfully operationalizing a distributed ecosystem on an ongoing basis. The following table includes a list of considerations for distributed system observability:

Consideration Description
High availability Can you ensure the platform is available 24/7?
Scalability Is the platform scalable while ensuring you don't lose data? Can you use a cloud service? Can you scale it on-premise?
Auto discovery Can the platform automatically discover which endpoints to monitor by connecting, for example, to a service discovery such as Kubernetes or Consul?
Security Is the platform compatible with your security policies? How does it encrypt the data? Can everyone access sensitive data? Is the platform easily auditable?
Distributed storage Can you distribute storage to increase high availability and potentially better manage data retention?
Cost management How much time and money can the company invest in an observability platform and its implementation/management?
Compliance What is required by the company's security compliance measures?
Documentation Is there clear, detailed documentation for users at any level to easily onboard to the observability platform (e.g., application (performance monitoring [APM]), infrastructure, security)?
Usability Can any user easily get started with the tools? For instance, API-based allows automation with a preferred tool (script, Ansible, etc.) and user-friendly code enables smooth collaboration between developers and operators.
Integration Does the platform integrate with external services like Slack, VictorOps, OpsGenie, PagerDuty, and email providers?
Compatibility Is the platform compatible with the company's objectives? Is the solution flexible and modular enough to support those in the next three years?


These considerations highlight one key point: An observability platform cannot be designed by a single team — everyone is responsible for ensuring it respects the company's fundamental requirements, such as compliance and integration, while also ensuring ease of use for operations, development, SRE, and security teams. 

How to Monitor a Distributed System

Automating the collection of metrics from a distributed system is the easiest way to start. These data are crucial in order to identify the first areas of the platform to address, which can range from optimizing resource allocation to the costs related to cloud deployment.

The initial objective is to collect physical data like the use of CPU, memory, disks, and network, then retrieve system data like processes, states, versions, and consumptions. Determining the resource usage of each application component in relation to the sub-system enables you to begin profiling the behavior of the entire distributed system.

A simple method for this process is to:

  1. Deploy an agent on each system to collect necessary data – This agent plays an important role in platform observability and, therefore, must also be monitored to ensure it remains operational and does not consume too many resources as to not impact the most important workload: the distributed system itself.
  2. Centralize the collected data on a remote platform – This solution (e.g., time series database [TSDB]) facilitates the reading and interpretation of data through a graphical visualization tool to generate necessary alerts.

How to Log a Distributed System

Log management is another important step that depends not only on the distributed application but also on the internal management of the company’s logs. Indeed, it is strongly recommended to outline a global log management policy to facilitate the process. This policy must define aspects such as:

  • The logs' format and workflow
  • Their verbosity according to the environment
  • The potential transformations necessary to quickly identify each event

Tag management is crucial for quickly correlating a metric to an event. Therefore, the distributed system itself must be configured to write a specific log format at a specific location by the log management system. A collector, potentially different from the one collecting the metrics, is then responsible for reading each event, transforming them, and centralizing them on an external platform where compression and archiving can be performed if necessary.

Some new generation collectors can also quickly extract metrics from events, which, when done in advance of the need identification phase, reduces the number of iterations and resources required to collect data from the logs.

How to Trace a Distributed System

Tracking begins with the instrumentation of your environment to allow data collection and correlation across the distributed system. Once the data is collected, correlated, and analyzed, you can view metrics such as service dependencies, performance, and any abnormal events (e.g., unusual errors, latency).

Instrumentation can be done at different levels:

  • Add code to an application – enables extraction of the tracking data via an application performance monitoring (APM) tool, which provides end-to-end distributed tracing from front-end devices to back ends like databases.
  • Implement a service mesh – allows automatic deployment of proxies between endpoints to track requests and collect traces.

To make the trace identifiable, a unique identifier must be assigned to every step of the query. This method allows the tracking tool to identify and correlate each step, in the right order, with other information needed to monitor and track performance.

Figure 3: Overview of an observability workflow

Section 5

Conclusion

As explained in this Refcard, being able to have an overview of an ecosystem as well as drill down and analyze issues can be a time-consuming and complex effort, especially in the context of distributed systems. The multiplicity and heterogeneity of system components make monitoring, tracing, logging, and alerting intricate, challenging processes, as each component might have a different lifecycle. In order to net the most value from the observability platform, we need an observability foundation solid enough to enable teams with diverse objectives and motivations across an organization to all get insights into the state of their distributed systems.

Building such an observability platform is not easy, as you need to consider several criteria — from ensuring high availability and scalability to guaranteeing storage capabilities and cost optimization. Security and compliance are crucial prerequisites as well. The pillars of observability offer the opportunity to design distributed systems that meet the requirements of availability (fault tolerance), scalability, deployability, testability, and maintainability, as they empower every single person of a company to understand the systems better.

From technical teams to executive teams, everyone is able to record and extract important, meaningful data that will allow them to make well-informed major decisions for their company's future.

Additional Resources

  • The OpenTelemetry project – https://opentelemetry.io/
  • W3C Trace Context – https://www.w3.org/TR/trace-context/
  • A Thorough Introduction to Distributed Systems – https://www.freecodecamp.org/news/a-thorough-introduction-to-distributed-systems-3b91562c9b3c/
  • Logging Best Practices: The 13 Commandments You Should Know – https://www.sentinelone.com/blog/the-10-commandments-of-logging/
  • Observability mind map – https://coggle.it/diagram/YP6zACqjIAw2-vwa/t/observability

Like This Refcard? Read More From DZone

related article thumbnail

DZone Article

related refcard thumbnail

Free DZone Refcard

ABOUT US

  • About DZone
  • Send feedback
  • Careers
  • Sitemap

ADVERTISE

  • Advertise with DZone

CONTRIBUTE ON DZONE

  • Article Submission Guidelines
  • Become a Contributor
  • Visit the Writers' Zone

LEGAL

  • Terms of Service
  • Privacy Policy

CONTACT US

  • 600 Park Offices Drive
  • Suite 300
  • Durham, NC 27709
  • support@dzone.com
  • +1 (919) 678-0300

Let's be friends:

{{ parent.title || parent.header.title}}

{{ parent.tldr }}

{{ parent.linkDescription }}

{{ parent.urlSource.name }}
by
CORE
· {{ parent.articleDate | date:'MMM. dd, yyyy' }} {{ parent.linkDate | date:'MMM. dd, yyyy' }}
Tweet
{{ parent.views }} ViewsClicks
  • Edit
  • Delete
  • {{ parent.isLocked ? 'Enable' : 'Disable' }} comments
  • {{ parent.isLimited ? 'Remove comment limits' : 'Enable moderated comments' }}