DZone
Thanks for visiting DZone today,
Edit Profile
  • Manage Email Subscriptions
  • How to Post to DZone
  • Article Submission Guidelines
Sign Out View Profile
  • Post an Article
  • Manage My Drafts
Over 2 million developers have joined DZone.
Log In / Join
Please enter at least three characters to search
Refcards Trend Reports
Events Video Library
Refcards
Trend Reports

Events

View Events Video Library

Zones

Culture and Methodologies Agile Career Development Methodologies Team Management
Data Engineering AI/ML Big Data Data Databases IoT
Software Design and Architecture Cloud Architecture Containers Integration Microservices Performance Security
Coding Frameworks Java JavaScript Languages Tools
Testing, Deployment, and Maintenance Deployment DevOps and CI/CD Maintenance Monitoring and Observability Testing, Tools, and Frameworks
Culture and Methodologies
Agile Career Development Methodologies Team Management
Data Engineering
AI/ML Big Data Data Databases IoT
Software Design and Architecture
Cloud Architecture Containers Integration Microservices Performance Security
Coding
Frameworks Java JavaScript Languages Tools
Testing, Deployment, and Maintenance
Deployment DevOps and CI/CD Maintenance Monitoring and Observability Testing, Tools, and Frameworks

Last call! Secure your stack and shape the future! Help dev teams across the globe navigate their software supply chain security challenges.

Modernize your data layer. Learn how to design cloud-native database architectures to meet the evolving demands of AI and GenAI workloads.

Releasing software shouldn't be stressful or risky. Learn how to leverage progressive delivery techniques to ensure safer deployments.

Avoid machine learning mistakes and boost model performance! Discover key ML patterns, anti-patterns, data strategies, and more.

  1. DZone
  2. Refcards
  3. Getting Started With Real User Monitoring
refcard cover
Refcard #220

Getting Started With Real User Monitoring

Monitor Website Performance Based on Real User Data

Teaches you how to use new web standards—like W3C’s Beacon API—to see how your site is performing for actual users, letting you better understand how to improve overall user experience.

Download Refcard
Free PDF for Easy Reference
refcard cover

Written By

author avatar Dan Boutin
Vice President of Performance Strategy, Blue Triangle Technologies
Table of Contents
► Introduction ► Background ► Enter Real User Monitoring ► What's a beacon? ► How do I get started? ► Marketing 101: RUM and Marketing A/B Campaigns ► Use RUM Data to Provide Real End-User Times During Performance Tests ► Use RUM Data as Your Method of Proper Performance Test Case Generation ► Common Test Focus Areas ► Use RUM as Your Leverage With Marketing and Development ► Conclusion
Section 1

Introduction

Real User Monitoring (RUM), also known as Real User Measurement, is all the rage these days. However, not everyone realizes how easy it is to “install” and start gathering data, or how many different uses and metrics you can get from the data you receive from RUM.

We’ll start by looking in the past...

Section 2

Background

Website performance monitoring has evolved over time to help site owners manage increasingly more complex and challenging site designs and business goals.

The first web performance monitoring solutions focused primarily on availability. In the days when the Internet itself was not as reliable as it is today, site owners needed to know if their customers could actually get to their sites at all and alert them if their ISP—or some other critical component in their service offering—was failing. Soon, site owners demanded more, and the first external site performance monitoring offerings began to appear on the market.

These “synthetic” web measurements, as they came to be known, were taken from servers located in a handful of places on the Internet, which robotically requested specific web pages at regular intervals. These early approaches did not use real web browsers, did not execute scripts on the pages, did not track user states, and did not step through user journeys on a site. As synthetic web measurement technologies improved, some of these limitations were overcome. Test services began to use real browsers, and allowed a user to script a multi-step journey. Test measurements could be run on a variety of network connection types and even on real mobile devices.

However, even with these improvements, synthetic website monitoring could not give a complete picture of web performance. Measurements were taken from a small sample of locations that did not reflect the real variety of visitors in small and medium markets. The choice of network connections was also limited, especially on mobile smartphone measurements. Entire countries might not have probes from which to take measurements at all. Often, only one or two browsers were available to use for measuring, and they might not have been the most popular versions of those browsers. Some pages, such as purchase confirmation pages, might have been unreachable in a synthetic script, and the vast majority of pages on a site might never have been included in a measurement script at all.

How much better it would be if the site could arrange for its visitors to report their own user experience rather than relying on simulated users doing the same canned user journeys over and over?

Section 3

Enter Real User Monitoring

Actually, why couldn’t the users’ browsers self-report how long a page takes to load? The browsers have standard timing events that fire during page loads, and JavaScript can access the details about those events. Why not have some JavaScript running on each page that collects timing information and sends it back to a central data repository? Out of these observations, Real User Monitoring (RUM) was born.

Unlike synthetic monitoring, a RUM measurement strategy collects and reports on real user experiences by directly examining the time it takes pages to load in the real user’s own web browser. The first RUM implementations collected only page load times, but as interest in this approach grew, the W3C developed new standards for web browsers to give developers more details about the performance of real web page visits. (More on the W3C group below.) New APIs like Navigation Timing and Resource Timing have standardized the kinds of performance data used by the industry across most modern browsers. Efforts to standardize the way that the JavaScript used for RUM loads on a webpage, to prevent it from blocking or delaying any critical page content, gave site developer’s confidence to use this new measurement approach.

By using real user performance data rather than synthetic website measurement data, website owners gain very comprehensive insights into their users’ experience. Data comes in from all kinds of browsers, locations, network connections, and device types. The challenge is how to cope with the massive quantity of data. With millions or billions of page views a month, how do you make sense out of the performance data? How do you correlate performance data into business objectives and outcomes?

First, let’s dig into the basics.

Section 4

What's a beacon?

The simple definition of a beacon is that it is an HTTP(S) request with a ton of data included, either as HTTP headers or as part of the request’s query string. Within the web performance community, this data is commonly called RUM or Real User Measurement data because it involves measuring the experience of real users.

Beacons are actually defined by a joint working group called the Web Performance Working Group, which is part of the Rich Web Client Activity. The website at www.w3.org/TR/beacon/ is dedicated to this effort. The mission of the working group is to “provide methods to measure aspects of application performance of user agent features and APIs.”

Note: the Co-Chairs of the Working Group are Ilya Grigorik and Todd Reifsteck. The W3C Team Contact for the Web Performance Working Group is Philippe Le Hégaret.

To quote from the W3C Beacon Working Draft referenced earlier:


The Beacon specification defines an interface that web developers can use to asynchronously transfer small HTTP data from the User Agent to a web server.

The specification addresses the needs of analytics and diagnostics code that typically attempt to send data to a web server prior to the unloading of the document. Sending the data any sooner may result in a missed opportunity to gather data. However, ensuring that the data has been sent during the unloading of a document is something that has traditionally been difficult for developers.

The bottom line is: a user beacon allows web applications to access timing information related to navigation and elements. More information can be found here: www.w3.org/TR/navigation-timing/#process.

The Beacon also gathers data related to Resource Timing (www.w3.org/TR/resource-timing/). This information contains data about a page’s performance, including URL, initiating element, start time, duration, etc.

Image title

Image title

Some other common information that can be found in a beacon:

Base Request Objects

Timestamp

The EPOCH timestamp of the beacon in milliseconds

URL

The page URL from which the beacon originated

Page Group

The name of the page group in use

User Agent Objects

User Agent Family

The user agent family (e.g. browser): Chrome, IE, Firefox, Safari, etc.

User Agent OS

The operating system (OS) of the user agent: Windows, Mac OS X, etc.

Raw User Agent

The raw user agent passed in the HTTP header

Geographic Objects

Latitude

The latitude of the beacon's geolocation

Longitude

The longitude of the beacon's geolocation

City

The nearest city to the beacon's geolocation

Timers

Request Time

The time from the request start to the first byte (i.e. backend load time)

Response Time

The time from the first byte to onload (i.e. frontend load time)

Load Time

The full page load time, which starts when the user shows an intent of loading a page, and ends when the page has completed loading. It should always be the case that:

Request time + response time = load time

Common Parameters

Full URL

The full page URL from which the beacon originated. This field will have more information than the plain URL field.

Referrer

The page URL that set the start time of the beacon (e.g. the referrer from the last navigation)

DOM Size

The size of the data in the DOM, in bytes

Session Related

Session ID

The session ID or token string

Session Start Time

The EPOCH start timestamp, indicating the start of the session

Latest Session Timestamp

The EPOCH latest timestamp for the given beacon

Once you’ve got the hang of beacons, read on...

Section 5

How do I get started?

Let’s borrow a little RUM 101 from my SOASTA colleague, Cliff Crocker:

Image title

So, what does this JavaScript instrumentation look like, and how can I start collecting beacons? Let’s assume you want to take the open source route and do it yourself.

Meet Boomerang: www.lognormal.com/boomerang/doc/. When possible, Boomerang utilizes the NavigationTiming and ResourceTiming, which I discussed earlier, to relay accurate performance metrics about the page load, such as the timings of DNS, TCP, SSL, and the HTTP response.

The Boomerang JavaScript snippet would just be placed into the header of the web page that you wish to tag. If you are using a commercial product, there are many short “how- to” videos on YouTube that can walk you through the different tagging methods available to you, from the simple JavaScript snippet, to tagging when using a TagMan solution such as Tealium, Signal, or Google Analytics.

You can find some of these videos in a blog post that I wrote around describing how to get started with RUM, “The Performance Beacon,” here: www.soasta.com/blog/ performance-monitoring-4-videos/.

Now that you have turned on the beacons and commenced monitoring and measuring, let’s look at the many value- added activities and analytics that you can do around the data that you are collecting, and how you can use this newly found treasure trove of data to change the way you look at your overall business. That change, originating from RUM and heading towards a focus on user experience, will, ultimately, improve customer experience and satisfaction.

Section 6

Marketing 101: RUM and Marketing A/B Campaigns

A/B testing is a great way to compare two (or more) versions of your site to see if one is more popular with users than another. Perhaps you'd like to test out new CDN providers, a different page layout, or new performance tricks. A RUM capability to be able to handle A/B test integration allows you to compare your tests for performance. You can do this with some RUM solutions (and Boomerang). This will allow you to tag the RUM code with the name of the currently running test so you can report on each test separately.

There are two steps to using A/B Tests:

  1. Define a Test Name in your page.
  2. Define a JavaScript variable on your page that contains the name of a page group. This variable name may be namespaced. For example, use ab_test or RUM.ab_test.
1
RUM = {}; // don't use var to ensure it's global RUM.ab_test = "test name"
2
RUM.ab_test = "test name"

Add the test variable name to the RUM Domain. Click OK after making any change.

Section 7

Use RUM Data to Provide Real End-User Times During Performance Tests

During performance testing in production, you can use RUM to be able to see end-user request performance, but why not bring that information into your test suite as the test is running—in the form of “super-imposed” end-user experience data, layered on-top of your server requests.

The concept here is this: while performance test transactions are being submitted and received in production, superimpose the experience information of real users interacting with the system (with those same server requests) on-top of the performance test transaction or request/response times. This will allow you to see “relative”—but actual— end-user response times for that transaction.

Customers often ask what the actual end-user response time is—but since many performance test tools are “headless”—i.e., there is no browser—we can only say that it is the transaction response time + some browser time. RUM has that time and is collecting it from real users during the performance test.

One caveat is that performance testing is often done “after hours,” and real users may not be very active. Because you would have the historic Real User Data in the RUM data stores, the “glue” part of this could look for those end-user experiences under similar load conditions during normal business hours.

Section 8

Use RUM Data as Your Method of Proper Performance Test Case Generation

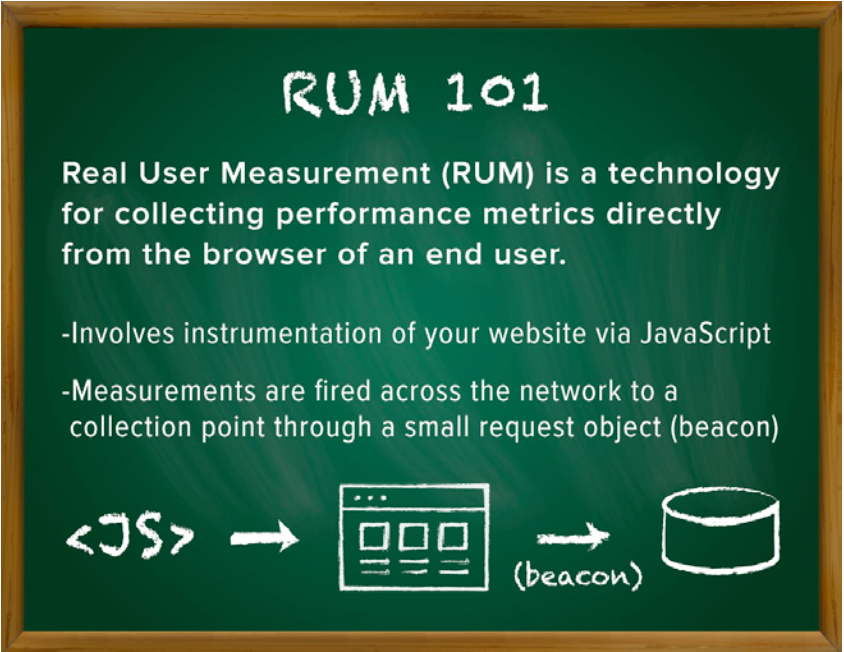
Since the dawn of performance testing, script generation has always been an inexact science. A guessing game. No one really knew how their real users, or even more importantly, their real customers, were using their website or mobile application. But with the advent of RUM, that has all changed. The user experience, or UX, is now at the forefront of performance testing best practices. Why? Using RUM to develop test cases gives you more confidence to know that the tests you are running accurately reflect the way your user community is actually using your website or mobile application.

Let’s walk through a real-world example from a retail site having performance issues on an almost weekly basis— and the same time period every week—despite running performance tests nightly in numerous portions of the development and testing lifecycle (e.g. Dev => Test => QA) and in various scenarios both behind the firewall and in production from the cloud. In addition, performance tests were being executed at over 150% of the current peak user volume across the site on a release-by-release basis. But still, performance was a problem, from a minimum of a dramatic drop in page load time all the way to—and including—site outages and crashes, complete with the obvious hits to the bottom line: revenue.

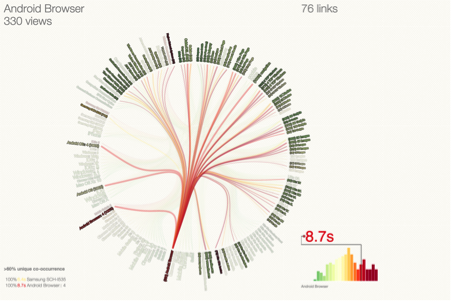
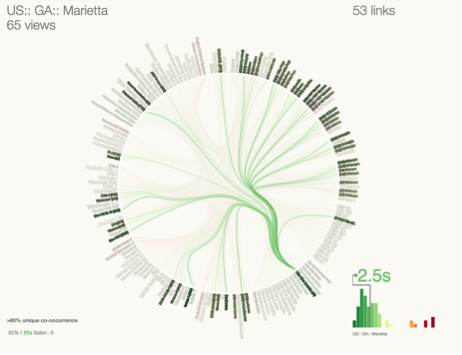
In our example, our analysis of RUM yielded a piece of data in particular that just jumped out at the whole team. The real users had a pattern of visiting the site that we had not taken into account in all of the performance testing. In the visualization below, there was a clear click-to-conversion path.

Image title

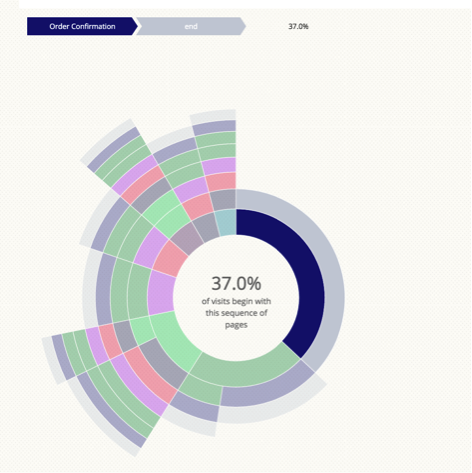
As shown in the previous image, 37% of visits to this retailer’s website started with a visit to the order confirmation page. Let that sink in for a minute—37% of the users started their visit with “order confirmation” and then hit “submit”. No product searches. No adding items to the cart. They had already completed those steps. How does this make sense? Simple.

Enter marketing.

It turns out, this makes perfect sense. Why? Let’s turn our gaze onto our friends over in the marketing organization. It seems that they run a discount promotion on Facebook every Sunday. Every Sunday around noon, marketing puts up the “sale of the week” coupon for “now you see it, now you don’t” discounts. The coupon is good the coming Friday, from 8 AM EDT until noon EDT. Discounts start at 40%, and drop by 10% every hour until everything goes back to normal retail pricing at noon EDT. (So, in this sale, from 8:00–8:59, the discount coupon is good for 40% off retail pricing; from 9:00–9:59, the discount coupon is good for 30% off retail pricing, and so on—you get the idea.)

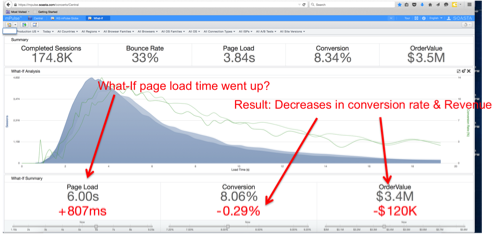
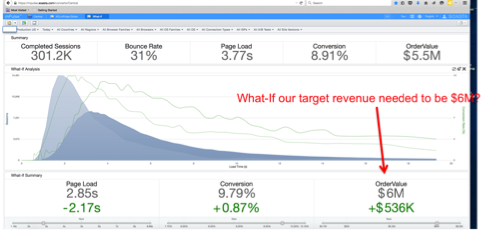
Fast forward to Friday at 8 AM. This just happens to be the time period that all the performance drop-offs and outages were happening. See why? Marketing and the IT Operations/Performance Teams were not in alignment. In fact, IT had no idea that social media was being used for sales and marketing campaigns! (That in itself is astonishing!) So, once we were able to gather and analyze this data, the QA teams generated test cases around these new use cases and tested accordingly. And, not surprisingly, several issues were found and fixed.

This never caused another problem again. The two teams—marketing and IT, are now in alignment on every campaign, and user information is utilized to ensure that every possible test path is covered and testing to its peak.

Section 9

Common Test Focus Areas

Now that we’ve used RUM to show its importance with application test script creation, let’s turn our focus a bit into the other common test focus areas: devices, browsers (types and versions), the user’s specific geographic location, network origin, network provider, and operating system bandwidth.

The fact is, users experience many different levels of performance, and many are based on the overall dimension combinations consisting of the types of user-specific data points mentioned above. Let’s look at some data and see how this type of RUM data analysis can help test planning and execution from yet another angle.

In the following visualization, the many different dimensions of a user are mapped against the entire spectrum of available options and combinations picked up by RUM as having a footprint of users who are using that particular dimension set. As an example, a user may be on a Samsung phone, using the Android Browser running Android OS 4, using a 4G AT&T network, and be located in Charlotte, NC. In this case, the performance of this combination of dimensions is netting this user profile a response time of 8.7 seconds for page loads. This is well above the average for some other combinations/dimensions, and certainly well above what is considered acceptable for performance and conversion rate/revenue. In the key on the bottom left of the next figure, it's shown that approximately 60% of the users with this dimension set were experiencing a response time of greater than 8.7 seconds for page load time. And with the user pool at about 330 views, this indicates a problem area that certainly needs to be explored further in the form of more analysis and certainly a very focused performance test scenario.

Image title

Conversely, let’s look at another set of user dimensions in the next image. These users are experiencing a 2.5 second response time, though with a smaller sample size across a different spectrum of dimension combinations. In this case, you could see that users in Marietta, GA using their iPad’s or iPhone’s running iOS 8 on Cable DSL are having a far better user experience than their counterparts in Birmingham and Orlando.

Image title

Given these two examples, where would you spend your testing time? Obviously, in an area where the combinations have a high usage rate (e.g. the 330 views earlier in this small time slice) as well as a poor performance rate. With a constant stream of user data across time, today’s RUM users can easily focus their performance testing efforts on areas that impact their business and bottom line revenue, thus adding value to their organization. This approach is certainly better than just sitting in a room as a QA performance tester generating test scripts based on how he or she would use the site.

Organizations where that is still the preferred approach to performance testing risk revenue abandonment from their customer community due to the stubbornness of the QA performance team in not relinquishing the processes, methods, and tools that they started using in the mid-1990s. With today’s capabilities around RUM, any approach to performance testing that does not directly start with RUM is a recipe for failure by not taking advantage of the voice of your user community.

But you can rest assured. Your competition will thank you for your nostalgia for keeping your performance testing practices based in the 1990s and ignoring the RUM revolution, as they ring in the new customers they are picking up due to the blind spots in your testing capability.

Section 10

Use RUM as Your Leverage With Marketing and Development

Now that we pointed out a way that RUM can help you get a gold star with your marketing organization in the above examples, let’s take another step—one where using RUM data can be used to push back on content changes proposed by marketing (e.g., “Hey, let’s use this great video to attract attention to our new loyalty program rewards!”—and off they go with the development team to make the changes on your website without any regard for page performance and revenue impacts).

Not so fast!

What if you could show marketing and development that the image/video they are planning on deploying in the next campaign will slow the website down by about 800ms? Well, with RUM, you can. The data is at your fingertips. Many RUM solutions offer this type of capability (or you can try to build on top of Boomerang yourself with a lot of sweat equity and free time).

In the following example, we see that an 800 ms increase in page load time would lead to a decrease of approximately 0.3% in the conversion rate, which translate into about $120K in revenue. Is this the type of marketing campaign your brand wants? With RUM data at your fingertips, you—as the UX engineer or the QA/performance engineer—can push back on marketing and development with real data captured from your real user behavior.

Image title

Conversely, what if the business wanted to attain higher revenue goals within their current e-commerce platform, without running any major campaigns? Using the RUM data available, you can run “what-if?” scenarios against what the page load times need to be to attain the desired revenue targets.

In the next example, the revenue goal is $6M. The website page load time is approximately 5 seconds, yielding a conversion rate of 9.1% against a revenue line of a shade over $5.4M. So, to get to the revenue goal of $6M over this time period, the web page performance would have to improve by about 2.2 seconds, thus leading to an uptick in conversion rate of about 0.9%, yielding the additional $536K in additional revenue needed to hit the target.

So, how is this done? The analysis is done from the RUM data collected in the real user beacon data. The analysis is either done for you in a RUM solution, or is something you’d develop on top of your open source-based solution.

You would then begin the process of analyzing the website for opportunities to reduce page load times, either by removing or compressing images or videos, looking at 3rd party content providers and their overall impact to your page performance, or a combination of these. At least now you’d be armed with the data required to go back to marketing, the development team, and management, to show value in how RUM can make an impact in your business.

Image title

Section 11

Conclusion

The takeaway here is this: if used to its full extent, RUM can make you a hero.

To quote an e-Commerce SVP friend of mine, “We have lots of data. We just don’t know what it’s telling us!”

If you are using RUM, you are in a Ferrari. In the hands of a novice, it’s intimidating, and can be overbearing. In the hands of a Data Scientist or forward-thinking web performance guru, it’s a work of art. A tool to be wielded across the brand. To be leveraged with marketing, with IT Operations, and with development: organizations that typically do not even speak to one another. With RUM, you can provide them a common language—Customer Experience Data. Their data. From their business. From your business. From your real users.

If you have yet to start with RUM, or are about to get started, start with the example uses above. The value that the data will bring to the use cases discussed above will bring immediate ROI, and revenue, to your business.

Oh, and you’ll be the hero across the organization. No silo will be too tall for you to hurdle.

Like This Refcard? Read More From DZone

related article thumbnail

DZone Article

Unmasking Entity-Based Data Masking: Best Practices 2025
related article thumbnail

DZone Article

Scaling DevOps With NGINX Caching: Reducing Latency and Backend Load
related article thumbnail

DZone Article

The Role of Retrieval Augmented Generation (RAG) in Development of AI-Infused Enterprise Applications
related article thumbnail

DZone Article

5 Subtle Indicators Your Development Environment Is Under Siege
related refcard thumbnail

Free DZone Refcard

Full-Stack Observability Essentials
related refcard thumbnail

Free DZone Refcard

Getting Started With Log Management
related refcard thumbnail

Free DZone Refcard

Observability Maturity Model
related refcard thumbnail

Free DZone Refcard

Getting Started With OpenTelemetry

ABOUT US

  • About DZone
  • Support and feedback
  • Community research
  • Sitemap

ADVERTISE

  • Advertise with DZone

CONTRIBUTE ON DZONE

  • Article Submission Guidelines
  • Become a Contributor
  • Core Program
  • Visit the Writers' Zone

LEGAL

  • Terms of Service
  • Privacy Policy

CONTACT US

  • 3343 Perimeter Hill Drive
  • Suite 100
  • Nashville, TN 37211
  • support@dzone.com

Let's be friends: