DZone
Thanks for visiting DZone today,
Edit Profile
  • Manage Email Subscriptions
  • How to Post to DZone
  • Article Submission Guidelines
Sign Out View Profile
  • Post an Article
  • Manage My Drafts
Over 2 million developers have joined DZone.
Log In / Join
Refcards Trend Reports Events Over 2 million developers have joined DZone. Join Today! Thanks for visiting DZone today,
Edit Profile Manage Email Subscriptions Moderation Admin Console How to Post to DZone Article Submission Guidelines
View Profile
Sign Out
Refcards
Trend Reports
Events
Zones
Culture and Methodologies Agile Career Development Methodologies Team Management
Data Engineering AI/ML Big Data Data Databases IoT
Software Design and Architecture Cloud Architecture Containers Integration Microservices Performance Security
Coding Frameworks Java JavaScript Languages Tools
Testing, Deployment, and Maintenance Deployment DevOps and CI/CD Maintenance Monitoring and Observability Testing, Tools, and Frameworks
Partner Zones AWS Cloud
by AWS Developer Relations
Culture and Methodologies
Agile Career Development Methodologies Team Management
Data Engineering
AI/ML Big Data Data Databases IoT
Software Design and Architecture
Cloud Architecture Containers Integration Microservices Performance Security
Coding
Frameworks Java JavaScript Languages Tools
Testing, Deployment, and Maintenance
Deployment DevOps and CI/CD Maintenance Monitoring and Observability Testing, Tools, and Frameworks
Partner Zones
AWS Cloud
by AWS Developer Relations
11 Monitoring and Observability Tools for 2023
Learn more
  1. DZone
  2. Refcards
  3. Scalability and High Availability
refcard cover
Refcard #043

Scalability and High Availability

Performing Well at Any Scale

Provides the tools to define Scalability and High Availability, so your team can implement critical systems with well-understood performance goals.

Free PDF for Easy Reference
refcard cover

Written By

author avatar Matt Rasband
Senior Software Engineer,
author avatar Eugene Ciurana
Chief Architect, CIME Software Labs
Table of Contents
► Overview ► Implementing Scalable Systems ► Caching Strategies ► Clustering ► Redundancy and Fault Tolerance ► System Performance
Section 1

Overview

Scalability, High Availability, and Performance

The terms scalability, high availability, performance, and mission-critical can mean different things to different organizations, or to different departments within an organization. They are often interchanged and create confusion that results in poorly managed expectations, implementation delays, or unrealistic metrics. This Refcard provides you with the tools to define these terms so that your team can implement mission-critical systems with well understood performance goals.

Scalability

It's the property of a system or application to handle bigger amounts of work, or to be easily expanded, in response to increased demand for network, processing, database access or file system resources.

Horizontal scalability

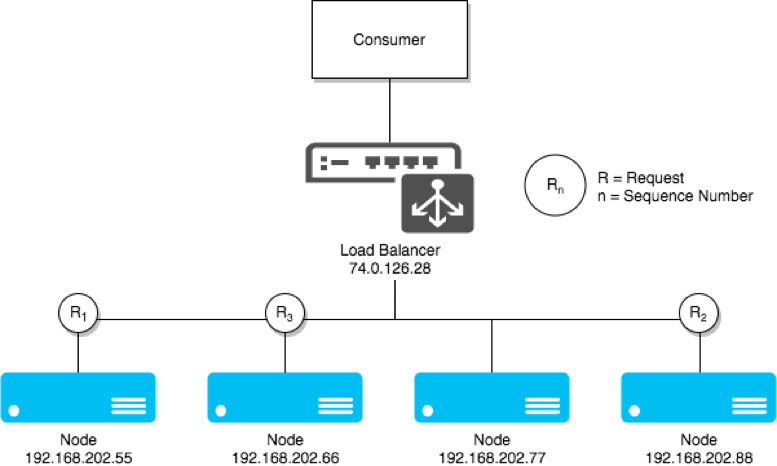
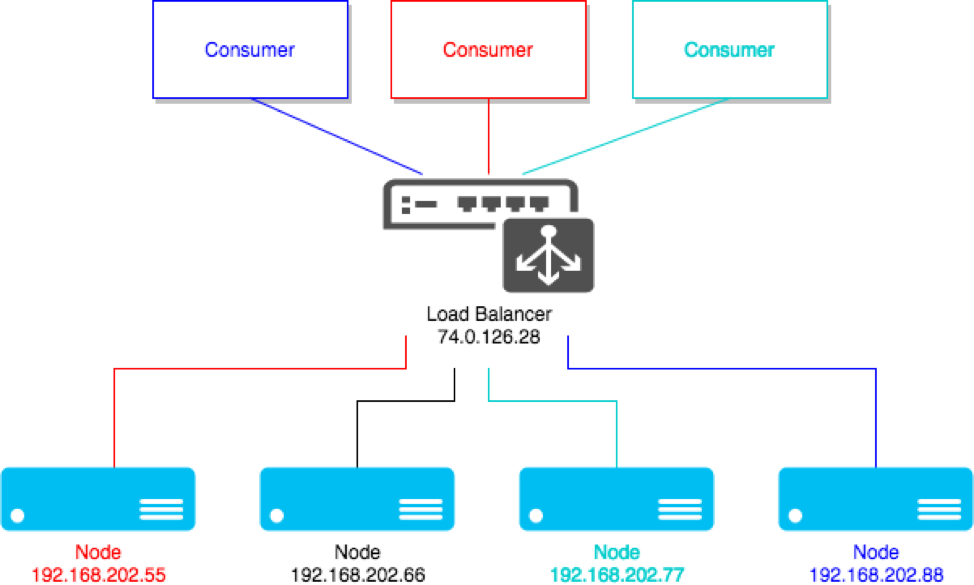
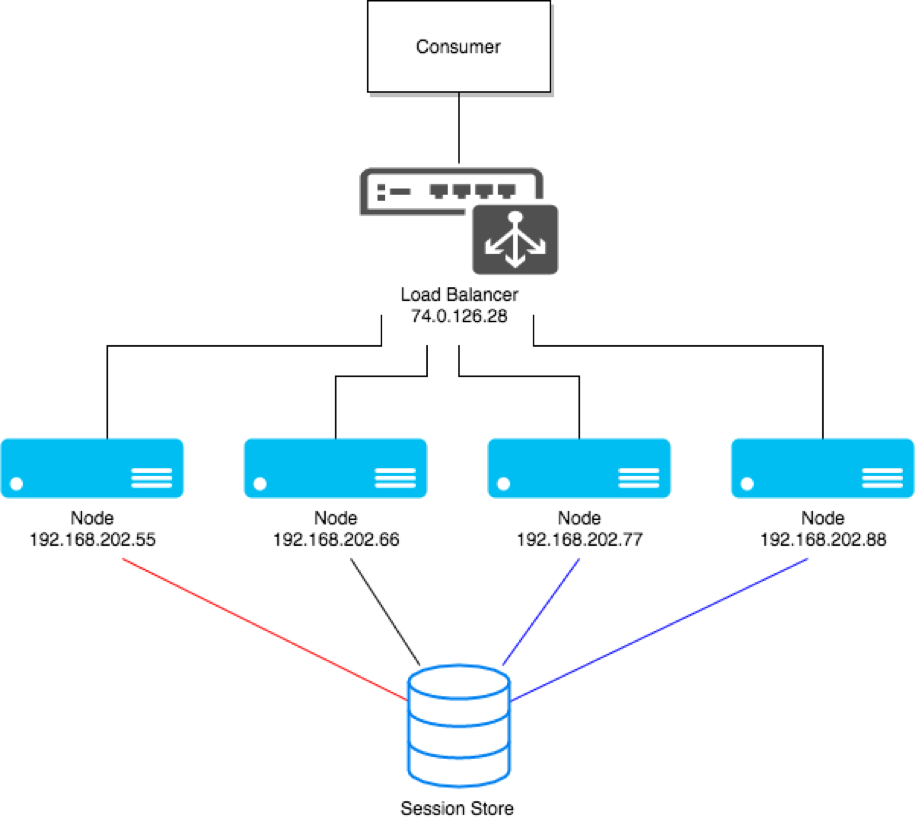
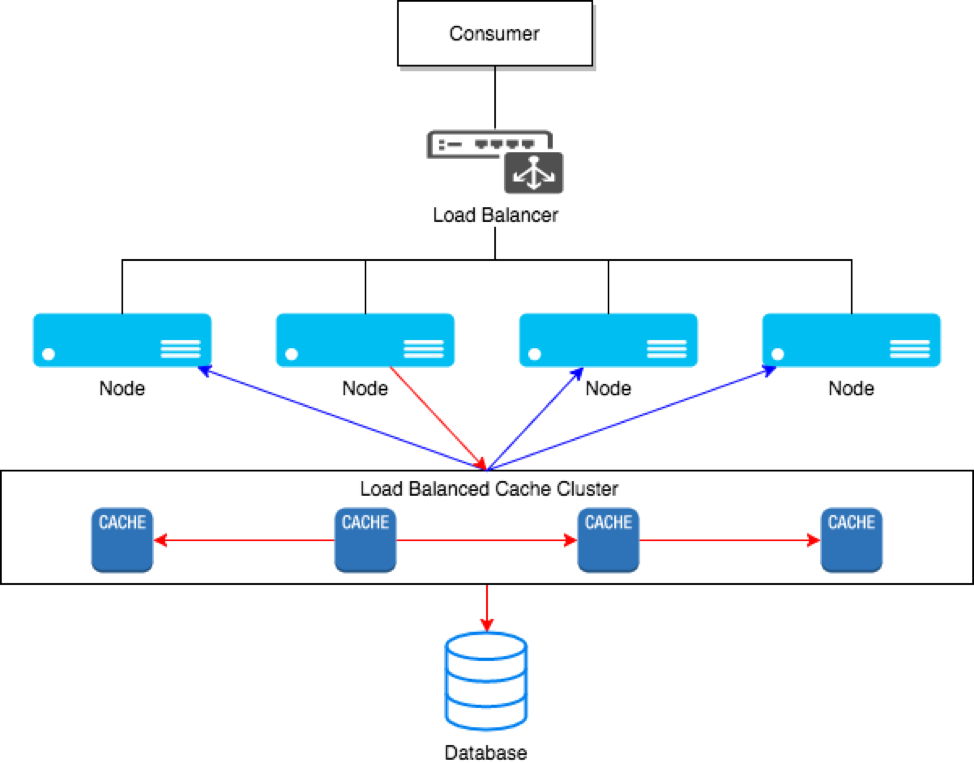
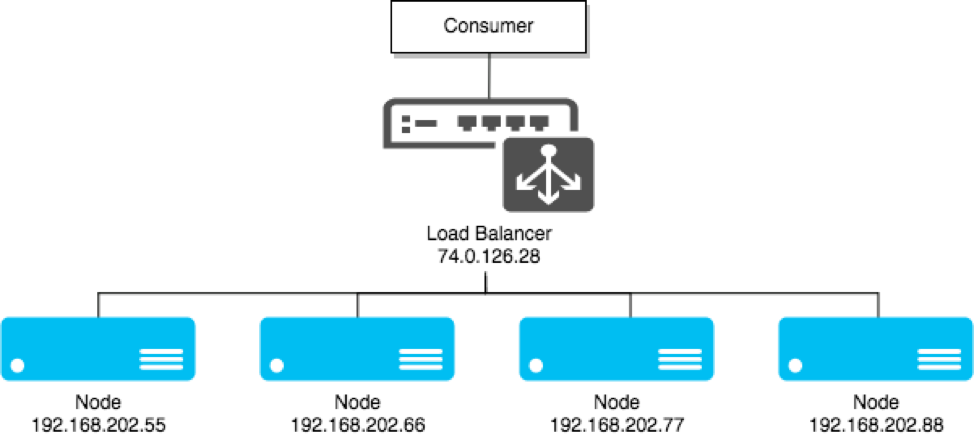
A system scales horizontally, or out, when it's expanded by adding new nodes with identical functionality to existing ones, redistributing the load among all of them. SOA systems and web servers scale out by adding more servers to a load-balanced network so that incoming requests may be distributed among all of them. Cluster is a common term for describing a scaled out processing system.

Clustering

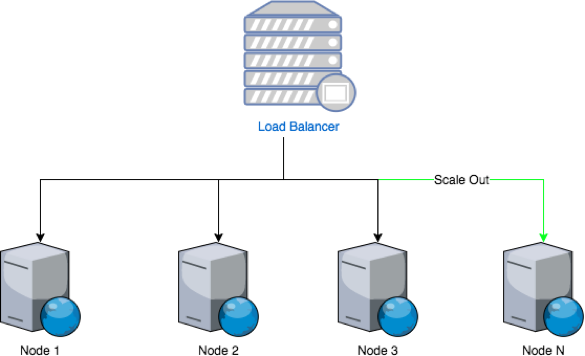
Figure 1: Clustering

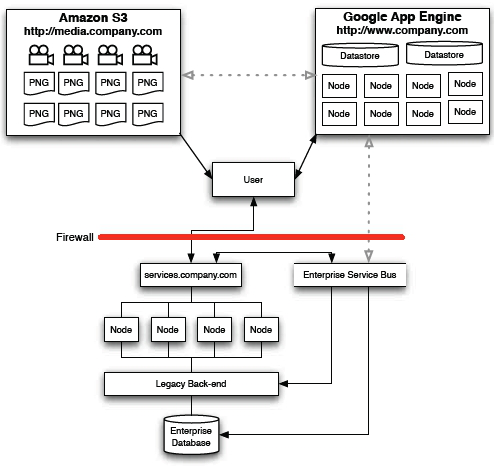
Vertical scalability

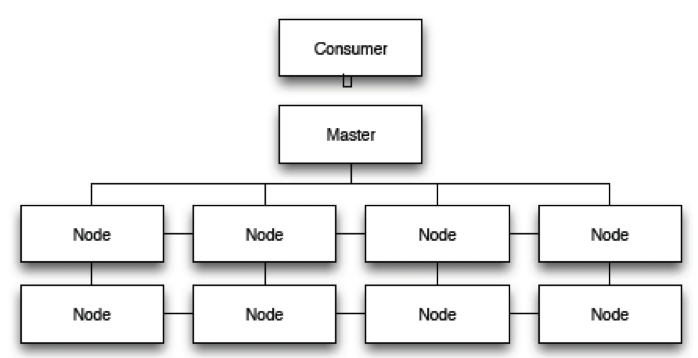
A system scales vertically, or up, when it's expanded by adding processing, main memory, storage, or network interfaces to a node to satisfy more requests per system. Hosting services companies scale up by increasing the number of processors or the amount of main memory to host more virtual servers in the same hardware.

Virtualization

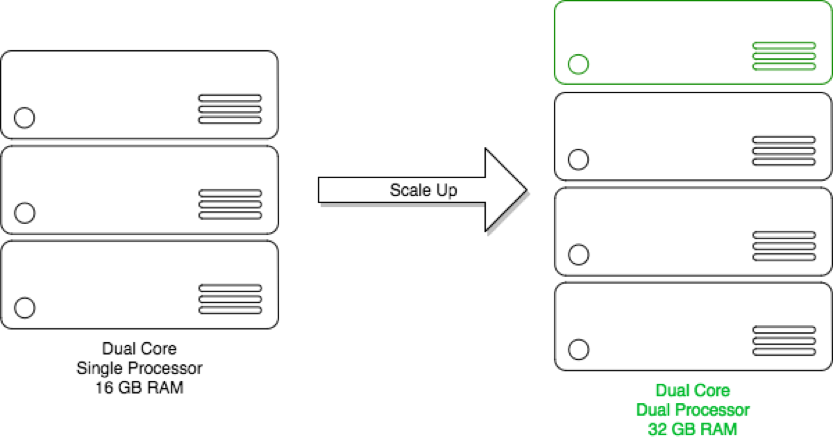
Figure 2:Virtualization
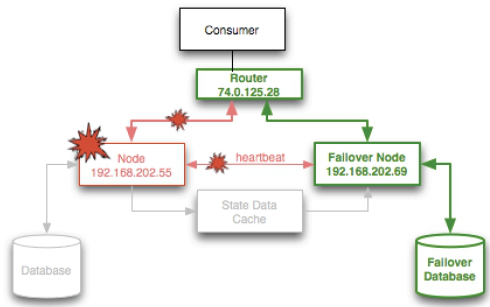
High Availability

Availability describes how well a system provides useful resources over a set period of time. High availability guarantees an absolute degree of functional continuity within a time window expressed as the relationship between uptime and downtime.

A = 100 – (100*D/U), D ::= unplanned downtime, U ::= uptime; D, U expressed in minutes

Uptime and availability don't mean the same thing. A system may be up for a complete measuring period, but may be unavailable due to network outages or downtime in related support systems. Downtime and unavailability are synonymous.

Measuring Availability

Vendors define availability as a given number of "nines" like in Table 1, which also describes the number of minutes or seconds of estimated downtime in relation to the number of minutes in a 365-day year, or 525,600, making U a constant for their marketing purposes.

Availability % Downtime in Minutes Downtime per Year Vendor Jargon
90 52,560.00 36.5 days one nine
99 5,256.00 4 days two nines
99.9 525.60 8.8 hours three nines
99.99 52.56 53 minutes four nines
99.999 5.26 5.3 minutes five nines
99.9999 0.53 32 seconds six nines

Table 1: Availability as a Percentage of Total Yearly Uptime

Analysis

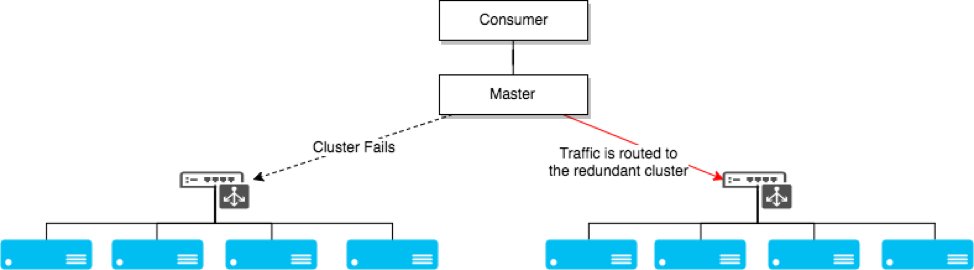
High availability depends on the expected uptime defined for system requirements; don't be misled by vendor figures. The meaning of having a highly available system and its measurable uptime are a direct function of a Service Level Agreement. Availability goes up when factoring planned downtime, such as a monthly 8-hour maintenance window. The cost of each additional nine of availability can grow exponentially. Availability is a function of scaling the systems up or out and implementing system, network, and storage redundancy.

Service Level Agreement (SLA)

SLAs are the negotiated terms that outline the obligations of the two parties involved in delivering and using a system, like:

  • System type (virtual or dedicated servers, shared hosting)
  • Levels of availability
    • Minimum
    • Target
  • Uptime
    • Network
    • Power
    • Maintenance windows
  • Serviceability
  • Performance and Metrics
  • Billing

SLAs can bind obligations between two internal organizations (e.g. the IT and e-commerce departments), or between the organization and an outsourced services provider. The SLA establishes the metrics for evaluating the system performance, and provides the definitions for availability and the scalability targets. It makes no sense to talk about any of these topics unless an SLA is being drawn or one already exists.

Elasticity

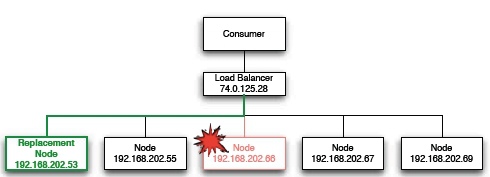
Elasticity is the ability to dynamically add and remove resources in a system in response to demand, and is a specialized implementation of scaling horizontally or vertically.

As requests increase during a busy period, more nodes can be automatically added to a cluster to scale out and removed when the demand has faded – similar to seasonal hiring at brick and mortar retailers. Additionally, system resources can be re-allocated to better support a system for scaling up dynamically.

Section 2

Implementing Scalable Systems

SLAs determine whether systems must scale up or out. They also drive the growth timeline. A stock trading system must scale in real-time within minimum and maximum availability levels. An e-commerce system, in contrast, may scale in during the "slow" months of the year, and scale out during the retail holiday season to satisfy much larger demand.

Load Balancing

Load balancing is a technique for minimizing response time and maximizing throughput by spreading requests among two or more resources. Load balancers may be implemented in dedicated hardware devices, or in software. Figure 3 shows how load-balanced systems appear to the resource consumers as a single resource exposed through a well-known address. The load balancer is responsible for routing requests to available systems based on a scheduling rule.

Load Balancer

Figure 3: Availability as percentage of Total Yearly Uptime

Scheduling rules are algorithms for determining which server must service a request. Web applications and services are typically balanced by following round robin scheduling rules, but can also balance based on least-connected, IP-hash, or a number of other options. Caching pools are balanced by applying frequency rules and expiration algorithms. Applications where stateless requests arrive with a uniform probability for any number of servers may use a pseudo-random scheduler. Applications like music stores, where some content is statistically more popular, may use asymmetric load balancers to shift the larger number popular requests to higher performance systems, serving the rest of the requests from less powerful systems or clusters.

Persistent Load Balancers

Stateful applications require persistent or sticky load balancing, where a consumer is guaranteed to maintain a session with a specific server from the pool. Figure 4 shows a sticky balancer that maintains sessions from multiple clients. Figure 5 shows how the cluster maintains sessions by sharing data using a database.

Sticky Load Balancer

Figure 4: Sticky Load Balancer

Common Features of a Load Balancer

Asymmetric load distribution – assigns some servers to handle a bigger load than others

  • Content filtering: Inbound or outbound.
  • Distributed Denial of Services (DDoS) attack protection
  • Firewall.
  • Payload switching: Sends requests to different servers based on URI, port, and/or protocol.
  • Priority activation: Adds standing by servers to the pool.
  • Rate shaping: Ability to give different priority to different traffic.
  • Scripting: Reduces human interaction by implementing programming rules or actions.
  • SSL termination: Hardware-assisted encryption frees web server resources.
  • TCP buffering and offloading: Throttle requests to servers in the pool.
  • GZIP compression: Decreases transfer bandwidth utilization.

DatabaseSessions

Figure 5: Database Sessions

Section 3

Caching Strategies

Stateful load balancing techniques require data sharing among the service providers. Caching is a technique for sharing data among multiple consumers or servers that are expensive to either compute or fetch. Data are stored and retrieved in a subsystem that provides quick access to a copy of the frequently accessed data.

Caches are implemented as an indexed table where a unique key is used for referencing some datum. Consumers access data by checking (hitting) the cache first and retrieving the datum from it. If it's not there (cache miss), then the costlier retrieval operation takes place and the consumer or a subsystem inserts the datum to the cache.

Write Policy

The cache may become stale if the backing store changes without updating the cache. A write policy for the cache defines how cached data are refreshed. Some common write policies include:

  • Write-through: Every write to the cache follows a synchronous write to the backing store.
  • Write-behind: Updated entries are marked in the cache table as dirty and it's updated only when a dirty datum is requested.
  • No-write allocation: Only read requests are cached under the assumption that the data won't change over time but it's expensive to retrieve.

Application Caching

  • Implicit caching happens when there is little or no programmer participation in implementing the caching. The program executes queries and updates using its native API and the caching layer automatically caches the requests independently of the application. Example: Terracotta (https://www.terracotta.org/).
  • Explicit caching happens when the programmer participates in implementing the caching API and may also implement the caching policies. The program must import the caching API into its flow in order to use it. Examples: memcached (http://www.danga.com/memcached), Redis (https://redis.io), and Oracle Coherence (http://coherence.oracle.com).

In general, implicit caching systems are specific to a platform or language. Terracotta, for example, only works with Java and JVM-hosted languages like Groovy or Kotlin. Explicit caching systems may be used with many programming languages and across multiple platforms at the same time. Memcached and Redis work with every major programming language, and Coherence works with Java, .Net, and native C++ applications.

Web Caching

Web caching is used for storing documents or portions of documents (‘particles') to reduce server load, bandwidth usage and lag for web applications. Web caching can exist on the browser (user cache) or on the server, the topic of this section. Web caches are invisible to the client may be classified in any of these categories:

  • Web accelerators: they operate on behalf of the server of origin. Used for expediting access to heavy resources, like media files, and are often geolocated closer to intended recipients. Content distribution networks (CDNs) are an example of web acceleration caches; Akamai, Amazon S3, Nirvanix are examples of this technology.
  • Proxy caches: they serve requests to a group of clients that may all have access to the same resources. They can be used for content filtering and for reducing bandwidth usage. Squid, Apache, Amazon Cloud Front, ISA server are examples of this technology.

Distributed Caching

Caching techniques can be implemented across multiple systems that serve requests for multiple consumers and from multiple resources. These are known as distributed caches, like the setup in Figure 6. Akamai is an example of a distributed web cache, and memcached is an example of a distributed application cache.

Distributed Cache

Figure 6: Distributed Cache

Section 4

Clustering

A cluster is a group of computer systems that work together to form what appears to the user as a single system. Clusters are deployed to improve services availability or to increase computational or data manipulation performance. In terms of equivalent computing power, a cluster is more cost-effective than a monolithic system with the same performance characteristics.

The systems in a cluster are interconnected over high-speed local area networks like gigabit Ethernet, fiber distributed data interface (FDDI), Infiniband, Myrinet, or other technologies.

Load Balancing Cluster

Figure 7: Load Balancing Cluster

Load-balancing cluster (active/active): Distribute the load among multiple back-end, redundant nodes. All nodes in the cluster offer full-service capabilities to the consumers and are active at the same time.

High availability cluster (active/passive): Improve services availability by providing uninterrupted service through redundant clusters that eliminate single points of failure. High availability clusters require two nodes at a minimum, a "heartbeat" to detect that all nodes are ready, and a routing mechanism that will automatically switch traffic, or fail over, if the main cluster fails.

Load Balancing Cluster

Figure 8: Cluster Failover

Grid: Process workloads defined as independent jobs that don't require data sharing among processes. Storage or network may be shared across all nodes of the grid, but intermediate results have no bearing on other jobs progress or on other nodes in the grid, such as a Cloudera Map Reduce cluster (http://www.cloudera.com).

Figure 11

Figure 9: Computational Clusters

Computational clusters: Execute processes that require raw computational power instead of executing transactional operations like web or database clusters. The nodes are tightly coupled, homogeneous, and in close physical proximity. They often replace supercomputers.

Section 5

Redundancy and Fault Tolerance

Redundant system design depends on the expectation that any system component failure is independent of failure in the other components.

Fault tolerant systems continue to operate in the event of component or subsystem failure; throughput may decrease but overall system availability remains constant. Faults in hardware or software are handled through component redundancy or safe fallbacks, if one can be made in software. Fault tolerance in software is often implemented as a fallback method if a dependent system is unavailable. Fault tolerance requirements are derived from SLAs. The implementation depends on the hardware and software components, and on the rules by which they interact.

Fault Tolerance SLA Requirements

  • No single point of failure: Redundant components ensure continuous operation and allow repairs without disruption of service.
  • Fault isolation: Problem detection must pinpoint the specific faulty component
  • Fault propagation containment: Faults in one component must not cascade to others.
  • Reversion mode: Set the system back to a known state.

Redundant clustered systems can provide higher availability, better throughput, and fault tolerance. The A/A cluster in Figure 10 provides uninterrupted service for a scalable, stateless application.

Figure 12

Figure 10: A/A full tolerance and recovery

Some stateful applications may only scale up; the A/P cluster in Figure 11 provides uninterrupted service and disaster recovery for such an application. Active/Active configurations provide failure transparency. Active/Passive configurations may provide failure transparency at a much higher cost because automatic failure detection and reconfiguration are implemented through a feedback control system, which is more expensive and trickier to implement.

Figure13

Figure 11: A/P fault tolerance and recovery

Enterprise systems most commonly implement A/P fault tolerance and recovery through fault transparency by diverting services to the passive system and bringing it on-line as soon as possible. Robotics and life-critical systems may implement probabilistic, linear model, fault hiding, and optimization control systems instead.

Multi-Region

Redundant systems often span multiple regions in order to isolate geographic phenomenon, provide failover capabilities, and deliver content as close to the consumer as possible. These redundancies cascade down through the system into all services, and a single scalable system may have a number of load balanced clusters throughout.

Cloud Computing

Cloud computing describes applications running on distributed, computing resources owned and operated by a third-party.

End-user apps are the most common examples. They utilize the Software as a Service (SaaS) and Platform as a Service (PaaS) computing models.

Figure 14

Figure 12: Cloud computing configuration

Cloud Services Types

  • Web services: Salesforce com, USPS, Google Maps.
  • Service platforms: Google App Engine, Amazon Web Services (EC2, S3, Cloud Front), Nirvanix, Akamai, MuleSource.

Fault Detection Methods

Fault detection methods must provide enough information to isolate the fault and execute automatic or assisted failover action. Some of the most common fault detection methods include:

  • Built-in diagnostics.
  • Protocol sniffers.
  • Sanity checks.
  • Watchdog checks.

Criticality is defined as the number of consecutive faults reported by two or more detection mechanisms over a fixed time period. A fault detection mechanism is useless if it reports every single glitch (noise) or if it fails to report a real fault over a number of monitoring periods.

Section 6

System Performance

Performance refers to the system throughput and latency under a particular workload for a defined period of time. Performance testing validates implementation decisions about the system throughput, scalability, reliability, and resource usage. Performance engineers work with the development and deployment teams to ensure that the system's non-functional requirements like SLAs are implemented as part of the system development lifecycle. System performance encompasses hardware, software, and networking optimizations.

Tip: Performance testing efforts must begin at the same time as the development project and continue through deployment. Testing should be performed against a mirror of the production environment, if possible.

The performance engineer's objective is to detect bottlenecks early and to collaborate with the development and deployment teams on eliminating them.

System Performance Tests

Performance specifications are documented along with the SLA and with the system design. Performance troubleshooting includes these types of testing:

  • Endurance testing: Identifies resource leaks under the continuous, expected load.
  • Load testing: Determines the system behavior under a specific load.
  • Spike testing: Shows how the system operates in response to dramatic changes in load.
  • Stress testing: Identifies the breaking point for the application under dramatic load changes for extended periods of time.

Software Testing Tools

There are many software performance testing tools in the market. Some of the best are released as open-source software. A comprehensive list of those is available from DZone.

These include Java, native, PHP, .Net, and other languages and platforms.

Like This Refcard? Read More From DZone

related article thumbnail

DZone Article

related refcard thumbnail

Free DZone Refcard

ABOUT US

  • About DZone
  • Send feedback
  • Careers
  • Sitemap

ADVERTISE

  • Advertise with DZone

CONTRIBUTE ON DZONE

  • Article Submission Guidelines
  • Become a Contributor
  • Visit the Writers' Zone

LEGAL

  • Terms of Service
  • Privacy Policy

CONTACT US

  • 600 Park Offices Drive
  • Suite 300
  • Durham, NC 27709
  • support@dzone.com
  • +1 (919) 678-0300

Let's be friends:

{{ parent.title || parent.header.title}}

{{ parent.tldr }}

{{ parent.linkDescription }}

{{ parent.urlSource.name }}
by
CORE
· {{ parent.articleDate | date:'MMM. dd, yyyy' }} {{ parent.linkDate | date:'MMM. dd, yyyy' }}
Tweet
{{ parent.views }} ViewsClicks
  • Edit
  • Delete
  • {{ parent.isLocked ? 'Enable' : 'Disable' }} comments
  • {{ parent.isLimited ? 'Remove comment limits' : 'Enable moderated comments' }}