

The 2026 Observability Audit: Separating Single Vendor Silos From Community Innovation
Learn how to evaluate open-source observability projects, compare vendor contributions, and identify healthy community-driven projects beyond marketing claims.
 CORE
·
CORE
·
Join the DZone community and get the full member experience.
Join For FreeOpen source projects dominated by a single vendor are a hallmark of "open source in name only." Rather than filling the traditional role of open source fostering innovation and decision-making from a diverse community, "open source in name only" projects are often used as marketing tools for proprietary platforms. These projects are also seen as riskier than community-driven projects because a single vendor is more apt to abruptly terminate long-term support, restrict contributions, or switch from an open-source license to a more restrictive one (forcing some previous contributors to pay for the project they helped build).
In these projects, critics claim that investments are often lopsided and heavily skewed toward onboarding, marketing, and brand-related support. As a result, technical contributions are frequently less developed, opaque, undocumented, or lacking in real substance, often manifesting merely as a superficial "ease of entry and onboarding." Because of these underlying gaps in documentation and codebase depth, developers are routinely forced to reverse-engineer functionality simply to get the tools to work correctly.
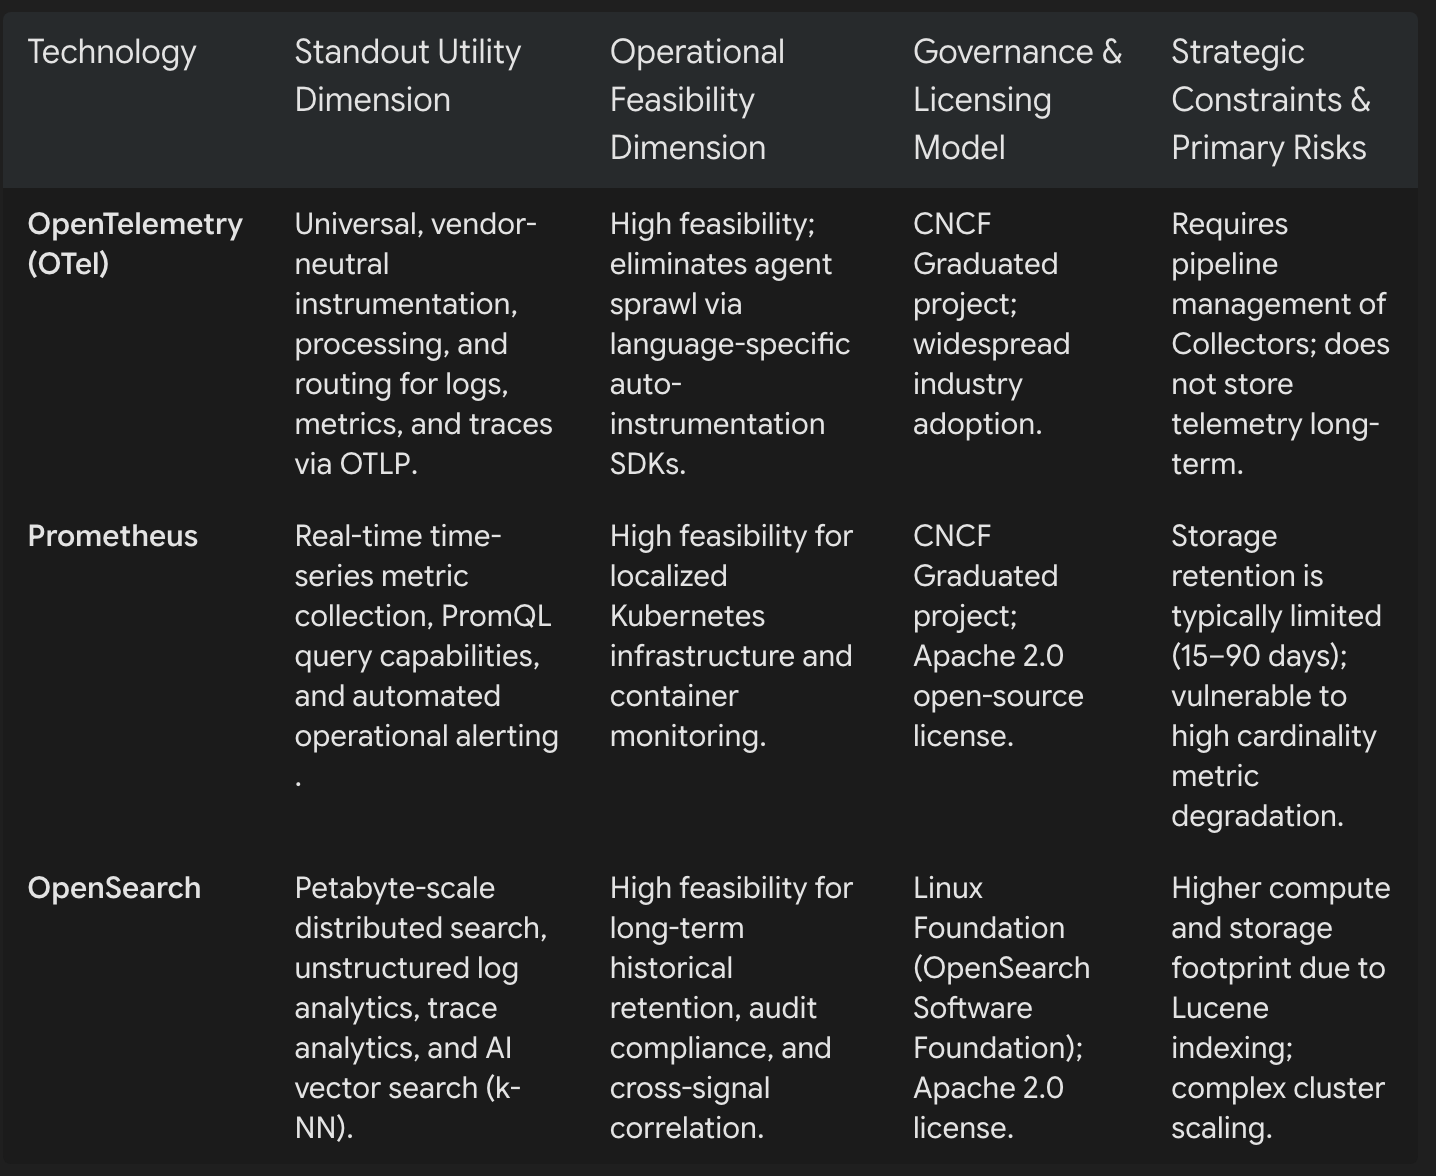
An evaluation of three leading open-source observability projects–OpenSearch, Prometheus, and OpenTelemetry (OTel)– by ReveCom was conducted to determine whether they fell under this vendor-dominated category or are truly vibrant community-led projects.
According to Gartner research, these three projects are collectively important because together they provide a complete, vendor-neutral observability architecture covering all three fundamental telemetry signals—metrics, logs, and distributed traces — without locking an enterprise into proprietary agent formats or single-vendor cloud platforms. Gartner defines observability as the extent to which internal system states can be inferred from externally emitted data. By pairing OpenTelemetry as a universal collection and routing tier with Prometheus for real-time metric alerting and OpenSearch for high-volume log analytics and trace analysis, organizations gain end-to-end operational visibility, retain full ownership of their telemetry pipelines, and avoid runaway cloud ingestion or lock-in costs.
To develop the framework, data from the ReveCom Observability Report 2026 was used, which includes metrics about contribution numbers and quality, including commit frequency, contributor growth, community expansion, and deployment patterns. Based on this data, authentic efforts were separated from perfunctory efforts. "Authentic" contributions were defined as those made to the computing code (i.e., the observability stack for logs, traces, and metrics) and its computational efficiency as measured in latency.
The Controversial Fork
AWS's controversial decision to monetize and then fork Elasticsearch to create OpenSearch in 2021 (when Elastic made its license more restrictive) is a case study of the risks associated with vendor-dominated projects. It also serves as an example of the issues associated with a vendor forking and heavily promoting a project it contributed minimally to.
According to Elastic representatives, although a major beneficiary of Elastic through its managed service, AWS engineers contributed only a "handful" of commits to Elasticsearch from 2020 to 2021, Elasticsearch says.
This disparity suggests that the successor project, OpenSearch, was born from a position of minimal technical familiarity with the core codebase. Elastic famously described this as "there is no compression algorithm for experience."
For a technical leader, this lack of pre-fork familiarity suggests a significant "experience gap" that can impact the speed and stability of future feature releases. AWS made few fundamental changes to the Elasticsearch codebase it forked to create OpenSearch, largely just rebranding the existing observability tool.
Comparing Three Observability Communities
In 2024, Amazon donated OpenSearch to the Linux Foundation, bringing it under a governance structure and setting the stage for it to become a more decentralized project.
Among other things, once a project is donated to the Linux Foundation, no single company can hold more than 25% of the seats on the technical oversight bodies. Decentralized governance is structured so that substantive, collaborative contributions from several competing observability vendors can better serve the broader community's needs.
Amazon's donation set the stage for OpenSearch to become a much more community-driven effort, comparable to the community-led support of the Prometheus and OpenTelemetry projects.
Prometheus and OpenTelemetry exemplify healthy, community-led open source standardization. This is how teams should evaluate open source: by the diversity of the entities with "skin in the game."
Prometheus emerged from SoundCloud in 2012, where it was designed to track metrics and store them in a time-series database. Around 2014, Grafana and its glassy, visually appealing panels became part of the ecosystem. The combination of Prometheus and Grafana became an integral, de facto standard for monitoring and observability in Kubernetes deployments and infrastructure.
Prometheus was donated to the CNCF in 2016 and graduated in 2018. Since then, it has evolved into a very diverse, community-led project, with multiple contributing companies. Grafana Labs remains one of the largest contributors, but the breakdown of substantive commits-excluding documentation-is wide and varied, reflecting the project's broad, collaborative nature.
This wider contribution to the project's standardization ensures that engineering talent is portable and the stack remains interoperable.
Separating Brand From Backbone
A key open source health metric-perhaps the most substantial of all-is ranking substantive engineering contributions, such as code-level commits and pull requests or high-impact technical commits. These are described as commits that can lead to v1.0, v2.0, or v3.0 milestones, signifying production readiness and improvements.
The number and frequency of technical contributions, as measured by commits, are markers for a project's community dynamics and value to end users. Looking at OpenSearch, AWS made significant technical contributions in 2025.
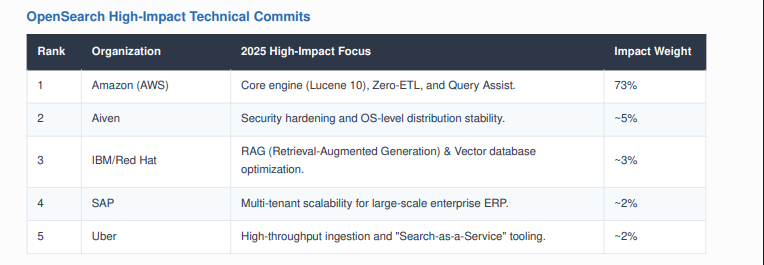
As the data shows, Amazon contributes the majority of substantive commits (73%) to OpenSearch. Much of this can be attributed to a surge in contributions related to the AI aspects of observability, specifically "search-to-Al infrastructure" commits. IBM and Red Hat have also contributed AI-related work on RAG and vector database optimization.
These are solid contributions, and they show that Amazon has moved beyond the early days, when it simply forked Elastic even though it had contributed relatively little to the project. Hopefully, OpenSearch will continue this shift toward increased community participation as new features are added.
However, such a dominant share of commits from a single vendor means that one vendor effectively controls the roadmap. In this case, AWS is potentially prioritizing its managed services over users' infrastructure needs.
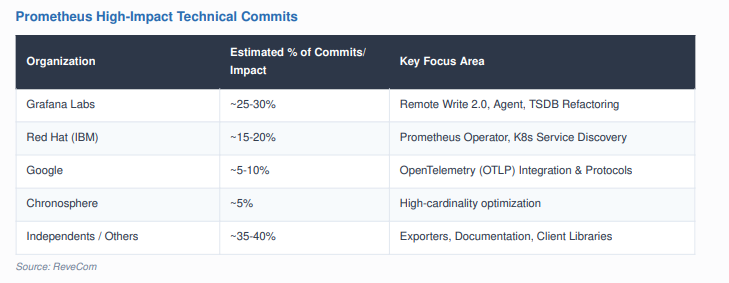
Prometheus has a wide range of contributions from vendor organizations. Grafana is the leading technical contributor to Prometheus, largely based on its development of TSDB storage refactoring, Remote Write 2.0, and agent-mode contributions.
Red Hat is the second-most frequent technical contributor to Prometheus, a position solidified by its acquisition of CoreOS. As the primary maintainer of the Prometheus Operator-a critical element for monitoring Kubernetes-Red Hat ensures seamless integration between the monitoring stack and the orchestration layer. While Red Hat provides deep engineering support, Prometheus remains a highly collaborative open-source project with contributions from across the industry.
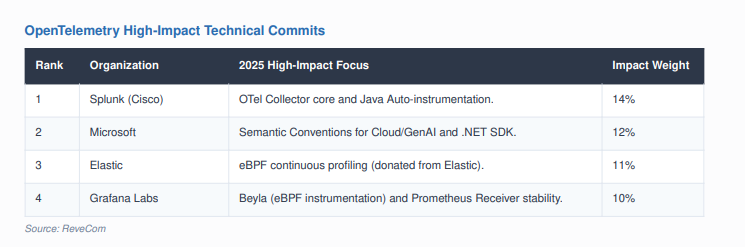
The OpenTelemetry project, under the leadership of Splunk, Microsoft, Elastic, Grafana Labs, and Google, provides a mature, stable, and innovative framework for the future of observability. By focusing on high-impact technical commits and "good faith" participation, the community helps ensure that observability data remains a standardized utility that empowers developers and platform engineers to navigate the complexities of the modern cloud landscape.
Splunk remains the largest contributor of high-impact technical commits to OpenTelemetry. Grafana is a notable contributor at number four by providing Beyla eBPF instrumentation and Prometheus receiver stability improvements.
Strategic Recommendations
Organizations should adopt an open-source technical strategy that prioritizes authentic engineering and project diversity. The following recommendations are derived from scrutinizing vendor-dominated projects and analyzing high-impact technical commitments.
The high-impact focus of companies like Grafana Labs, Splunk, Microsoft, Elastic, and hundreds of other contributor organizations means that OpenTelemetry and Prometheus should remain the foundation of observability for the next several years. When choosing an observability solution, organizations should prioritize vendors that are not only OTel-compliant but also OTel-contributing. This should also apply to Prometheus solutions, especially those for managing Kubernetes environments.
ReveCom's findings indicate that the most valuable contributions are those that advance the core "engine" of observability. Procurement decisions should be based on a vendor's ability to demonstrate substantive engineering that solves real-world infrastructure problems rather than relying on superficial marketing claims.
Ultimately, none of the three projects covered in this article can be fully characterized as "open source in name only." While OpenSearch arguably fell into that category immediately after it was forked from Elasticsearch, it has evolved since. OpenSearch remains an Amazon-dominated project, but it has seen an upward trend in contributions from the community and from third parties such as Uber, SAP, and Red Hat.
For observability community support, as measured by substantive technical contributions that solve infrastructure problems, OpenTelemetry and Prometheus exemplify a healthy balance of governance and code contributions across hundreds of organizations (notably Grafana and Splunk). Led by Grafana and Splunk among the observability providers, these projects fall behind only Kubernetes itself.
Opinions expressed by DZone contributors are their own.
Comments