Simplifying Multi-Cloud Observability With Open Source
As cloud workloads become increasingly sophisticated, adopting an open-source and vendor-agnostic approach is key to streamlining organizational operations.
Join the DZone community and get the full member experience.
Join For FreeGartner predicts by 2028, 50% of enterprises will utilize the cloud. The growth has also seen an increase in different strategies for organizations to use the cloud. Initially, organizations were completely on-prem, and then they were hybrid, where some workloads were still on-prem but some were migrated to the cloud. Eventually, companies started moving to multi-cloud where they use more than one cloud provider to host their workloads. A recent Oracle survey indicates that 98% of enterprises are either considering or already implementing a multi-cloud strategy.
So what are the motivations for these enterprises to move towards multi-cloud?
Motivations for Multi-Cloud
Data Sovereignty
Every country has its own data privacy and protection laws. The European Union has the GDPR, and the United States, India, China, and Japan have similar laws. It is the responsibility of the company serving customers in these regions to abide by these laws or face regulatory challenges.
One reason organizations want to use multiple clouds is when they identify the current cloud provider does not support their requirements.
Cloud Vendor Lock-In
Cloud vendor offerings keep changing. Old services are deprecated, new services are created, costs change, and regions go down.
Enterprise companies want to stay resilient to these changes and ensure none of the above affects their business operations. Using the multi-cloud strategy, organizations can develop architectures that don't take a dependency on a specific platform.
Cost Optimization
Each cloud provider has their strong offerings. Some offer free ingress/egress, discounted storage, and computing. Multi-cloud can help leverage these efficiencies as organizations are not tied to a specific vendor.
Observability
Observability is the bread and butter of any service. It answers questions such as, "Are we reaching our SLAs and SLOs?" and, "How is the user experience?" At its core, observability consists of three building blocks: metrics, logs, and traces.
- Metrics – Provide the numerical measure of the current state of the system
- Logs – Give stack trace or any other metadata required for debugging the system
- Traces – Provide the entire lifecycle of a request in a distributed microservice architecture
Why Observability Needs a Different Approach for Multi-Cloud
In a world where an organization relies on just one cloud, observability is not complicated. You have one SDK, dashboard, and schema that users have to understand.
// Azure Monitor
public static void sendToAzure Monitor(String metricName, double value) {

    // Implement Azure Monitor logic
    MetricsQueryClient client = new MetricsQueryClient (/* authentication details */);
    MetricData metricData = new MetricData()
        .withName (metricName)
        .withValue(value)..
    QueryResponse response = client.query( /* query details */);
}
Now, imagine you are operating in a multi-cloud environment. There is more than one SDK to maintain. The previous code snippet will turn into this nightmare.
// AWS CloudWatch
public static void sendToAWSCloudWatch(String metricName, double value) {

    AmazonCloudWatch cloudWatch AmazonCloudWatchClientBuilder.defaultClient();
    PutMetricDataRequest request = new PutMetricDataRequest()
      .withNamespace("MyNamespace")
      .withMetricData(new MetricDatum()..
    PutMetricDataResult result = cloudwatch.putMetricData(request);
}

// Implement Azure Monitor logic
public static void sendToAzure Monitor(String metricName, double value) {

    MetricsQueryClient client = new MetricsQueryClient(/* authentication details */);
    MetricData metricData = new MetricData()
        .withName (metricName)
        .withValue(value)..
    QueryResponse response = client.query(/" query details */);
}

// Oracle Cloud Monitoring
public static void sendToOracle(String metricName, double value) {

    MonitoringClient client = new MonitoringClient(/* authentication details */);
    PutMetricsDataRequest request = PutMetricsDataRequest.builder()
    .metricData(/* build metric data */)
    .namespace("MyNamespace")
    .build();...
    PutMetricsDataResponse response = client.putMetricsData(request);
}
Some of the other problems include:
- Understanding schema and SDK internals
- Getting to know the nuances of how observability is implemented by each cloud provider
What we discussed until now is just barely scratching the surface. Operations will turn into a huge pain because the on-call has to context switch between multiple cloud implementations and understand varying data formats. On average, a company uses nine different monitoring tools to manage applications, infrastructure, and user experience, which is just not scalable.
How do we solve this? How do we make life easier for the developers?
The crux of the problem lies in being vendor agnostic. Being so will help us offer a single-pane-of-glass experience for our developers.
Open Source and OpenTelemetry
OpenTelemetry facilitates this experience.
- It provides a single open-source standard to emit metrics, logs, and traces.
- All the major cloud providers (e.g., AWS, Google Cloud, Azure, and Oracle) support this standard.
- Most importantly, it is vendor-agnostic.
How Does OpenTelemetry Work?
Before OpenTelemetry
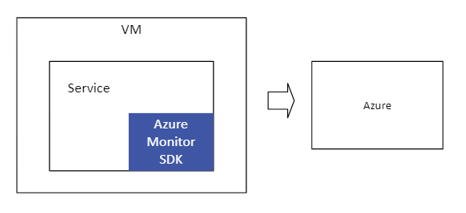
Before OpenTelemetry, observability looked something like the above. In this example, we use Azure Monitor and Log Analytics to emit metrics and logs from our service.
- Step 1: The service imported Azure Monitor SDK as a dependency.
- Step 2: We would write code specific to Azure monitor client to emit metrics
- Step 3: Metrics would show up in the Azure monitor dashboard.
After OpenTelemetry
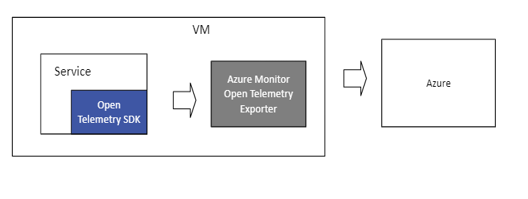
- Step 1: The service uses language-specific OpenTelemetry SDK.
- Step 2: Each cloud provider has their own OpenTelemetry Exporter. This exporter is responsible for translating the metrics from the SDK in a way the provider understands. AWS, Azure, Google Cloud, and Jaeger, for example, have other exporters.
- Step 3: Metrics show up automatically in the corresponding cloud provider dashboard. In this case, it's Azure.
Simply put, the service owners are not locked to a specific implementation. They end up using the open-source standard to emit observability data, and vendors take care of translating this data into a language they understand.
Here is an example of how OpenTelemetry works with different cloud providers.
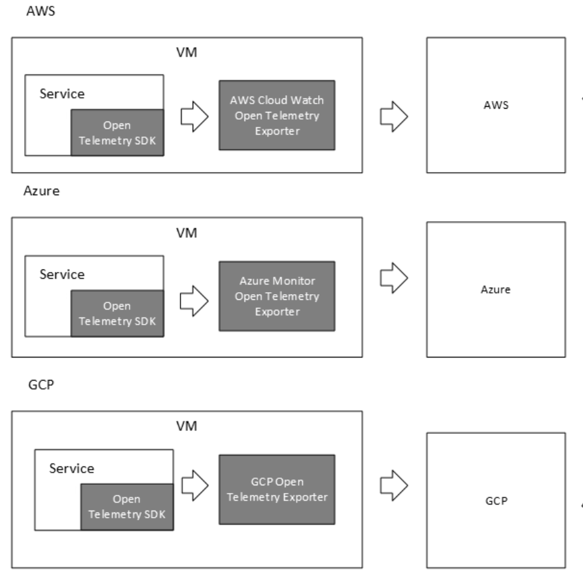
A code snippet of how emitting metrics to different vendors becomes easy:
// Set up namespace to emit metrics
var meter = new Meter("MyCompany.MyProduct.MyLibrary", "1.0");
var requestCounter = meter.CreateCounter<long>("requests_processed");

// Set up OpenTelemetry for metrics
using var meterProvider = Sdk.CreateMeterProviderBuilder()
    .AddMeter("MyCompany.MyProduct.MyLibrary") // Specify which meters to collect metrics from // Export metrics to console
    .AddConsoleExporter()
    .AddAzureMonitorExporter()
    .AddPrometheusExporter(opt =>
    {
      opt.HttpListenerPrefixes = new string[] { "http://localhost:9464/" }; // Prometheus endpoint
    })
    .AddOtlpExporter(opt =>
    {
      opt.Endpoint = new Uri("http://localhost:4317"); // Set OTLP endpoint
    }).Build();

// Emit metrics
requestCounter.Add(1);
If we need to emit metrics or logs to another provider, it is as easy as:
- Importing the dependency/package in Java/C# (there is support for other languages as well)
- Adding their Exporter to the list of Exporters above
Now that we have emitted data, it would also be good to have a unified experience to view this data. Using Grafana, all the data emitted to different cloud providers can be exported to one single place.
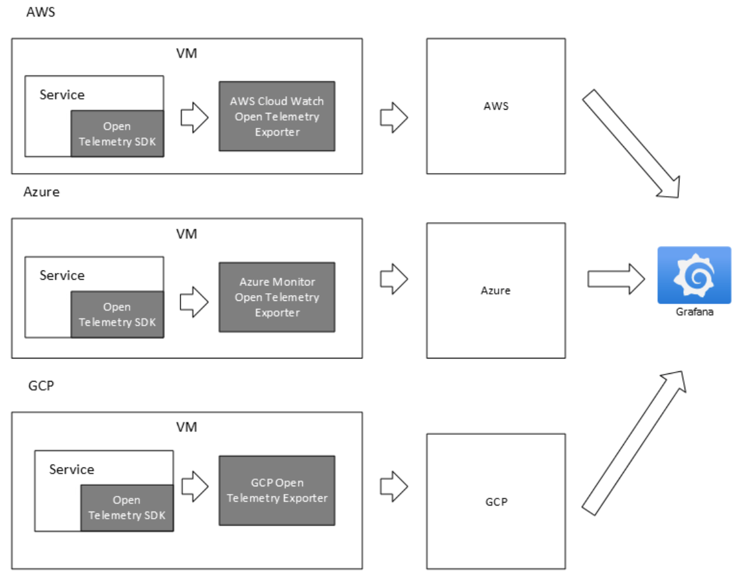
Similarly, tools like Jaegar help export trace data.
Final Thought
There you go, we've developed an observability stack that can seamlessly scale, regardless of how many cloud providers the organization uses.
Opinions expressed by DZone contributors are their own.
Comments