3 Easy Ways to Monitor JMeter Non-GUI Test Results
Learn how to start monitoring your non-GUI tests in a few steps: through out-of-the-box logs, via Taurus, and through the BlazeMeter cloud.
Join the DZone community and get the full member experience.
Join For FreeThe Apache JMeter™ GUI enables you to easily configure your performance scripts, add new test elements, and monitor test execution by using a variety of different listeners. But this “easy-to-use” solution has its drawbacks, especially when you need to use it for more complex cases.
For example, you might feel the disadvantages of the GUI mode when you start to perform load tests with thousands of users since running JMeter in GUI mode takes a lot of your machine resources. You might also be confused about how to use JMeter GUI in your continuous integration server (CI). The answer is that there's no way.
Fortunately, JMeter allows you to save performance tests as a script and run them in the non-GUI mode via the command line. This enables running very large tests, as well as adding the same command into continuous integration and automating the process.
But at this point, you might notice that you are not able to monitor your scripts with GUI JMeter listeners like you were before. In this article, we are going to cover that gap and help you start monitoring your non-GUI tests in a few steps: through out-of-the-box logs, via Taurus, and through the BlazeMeter cloud.
First of all, let’s create a performance script that we can use for the test. We will run a load test for the http://blazedemo.com/ web app, which is available for everyone who wants to play around with some performance scripts.
We are not going to cover GUI performance script creation from scratch, assuming that you have some hands-on experience on that. Briefly, this is the performance script configuration:
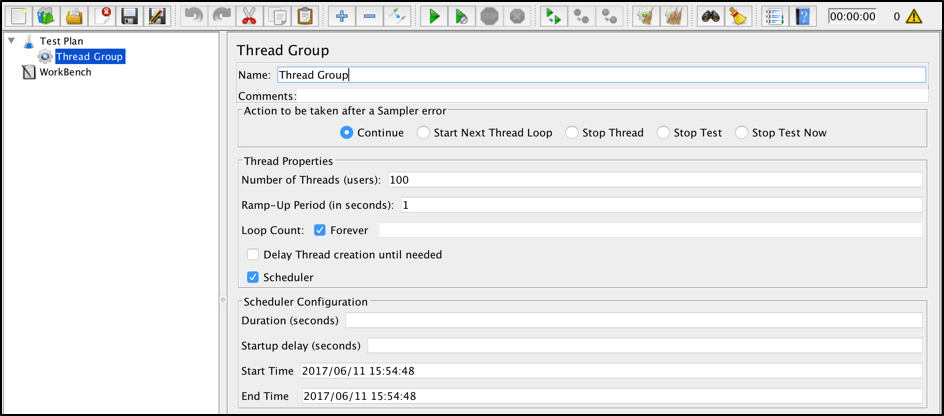
Thread group:
- Number of threads: 100
- Ramp-up period (seconds): 120
- Loop count: Forever
- Scheduler checked
- Duration (seconds): 300
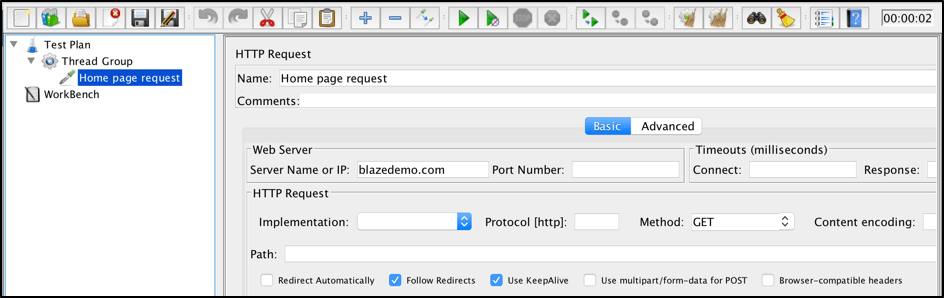
HTTP Sampler (1/2):
- Name: Homepage request
- Server name: blazedemo.com
- Method:
GET
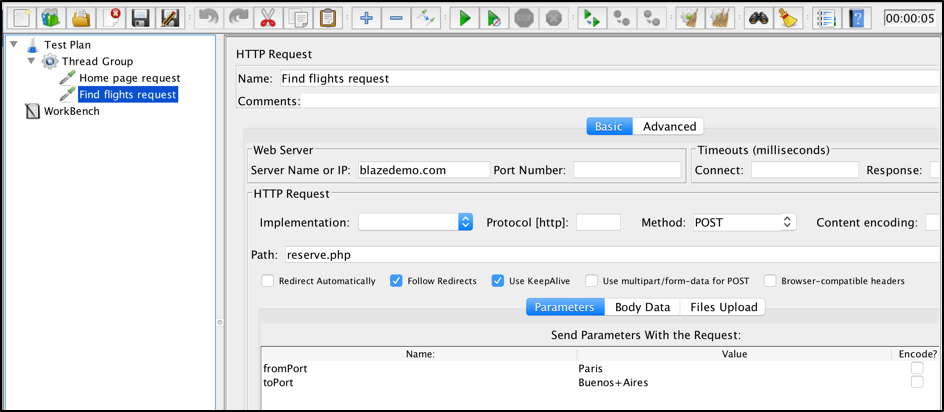
HTTP Sampler (2/2):
- Name: Find flights request
- Server name: blazedemo.com
- Method:
POST - Path: reserve.php
- Parameters:
fromPort: ParistoPort: Buenos+Aires
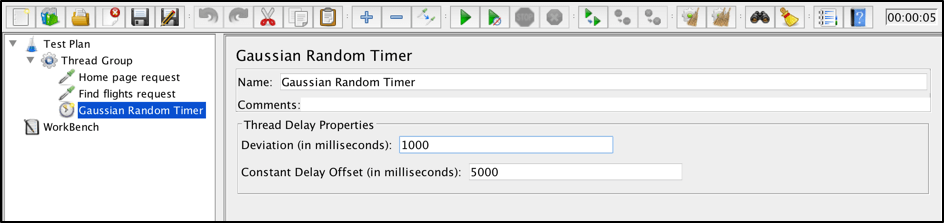
Add a random timeout to simulate user behavior:
- Gaussian Random Timer:
- Deviation (in milliseconds): 1000
- Constant Delay Offset (in milliseconds): 5000
Save the JMX file to be used to run the performance test via the command line. You can do it this way:
File > Save Test Plan As > JMX file. I named mine NonGuiTestMonitoring.jmx.
At this point, you can forget about the JMeter GUI application and close it until you want to change something in the script.
1. Monitoring JMeter Results From Out-of-the-Box Logs
To run the JMeter JMX file, you can use this command line template:
> jmeter -n -t [jmx_path] -nmeans “run JMeter in Non-GUI mode.”-tis used to specify the path to the JMX file.
Assuming that our current location is the folder with the created script, you run it with this command:
> jmeter -n -t NonGuiTestMonitoring.jmx Let’s run and see which details we can get from JMeter Non-GUI mode.
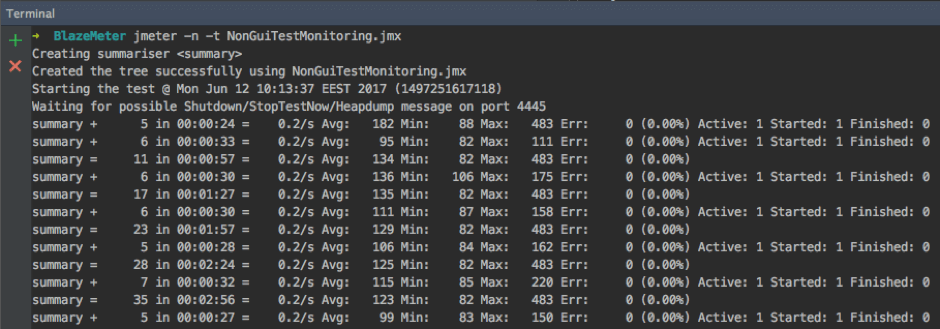
As you can see, even out of the box JMeter, provides some useful stats that can be used for basic real-time monitoring of your script execution. Let’s go over the stats and verify what we have:
- 5 in 00:00:24 = 0.2/s means that in 24 seconds we have sent 5 requests to the server with an average throughput of 0.2 requests per second.
- Avg: 182 means that the average response time at that moment is 182 milliseconds.
- Min: 88 means that the minimum response time from send requests for that period was 88 milliseconds.
- Max: 483 means that the maximum response time from send requests for that period was 483 milliseconds.
- Err: 0 (0.00%) means that we didn’t have any errors in requests for that period and the percentage of errors from total requests is 0 accordingly.
- Active: shows the number of active users who were performing requests for this period.
- Started: shows the total number of started threads since the beginning of the tests.
- Finished: shows the total number of threads that already finished execution since the beginning of tests.
These metrics show us some basic stats about our performance tests execution. However, they do not contain any specific details and reflect only the general server state. Let’s see how we can improve that.
2. Monitoring JMeter Results via Taurus
You also can go with another way. By using the Taurus framework, you can get real-time monitors right inside your console. Taurus can be used as a JMX script runner and provides many additional features, including real-time monitoring.
After you finish the Taurus installation with the few steps mentioned on this page, you can go ahead and run the same JMX file from before.
Just run this command:
> bzt NonGuiTestMonitoring.jmx 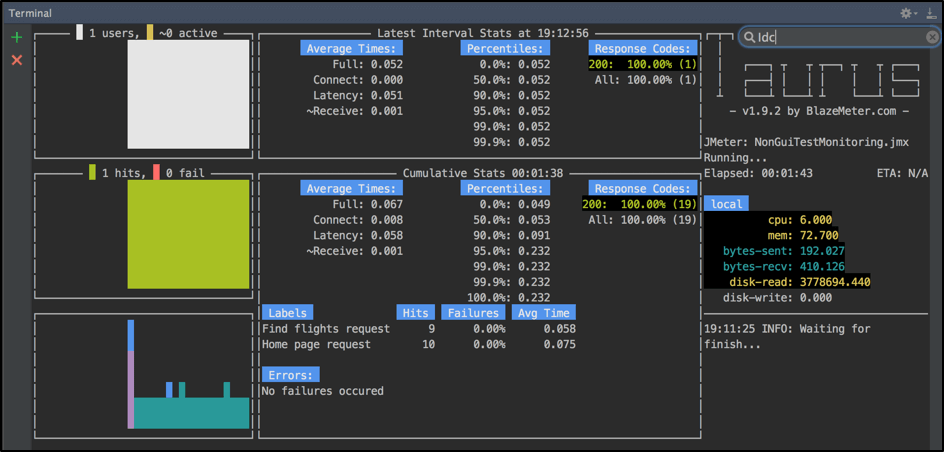
Even without any additional configurations, Taurus allows you to run your performance script with detailed real-time monitoring in the command line. On the Console dashboard, you can find almost all the metrics you might be interested in.
You can track active and all users, different response metrics for each sampler separately, errors, and execution machine metrics. This solution is perfect if you want just to monitor your tests in real time and don’t want to waste time on additional configurations. It’s also helpful that you don’t need to use anything except the console and you can even run these monitors on a remote server that doesn’t have a desktop (via SSH) and still see execution monitors.
3. Monitoring JMeter Results via the BlazeMeter Cloud
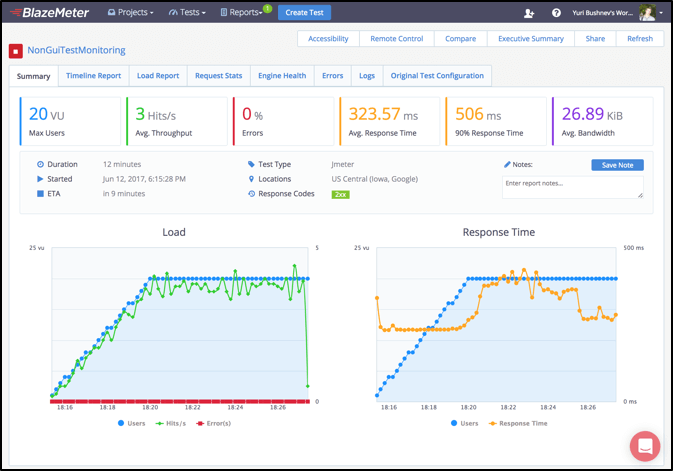
You can also easily run your JMX script in the cloud by using https://a.blazemeter.com. Use the free out-of-the-box version to upload your JMX script and run a load of up to 50 users. To run the test, you can either upload your JMX file in the box below or at the top of the page, or open the web application and then choose JMeter Test and configure your test.
After that, you might need to wait for two to four minutes until cloud server is up and running. As soon as the script is running, you will be redirected to the page of real-time monitoring where you can see all KPIs and analytics, like response time, active users, the percentage of errors and bandwidth, as well as multiple reports.
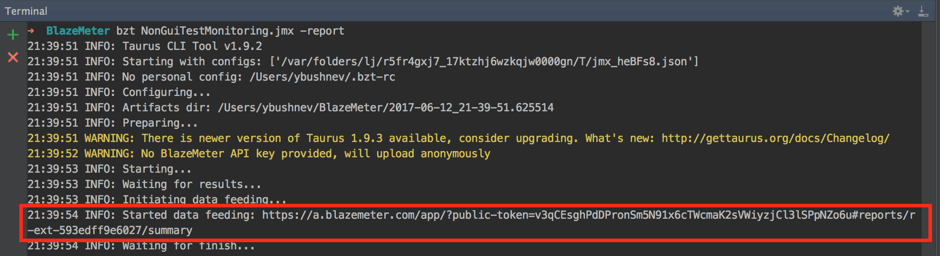
You can combine Taurus with BlazeMeter. By using just one command line parameter, you can still monitor results through your console, with the BlazeMeter results analysis. This will allow you to save all your test reports and perform additional analyses and metrics’ comparison afterward. All you need to do is to add one argument to the existing command:
> bzt NonGuiTestMonitoring.jmx -report Then, in the logs execution, you will find the link to real-time monitoring. The new browser tab will also be automatically opened during test execution.
In addition to all these methods, there is one more way to establish detailed monitoring: by integrating JMeter, InfluxDB, and Grafana. This method might suit you if you are able to spend more time on the configuration and maintenance of your solution. We will cover this solution in the next blog post, so stay tuned!
Published at DZone with permission of Yuri Bushnev. See the original article here.
Opinions expressed by DZone contributors are their own.
Comments