4 Free Web Pivot Tables You Should Try for Your Web Reporting
Web developers often have to find ways to represent data in their apps. In this post, we cover several different tools that can help.
Join the DZone community and get the full member experience.
Join For FreeWeb or web-based reporting tools are used to view, create, and/or edit reports using any web interface – let’s say a web browser. These tools can either be embedded in different third-party applications or be standalone. The primary purpose of web reporting is to organize data in an actionable format by using the web as the sole medium.
In the initial phases of data analysis, reporting plays a pivotal role. It is readily used to present data in an interactive and visually appealing manner that simplifies data analysis. The interactiveness greatly varies from one report to another, or from one platform to another. The basic web reporting tools are readily used to filter, sort, export, and drill through the different semantic data layers for effective analysis. All these functionalities give the end users the ability to conduct in-depth data analysis.
This proves how crucial web pivot tables are when it comes to web reporting. Thus, I have prepared a list of free and standalone web pivot table tools to help you enhance your web reporting experience:
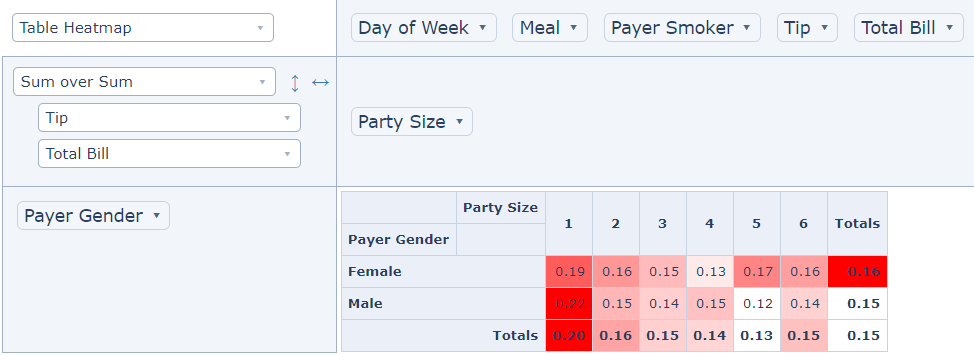
1. PivotTable.js

The primary function of this free web pivot table is to allow users easy data analysis and exploration offering a drag and drop support. Nicolas Kruchten originally created the PivotTable.js in CoffeeScript and built it on top of the jQuery and jQueryUI. Typically, users prefer this web pivot table because they can change the appearance by using a custom color scale – i.e. they can redefine the initial set of colors and later they have the option to customize as per their likings. Users can also utilize easy-to-understand and use filtering and grand total options.
This free web pivot grid offers localization support and has a built-in table, heat map, and table-bar chart renderers. PivotTable.js also offers add-ons enabling users to transform the pivot table into a pivot chart.
2. WebDataRocks Web Pivot Table
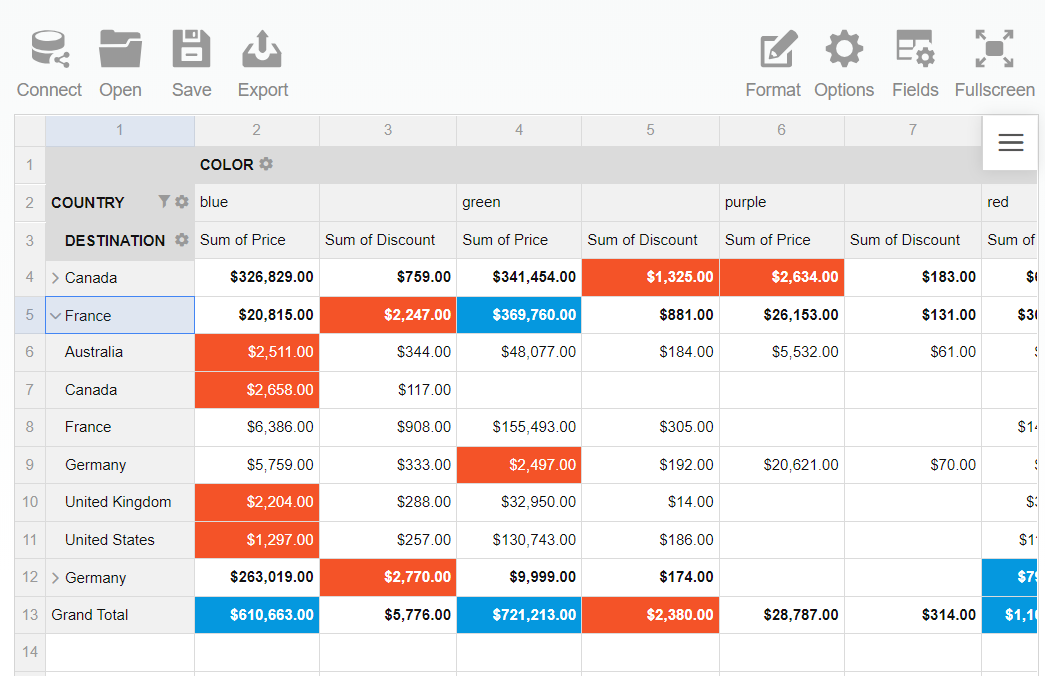
This web reporting tool for developers is one of the available options for those who are looking to use an efficient tool for data visualization and analysis. Written in JavaScript, it displays data available in CSV and JSON files in an engaging pivot table to help you understand the data better. It offers an enhanced web reporting experience where you can know the real-time data reports.
What’s better is that WebDataRocks provides numerous data analysis features to make web reporting easier for the users. This simple pivot control supports drag and drop, multiple data fields, grand totals and subtotals, localization, sorting, filtering, drill down, and more.
And it can be easily integrated with Angular!
In comparison with similar free web pivot grid tools, this one can also be used by not 'techie' people. It's designed more for all who want to quickly analyze their data in an efficient manner.
3. Orb.js
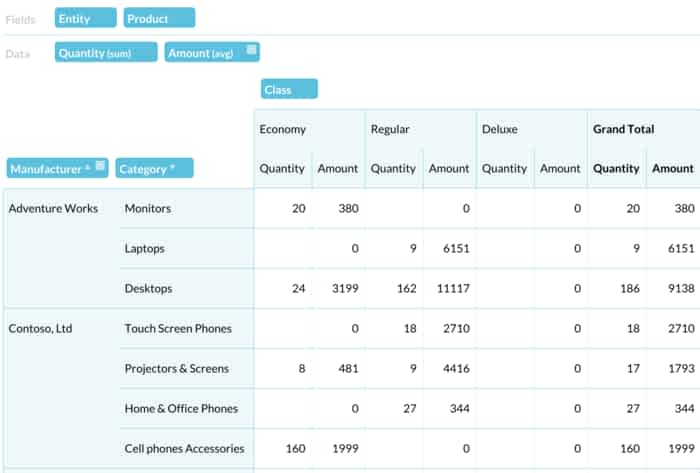
The tool is a React-based library that offers all the needed features a user may require for efficient data reporting and analysis. The JS pivot table comes with drag-and-drop support where you can move the fields using the cursor. Users can sort the data, drill down, and filter into suitable pivot grid data. The JavaScript pivot grid can also calculate subtotals and grand totals without any hassle. Users also enjoy the option of expanding or collapsing the subtotals.
Another great feature of Orb.js is that users can enable the fixed headers option. This pivot table is best known for its minimalistic and neat design allowing you to evaluate and analyze data efficiently in fast pivot grids. Orb.js is distributed freely under the MIT license.
4. React-Pivot Table
Another React-based library through which you can create pivot grid apps is React-Pivot Table that offers a drag-and-drop functionality. The web reporting tool can filter as well as evaluate grand totals. Users also have the option to change its appearance by using a custom scale color. This web pivot table is a React port of the jQuery-based PivotTable.js by Nicolas Kruchten.
The React-Pivot table offers localization support and has a built-in table, heat map, and table-bar chart renderers.
However, choosing the right web pivot tables depends on your specific individual and business needs. I have compiled a list of a few web pivot tables to help you make an informed decision.
Opinions expressed by DZone contributors are their own.
Comments