5 Popular Standalone JavaScript Spreadsheet Libraries
An overview to help you find the right solution for building web applications that can process large amounts of data.
Join the DZone community and get the full member experience.
Join For FreeIn this article, I’ll give a short overview of five popular standalone JavaScript spreadsheet libraries on the basis of their functionality and licensing policy. These libraries can be implemented in nonprofit projects for free and also offer paid licenses for commercial use. I hope this overview will help you find the right solution for building web apps aimed at processing large amounts of data.
Handsontable
Handsontable is said to be a JavaScript grid with spreadsheet look and feel. It’s a pure JavaScript library with support for React, Vue.js, and Angular. The list of its basic features includes the ability to collapse columns; resize, move, and hide columns and rows; and add comments, show column summary, export data, apply conditional formatting, use data validation, and add dropdown menus. It's also possible to sort and filter data and use the auto fill.

What’s more interesting is the list of advanced features. For example, developers can choose which renderer should be used when table rendering is triggered. Also, there’s the possibility to create custom plugins, use custom buttons, and define customized borders between the cells. Besides that, there are features such as multi-column sorting, nested headers, trimming rows, and others.
Handsontable provides two types of licenses: free Community license and Commercial license (prices on request).
My verdict: Handsontable is a great option for non-commercial projects and for those who are ready to pay for rich functionality.
ag-Grid
ag-Grid is a JavaScript grid/spreadsheet component that provides easy integration with Angular, Angular JS 1.x, React, Vue.js, Polymer, and Web Components with no third-party dependencies. It takes pride in its fast performance with dozens of rows, judging by this 100,000 rows demo.

The grouping and aggregation features allow users to work with the data the way they want. Data can be grouped by specific columns, and various aggregate column values can be displayed in the grouped row. ag-Grid provides a quick filtering feature and custom filters. Lazy loading allows displaying just the required amount of rows and requesting additional data as the user scrolls, which helps save server resources. ag-Grid supports real-time updates and can handle hundreds of updates per second. You can read more about these and other features and see some demos on the features overview page.
The library comes in two versions: Community and Enterprise. The Community version is covered by the MIT license and includes only basic features. The Enterprise license with all the available functionality has two options: Enterprise (from $999 per developer) and Enterprise Bundle (ag-Grid+agCharts, from $1498 per developer).
My verdict: ag-Grid provides lots of useful features and simple integration with different JS frameworks. It seems to be a good choice for big-budget projects as the licensing is quite flexible yet pricey.
DHTMLX Spreadsheet
DHTMLX Spreadsheet is a customizable JavaScript spreadsheet component with Material skin and an Excel-like interface. It is shipped with integration demos that make it much easier to use the Spreadsheet component in apps based on popular front-end frameworks (React, Angular, Vue, Svelte).

You can customize almost every element of this spreadsheet according to its user guide — for example, use the custom icon font pack for the toolbar, menu, and context menu controls instead of the Material-design one. A collection of customizable built-in themes (Light, Dark, Light High Contrast, and Dark High Contrast) allows you to quickly modify the look and feel of your spreadsheet.
The component comes with numerous built-in formulas (170+). They allow performing a wide range of numerical calculations and presenting textual information exactly the way you need without any code manipulations. All available formulas are fully compatible with Google and Excel Sheets. Another helpful feature of this Spreadsheet component is the ability to create multiple worksheets and simultaneously interact with their data with the help of cross-referencing. With features like column sorting, filtering by certain criteria, and data searching, finding specific information in large datasets becomes much quicker and more convenient.
There are plenty of useful options for working with cells such as select editor with cell validation, merging and splitting cells, multi-line cell content, and embedded hyperlinks. Cell formatting features allow you to:
- Benefit from automatic column width
- Change the text color and decoration and the background color
- Set text-align
- Apply different number formats to cell values (text, number, percent, currency, time, date, common) or add custom formats
- Resize columns, etc.
Strong localization capabilities for numeric formats ensure greater experience in international apps.
Apart from that, it is also possible to lock cells, plus enable the auto-filling of cells with content by typing data into cells and dragging the fill handle to prolong the series of numbers or letters in other cells. You can freeze any number of rows and columns of the Spreadsheet to keep them visible during scrolling.
DHTMLX Spreadsheet offers quite an extensive list of hotkeys for navigation. Also, the library gives an opportunity to import and export data from/to Excel files. For that purpose, the DHTMLX team implemented special open-source libraries Excel2Json and Json2Excel. Thanks to the support of TypeScript, you can incorporate the spreadsheet component in your app much faster using type suggestions, autocompletion, and type checking.
DHTMLX Spreadsheet provides four main licensing options:
- Individual License ($599 for 1 developer)
- Commercial License ($1,299 for up to 5 developers)
- Enterprise License ($2,899 for up to 20 developers)
- Ultimate License ($5,799 for unlimited number of developers)
My verdict: DHTMLX Spreadsheet provides a powerful combination of essential features, support for popular frameworks, and extensive customization options — making it a great value-for-money choice.
Webix Spreadsheet
Another player that brings the Excel-like experience to modern web apps is Webix JS SpreadSheet. The detailed documentation, user-friendly API, and smooth performance even with large datasets is what sets it apart from its competitors.
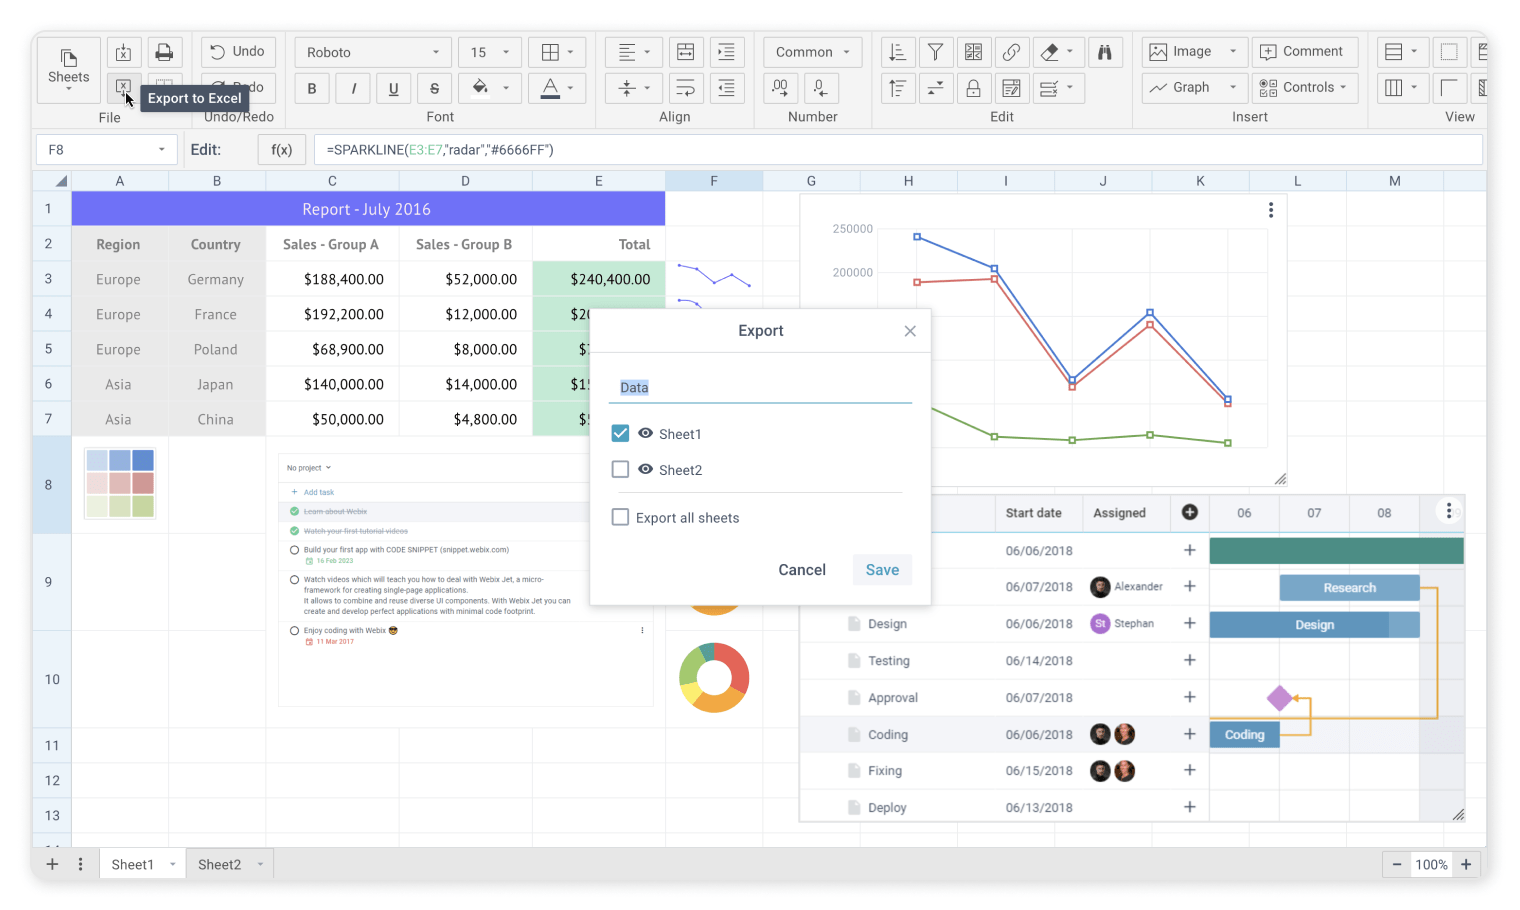
The component boasts a rich set of features, including 200+ Excel-like formulas and functions, cell styling, frozen rows/columns, multiple sheets in a single document, keyboard shortcuts and navigation, undo/redo history, and CSV/Excel export/import. It also grants full control over toolbar customization and event handling.
Scrolling through Webix's blog, I can note that their development team improves it in almost every release — for example, recently, users got the ability to export SpreadSheet images to Excel as well as to search for and replace data in cells.
The price for a commercial license starts at $798, which is valid perpetually, but for updates and technical support, you will have to shell out annually.
My verdict: Webix Spreadsheet is a nice option for developers who are developing high-performance apps and looking for a clean API and full control over the UI.
SlickGrid
SlickGrid is a neat and minimalist JavaScript spreadsheet component. Adaptive virtual scrolling allows for the handling of hundreds of thousands of rows without any lag. The library supports jQuery UI themes and enables wide customization. Users can resize, reorder, show, or hide columns as well as use grouping, filtering, custom aggregators, and other features. Pluggable cell formatters and editors allow you to expand the functionality of your web app.

As you can see, SlickGrid provides the basic set of features that can meet the needs of an average user. Unfortunately, according to the GitHub page of the project, this library hasn't received much attention from developers recently. The good news is that SlickGrid is available for free.
My verdict: SlickGrid can be a good option if you're not looking for rich functionality or can’t afford a commercial license.
Opinions expressed by DZone contributors are their own.
Comments