5 Tips for Proper Java Heap Size
By
 ·
·
Interview
·
·
Interview
Likes
(7)
Likes
There are no likes...yet! 👀
Be the first to like this post!
It looks like you're not logged in.
Sign in to see who liked this post!
Comment
Save
143.3K Views
Join the DZone community and get the full member experience.
Join For Free
Determination of proper Java Heap size for a production system is not a straightforward exercise. In my Java EE enterprise experience, I have seen multiple performance problem cases due to inadequate Java Heap capacity and tuning.
This article will provide you with 5 tips that can help you determine optimal Java Heap size, as a starting point, for your current or new production environment. Some of these tips are also very useful regarding the prevention and resolution of java.lang.OutOfMemoryError problems; including memory leaks.
Please note that these tips are intended to “help you” determine proper Java Heap size. Since each IT environment is unique, you are actually in the best position to determine precisely the required Java Heap specifications of your client’s environment. Some of these tips may also not be applicable in the context of a very small Java standalone application but I still recommend you to read the entire article.
Future articles will include tips on how to choose the proper Java VM garbage collector type for your environment and applications.
#1 – JVM: you always fear what you don't understand
How can you expect to configure, tune and troubleshoot something that you don’t understand? You may never have the chance to write and improve Java VM specifications but you are still free to learn its foundation in order to improve your knowledge and troubleshooting skills. Some may disagree, but from my perspective, the thinking that Java programmers are not required to know the internal JVM memory management is an illusion.
Java Heap tuning and troubleshooting can especially be a challenge for Java & Java EE beginners. Find below a typical scenario:
- Your client production environment is facing OutOfMemoryError on a regular basis and causing lot of business impact. Your support team is under pressure to resolve this problem
- A quick Google search allows you to find examples of similar problems and you now believe (and assume) that you are facing the same problem
- You then grab JVM -Xms and -Xmx values from another person OutOfMemoryError problem case, hoping to quickly resolve your client’s problem
- You then proceed and implement the same tuning to your environment. 2 days later you realize problem is still happening (even worse or little better)…the struggle continues…
What went wrong?
- You failed to first acquire proper understanding of the root cause of your problem
- You may also have failed to properly understand your production environment at a deeper level (specifications, load situation etc.). Web searches is a great way to learn and share knowledge but you have to perform your own due diligence and root cause analysis
- You may also be lacking some basic knowledge of the JVM and its internal memory management, preventing you to connect all the dots together
My #1 tip and recommendation to you is to learn and understand the basic JVM principles along with its different memory spaces. Such knowledge is critical as it will allow you to make valid recommendations to your clients and properly understand the possible impact and risk associated with future tuning considerations. Now find below a quick high level reference guide for the Java VM:
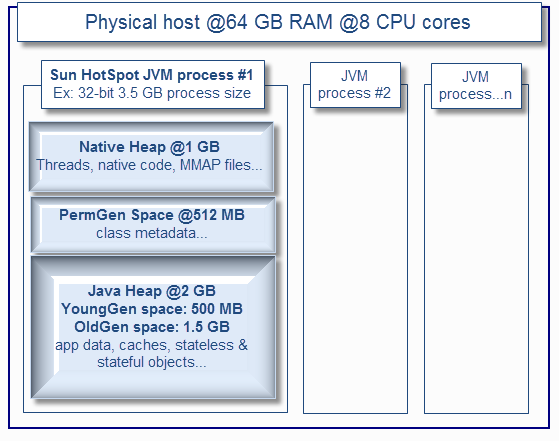
The Java VM memory is split up to 3 memory spaces:
- The Java Heap. Applicable for all JVM vendors, usually split between YoungGen (nursery) & OldGen (tenured) spaces.
- The PermGen (permanent generation). Applicable to the Sun HotSpot VM only (PermGen space will be removed in future Java 7 or Java 8 updates)
- The Native Heap (C-Heap). Applicable for all JVM vendors.
I recommend that you review each article below, including Sun white paper on the HotSpot Java memory management. I also encourage you to download and look at the OpenJDK implementation.
## Sun HotSpot VM
## IBM VM
## Oracle JRockit VM
## Sun (Oracle) – Java memory management white paper
## OpenJDK – Open-source Java implementation
As you can see, the Java VM memory management is more complex than just setting up the biggest value possible via –Xmx. You have to look at all angles, including your native and PermGen space requirement along with physical memory availability (and # of CPU cores) from your physical host(s).
It can get especially tricky for 32-bit JVM since the Java Heap and native Heap are in a race. The bigger your Java Heap, smaller the native Heap. Attempting to setup a large Heap for a 32-bit VM e.g .2.5 GB+ increases risk of native OutOfMemoryError depending of your application(s) footprint, number of Threads etc. 64-bit JVM resolves this problem but you are still limited to physical resources availability and garbage collection overhead (cost of major GC collections go up with size). The bottom line is that the bigger is not always the better so please do not assume that you can run all your 20 Java EE applications on a single 16 GB 64-bit JVM process.
#2 – Data and application is king: review your static footprint requirement
Your application(s) along with its associated data will dictate the Java Heap footprint requirement. By static memory, I mean “predictable” memory requirements as per below.
- Determine how many different applications you are planning to deploy to a single JVM process e.g. number of EAR files, WAR files, jar files etc. The more applications you deploy to a single JVM, higher demand on native Heap
- Determine how many Java classes will be potentially loaded at runtime; including third part API’s. The more class loaders and classes that you load at runtime, higher demand on the HotSpot VM PermGen space and internal JIT related optimization objects
- Determine data cache footprint e.g. internal cache data structures loaded by your application (and third party API’s) such as cached data from a database, data read from a file etc. The more data caching that you use, higher demand on the Java Heap OldGen space
- Determine the number of Threads that your middleware is allowed to create. This is very important since Java threads require enough native memory or OutOfMemoryError will be thrown
For example, you will need much more native memory and PermGen space if you are planning to deploy 10 separate EAR applications on a single JVM process vs. only 2 or 3. Data caching not serialized to a disk or database will require extra memory from the OldGen space.
Try to come up with reasonable estimates of the static memory footprint requirement. This will be very useful to setup some starting point JVM capacity figures before your true measurement exercise (e.g. tip #4). For 32-bit JVM, I usually do not recommend a Java Heap size high than 2 GB (-Xms2048m, -Xmx2048m) since you need enough memory for PermGen and native Heap for your Java EE applications and threads.
This assessment is especially important since too many applications deployed in a single 32-bit JVM process can easily lead to native Heap depletion; especially in a multi threads environment.
For a 64-bit JVM, a Java Heap size of 3 GB or 4 GB per JVM process is usually my recommended starting point.
#3 – Business traffic set the rules: review your dynamic footprint requirement
Your business traffic will typically dictate your dynamic memory footprint. Concurrent users & requests generate the JVM GC “heartbeat” that you can observe from various monitoring tools due to very frequent creation and garbage collections of short & long lived objects. As you saw from the above JVM diagram, a typical ratio of YoungGen vs. OldGen is 1:3 or 33%.
For a typical 32-bit JVM, a Java Heap size setup at 2 GB (using generational & concurrent collector) will typically allocate 500 MB for YoungGen space and 1.5 GB for the OldGen space.
Minimizing the frequency of major GC collections is a key aspect for optimal performance so it is very important that you understand and estimate how much memory you need during your peak volume.
Again, your type of application and data will dictate how much memory you need. Shopping cart type of applications (long lived objects) involving large and non-serialized session data typically need large Java Heap and lot of OldGen space. Stateless and XML processing heavy applications (lot of short lived objects) require proper YoungGen space in order to minimize frequency of major collections.
Example:
- You have 5 EAR applications (~2 thousands of Java classes) to deploy (which include middleware code as well…)
- Your native heap requirement is estimated at 1 GB (has to be large enough to handle Threads creation etc.)
- Your PermGen space is estimated at 512 MB
- Your internal static data caching is estimated at 500 MB
- Your total forecast traffic is 5000 concurrent users at peak hours
- Each user session data footprint is estimated at 500 K
- Total footprint requirement for session data alone is 2.5 GB under peak volume
As you can see, with such requirement, there is no way you can have all this traffic sent to a single JVM 32-bit process. A typical solution involves splitting (tip #5) traffic across a few JVM processes and / or physical host (assuming you have enough hardware and CPU cores available).
However, for this example, given the high demand on static memory and to ensure a scalable environment in the long run, I would also recommend 64-bit VM but with a smaller Java Heap as a starting point such as 3 GB to minimize the GC cost. You definitely want to have extra buffer for the OldGen space so I typically recommend up to 50% memory footprint post major collection in order to keep the frequency of Full GC low and enough buffer for fail-over scenarios.
Most of the time, your business traffic will drive most of your memory footprint, unless you need significant amount of data caching to achieve proper performance which is typical for portal (media) heavy applications. Too much data caching should raise a yellow flag that you may need to revisit some design elements sooner than later.
#4 – Don’t guess it, measure it!
At this point you should:
- Understand the basic JVM principles and memory spaces
- Have a deep view and understanding of all applications along with their characteristics (size, type, dynamic traffic, stateless vs. stateful objects, internal memory caches etc.)
- Have a very good view or forecast on the business traffic (# of concurrent users etc.) and for each application
- Some ideas if you need a 64-bit VM or not and which JVM settings to start with
- Some ideas if you need more than one JVM (middleware) processes
But wait, your work is not done yet. While this above information is crucial and great for you to come up with “best guess” Java Heap settings, it is always best and recommended to simulate your application(s) behaviour and validate the Java Heap memory requirement via proper profiling, load & performance testing.
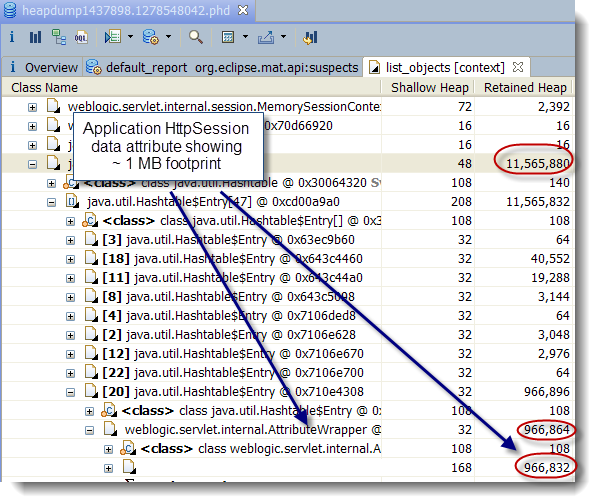
You can learn and take advantage of tools such as JProfiler (future articles will include tutorials on JProfiler). From my perspective, learning how to use a profiler is the best way to properly understand your application memory footprint. Another approach I use for existing production environments is heap dump analysis using the Eclipse MAT tool. Heap Dump analysis is very powerful and allow you to view and understand the entire memory footprint of the Java Heap, including class loader related data and is a must do exercise in any memory footprint analysis; especially memory leaks.
Java profilers and heap dump analysis tools allow you to understand and validate your application memory footprint, including detection and resolution of memory leaks. Load and performance testing is also a must since this will allow you to validate your earlier estimates by simulating your forecast concurrent users. It will also expose your application bottlenecks and allow you to further fine tune your JVM settings. You can use tools such as Apache JMeter which is very easy to learn and use or explore other commercial products.
Finally, I have seen quite often Java EE environments running perfectly fine until the day where one piece of the infrastructure start to fail e.g. hardware failure. Suddenly the environment is running at reduced capacity (reduced # of JVM processes) and the whole environment goes down. What happened?
There are many scenarios that can lead to domino effects but lack of JVM tuning and capacity to handle fail-over (short term extra load) is very common. If your JVM processes are running at 80%+ OldGen space capacity with frequent garbage collections, how can you expect to handle any fail-over scenario?
Your load and performance testing exercise performed earlier should simulate such scenario and you should adjust your tuning settings properly so your Java Heap has enough buffer to handle extra load (extra objects) at short term. This is mainly applicable for the dynamic memory footprint since fail-over means redirecting a certain % of your concurrent users to the available JVM processes (middleware instances).
#5 – Divide and conquer
At this point you have performed dozens of load testing iterations. You know that your JVM is not leaking memory. Your application memory footprint cannot be reduced any further. You tried several tuning strategies such as using a large 64-bit Java Heap space of 10 GB+, multiple GC policies but still not finding your performance level acceptable?
In my experience I found that, with current JVM specifications, proper vertical and horizontal scaling which involved creating a few JVM processes per physical host and across several hosts will give you the throughput and capacity that you are looking for. Your IT environment will also more fault tolerant if you break your application list in a few logical silos, with their own JVM process, Threads and tuning values.
This “divide and conquer” strategy involves splitting your application(s) traffic to multiple JVM processes and will provide you with:
- Reduced Java Heap size per JVM process (both static & dynamic footprint)
- Reduced complexity of JVM tuning
- Reduced GC elapsed and pause time per JVM process
- Increased redundancy and fail-over capabilities
- Aligned with latest Cloud and IT virtualization strategies
The bottom line is that when you find yourself spending too much time in tuning that single elephant 64-bit JVM process, it is time to revisit your middleware and JVM deployment strategy and take advantage of vertical & horizontal scaling. This implementation strategy is more taxing for the hardware but will really pay off in the long run.
Please provide any comment and share your experience on JVM Heap sizing and tuning.
Java (programming language)
garbage collection
Java virtual machine
Memory (storage engine)
application
Published at DZone with permission of Pierre - Hugues Charbonneau. See the original article here.
Opinions expressed by DZone contributors are their own.
Comments