Top 5 Visualization Tool Types for 2020
There are a number of visualization tools that can help provide a single source of visual truth for development projects.
Join the DZone community and get the full member experience.
Join For FreeVisualization involves the imagination to create various scenarios in our minds. Thus, whenever an individual visualizes any task, he/she creates a mental context about it. Today, visualization technique has become a significant thing associated with web development and an effective way to pass any message to draw the attention of prospects or to clear ambiguous terms and patterns based on presenting any data in a visual manner.
Hence, in order to narrate any story or explain any specific pattern, experts of the web development industry have come up with popular visualization technologies and visualization tools to make the entire job of web development an easy task. Here we will discuss 5 such visualization technologies that will make the web development job easy.
1. Scrum Visualization Tool
A Scrum visualization tool utilizes a lightweight and simple structure to allow flexibility and significant changes from the beginning of any project to the release of a particular product. The main benefit of Scrum is that it allows several revisions of any product to remain under the construction process. Each revision thus manufactures a shippable product, while iterations bring improvement in the functionality of the product as compared to the previous one.
Artifacts Available for Scrum Project
Product Backlog
The product backlog consists of a huge collection of user stories, a prioritized list of customers’ wants in any manufactured final product.
Sprint Backlog
The Sprint backlog incorporates user stories or tasks, which the team of Scrum decides to develop while it performs revision of a particular product.
Increment
Once a team accomplishes a particular Sprint, it makes a new Increment of the respective product. Thus, the Increment is the result of a particular Sprint.
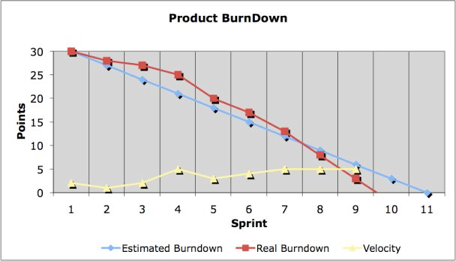
Scrum and Burndown Chart
A Scrum tool is responsible for indicating the exact amount of time spent already and the remaining time for the completion of any particular project. The chart represents Sprints on its horizontal axis while a pending the number of hours for the coming Sprint on its vertical axis. Once team members complete a particular task in a Sprint, Scrum updates the chart to inform the team about the pending number of hours.
2. Agile Visualization Tool
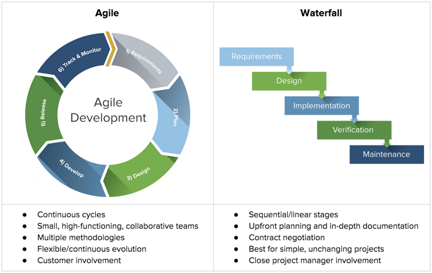
An Agile visualization tool has proven to be successful whenever small teams collaborate for a long duration with various other project stakeholders. "Agile involves project management method in accordance with incremental and iterative methods related to managing any product design," said Kshitij Saxena, a product lead at Microsoft.
Subsets/Elements of Agile Technology:
- Collaboration
- Communication
- Significance of Software
- Flexibility
3. Big Data Visualization Tool
Big data analytics has a major role based on reducing the overall data size and complexity associated with big data applications. Visualization acts as an important approach to help big data in providing a complete view of data and discovery of data values. Big data analytics, as well as its visualization, requires seamless integration, so that both of them may work in the best way as possible in various big data applications.
Common Big Data Visualization Tools
Word Clouds
Word clouds give companies a good idea about using words. Words present in the cloud platform are of varying sizes and their frequencies depend solely on their size. The technique is helpful in customers’ behavior or sentimental analysis of customers in various social media posts.
Symbol Maps
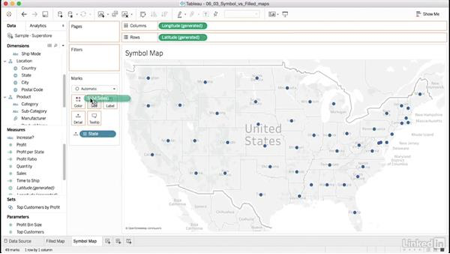
Symbol maps refer to maps, which contain symbols in them. Here, symbols differ in terms of size to make the job of comparison quite easy.
Connectivity Charts
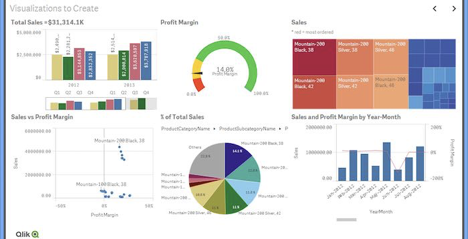
Connectivity charts highlight links between different events or phenomena. For instance, charts are able to highlight relationships between machinery triggers and failures, along with the overall strengths related to these connections.
4. Kanban Visualization Tool
Kanban word implies a visual card, used mainly for controlling inventories in any manufacturing or construction production line.
Objectives of the Tool
The Kanban system intends to fulfill the following key objectives:
- Demand-driven system
- Consistent improvement via elimination of waste
- JIT production
- Visual management
Kanban Cards
The Kanban system highlights the sale of any item and the beginning of any new task in the complete production process. Inventory requires restocking and new product requires production. In this way, Kanban card visualization gives support to the complete production process.
Key Principles of Kanban System
Work Visualization
The system makes the work visible to achieve improved management and to identify bottlenecks as well as queues.
Limit in Work in Progress
Kanban tool boosts focus and sets priorities to manage the overload by keeping enough margins. Thus, with appropriate work in progress, the team achieves proper workflow rather than facing boredom.
Workflow Analysis
Analysis of the workflow helps in achieving improved productivity and consistent smoothness in the complete flow of tasks.
Consistent Improvement
Kanban system improves the team’s effectiveness consistently with the main objective of workflow and system improvement.
Kanban and Software Development
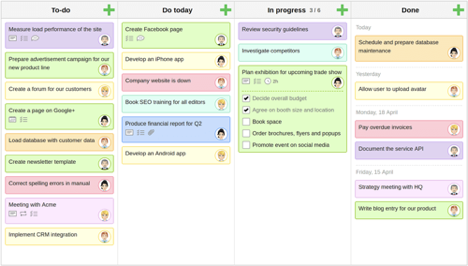
Software developers opt for a white-colored magnetic wipe board or any other similar surface, where they draw and stick important notes. The board may consist of different columns to visualize a particular stage of any task, which include:
- Commotion task list
- Formulation of plan
- Ongoing or completed development
- Testing phase
- Deployment
- Completion
5. Tableau Visualization Tool
Tableau has obtained wide application in Business Intelligence and web development activities. This helps in the creation of charts and graphs in the form of worksheets and dashboards with the aim to deliver powerful business insights.
Styles of Charts Created with Tableau
Treemaps
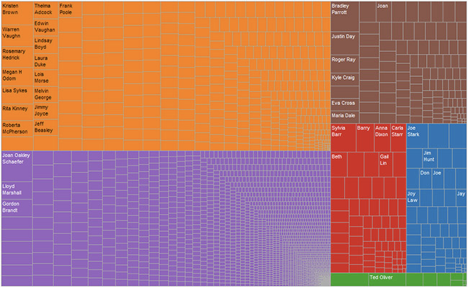
Treemaps act as compact and powerful ways to visualize part-to-whole and hierarchical relations.
Histogram
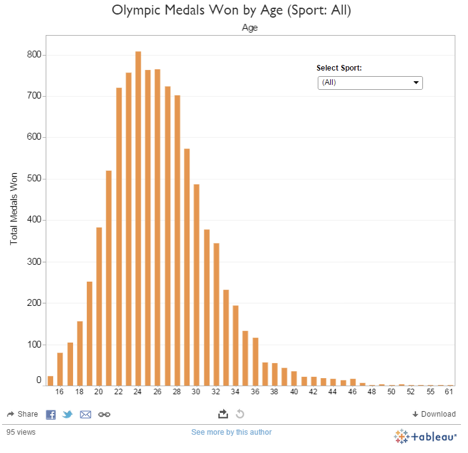
A histogram plots the exact numbers of occurrences related to any given variable within a specific data set. It is also an excellent tool to get an overview of the complete variable distribution and such plots are available as bar charts.
Box Plot
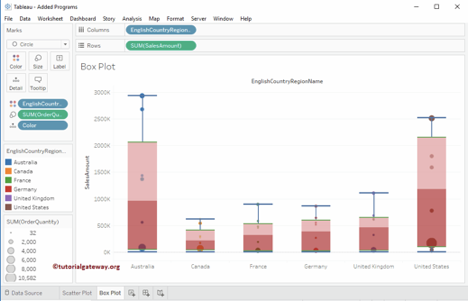
A box plot refers to a data distribution diagram known popularly to highlight the mentioned values-
- First quartile
- Third quartile
- Median
- Whiskers
- Outliers
Box plots have found their applications in the comparison of data sets, particularly whenever there is any variation in the available data.
Published at DZone with permission of Ved Prakash. See the original article here.
Opinions expressed by DZone contributors are their own.

Comments