

7 JavaScript Libraries for Dashboards
There are a lot of different JavaScript libraries out there. Here are 7 great ones to check out for your next JavaScript project.
Dashboard is a visual indicator of an objective or a business process. It is an invaluable tool for cutting through data clutter and getting down to the essentials. It helps you to evaluate information and allow to make the correct decision in a timely manner. Live visual dashboards consist of charts, maps, graphic symbols, data tables, etc.
There are several open source or commercial libraries for creating dashboards. In this article, I will show you some of the JavaScript libraries that will help you create beautiful and customizable dashboards for your projects.
Gridster.js
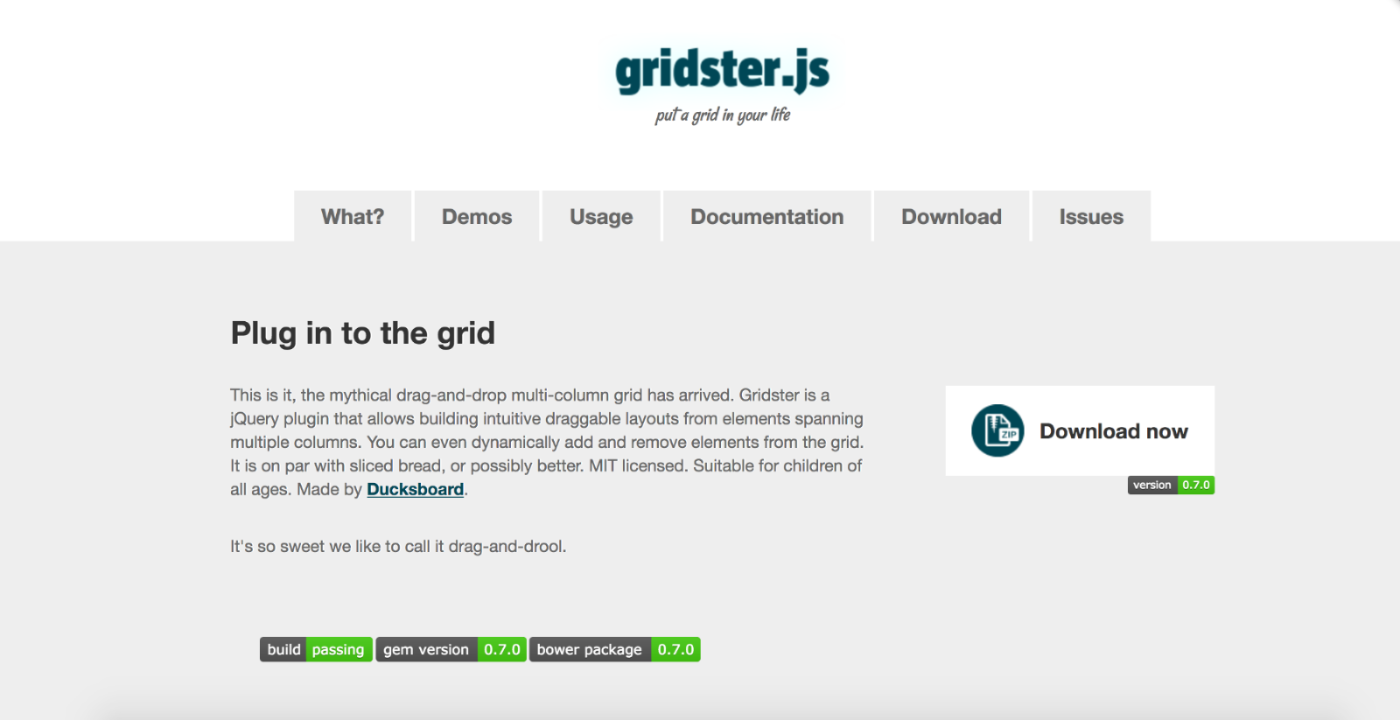
Gridster is a jQuery plugin that makes building intuitive draggable layouts from elements spanning multiple columns.
It lets you add or remove widgets dynamically from the grid. It is even possible to get a JavaScript array of objects with positions of all widgets and use it later to load them dynamically.
Check out the documentation for more information.
angular-gridster
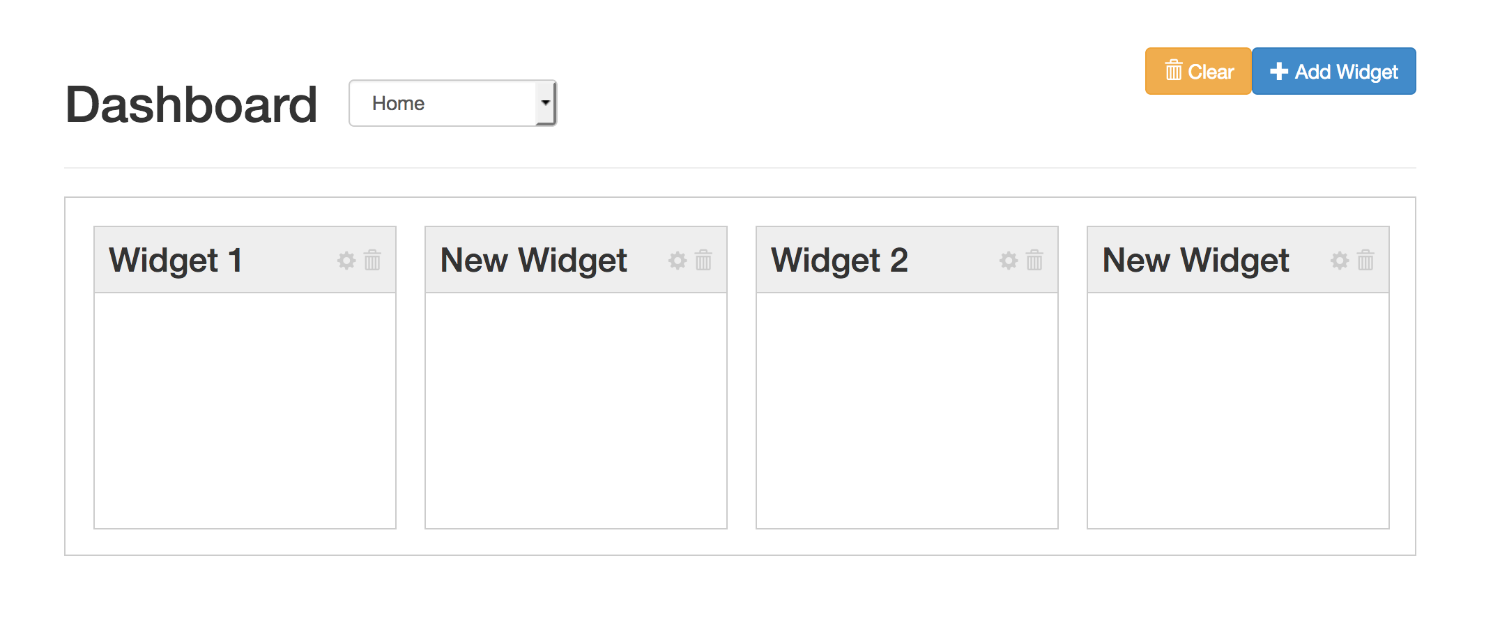
It is an implementation of gridster-like widgets for Angular JS. It has features like jQuery gridster plugin, but with some additional features.
It is completely re-written using Angular directives and allows usage of Angular data binding. Check out their documentation for more information.
gridstack.js
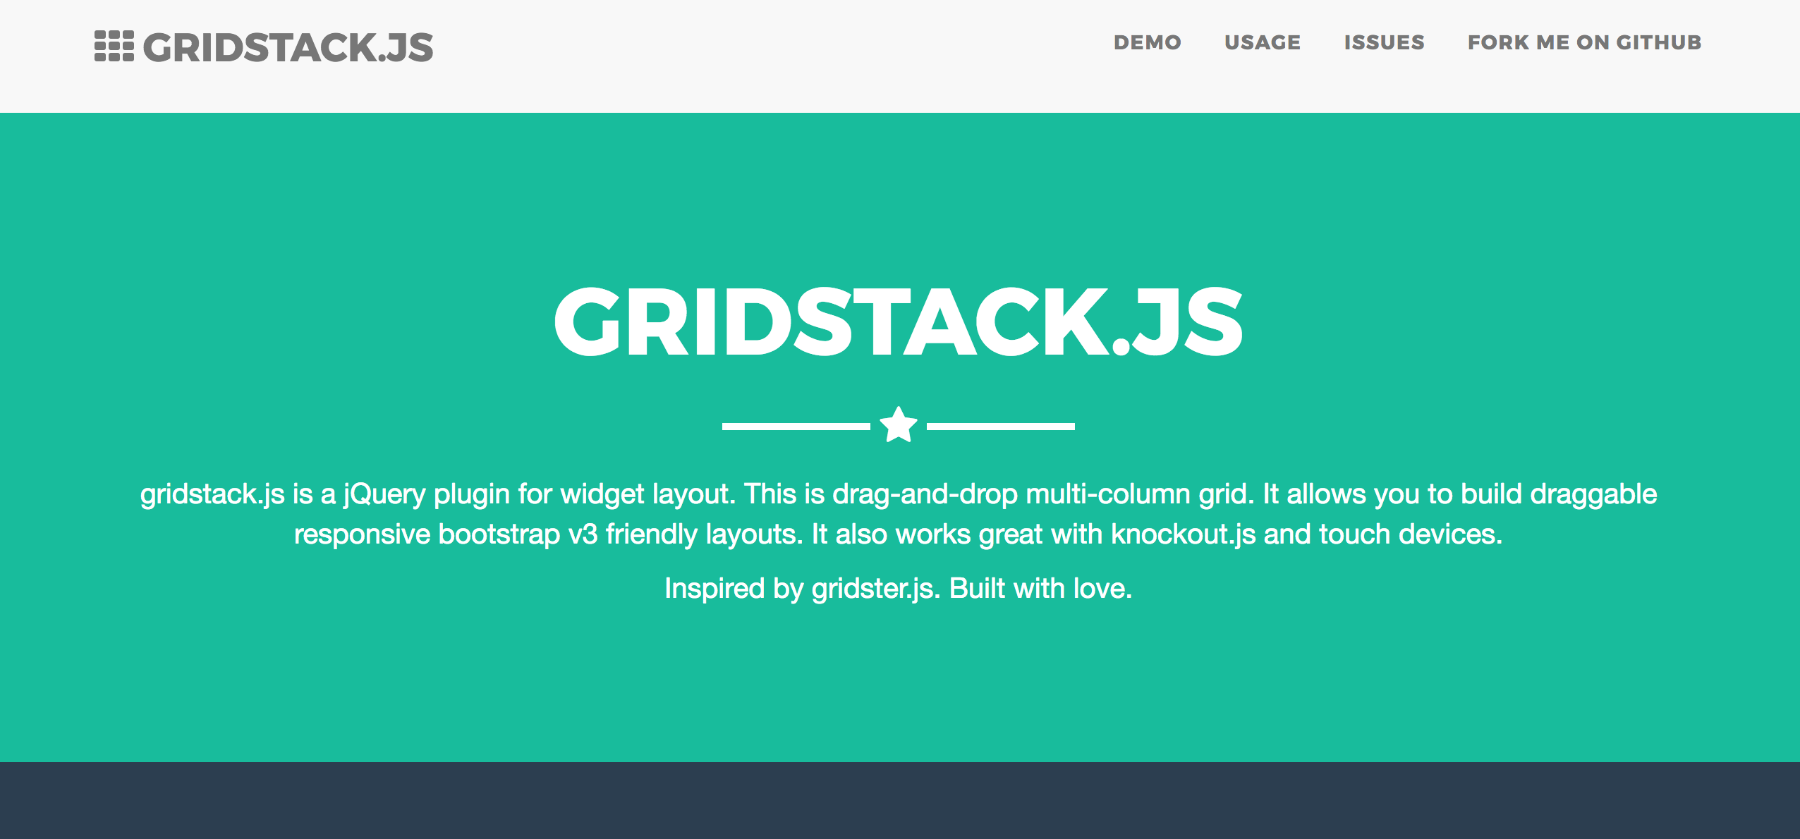
gridstack.js is a jQuery plugin for widget layout and it was inspired by gridster.js. It is drag-and-drop multi-column grid. It allows you to build draggable responsive bootstrap v3 friendly layouts.
It also works great with knockout.js, angular.js and touch devices. Check out gridstack.js documentation.
jQuery Gridly
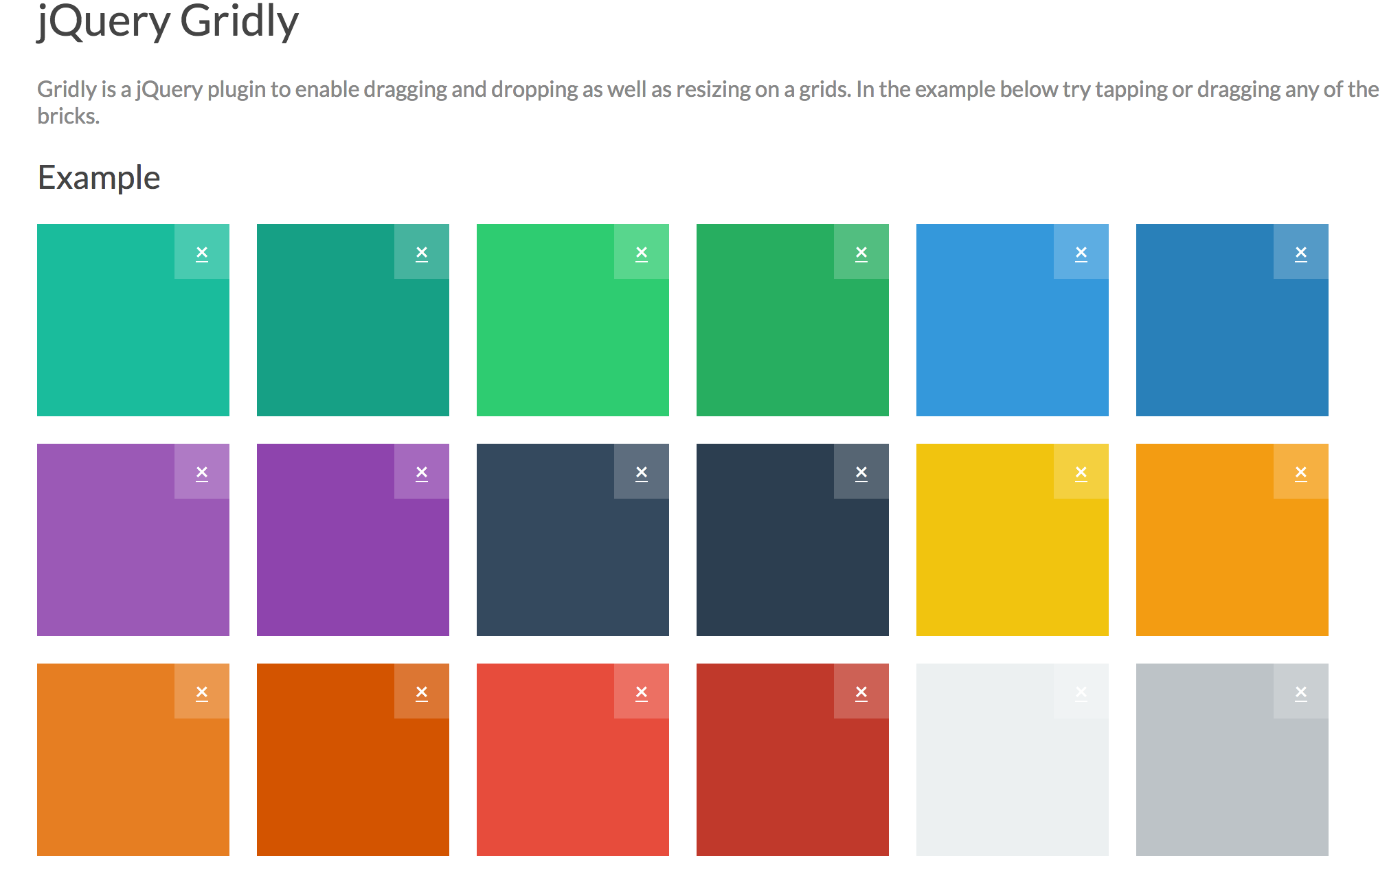
Gridly is a jQuery plugin to enable dragging and dropping as well as resizing on a grid. Have a look at Gridly here.
Packery
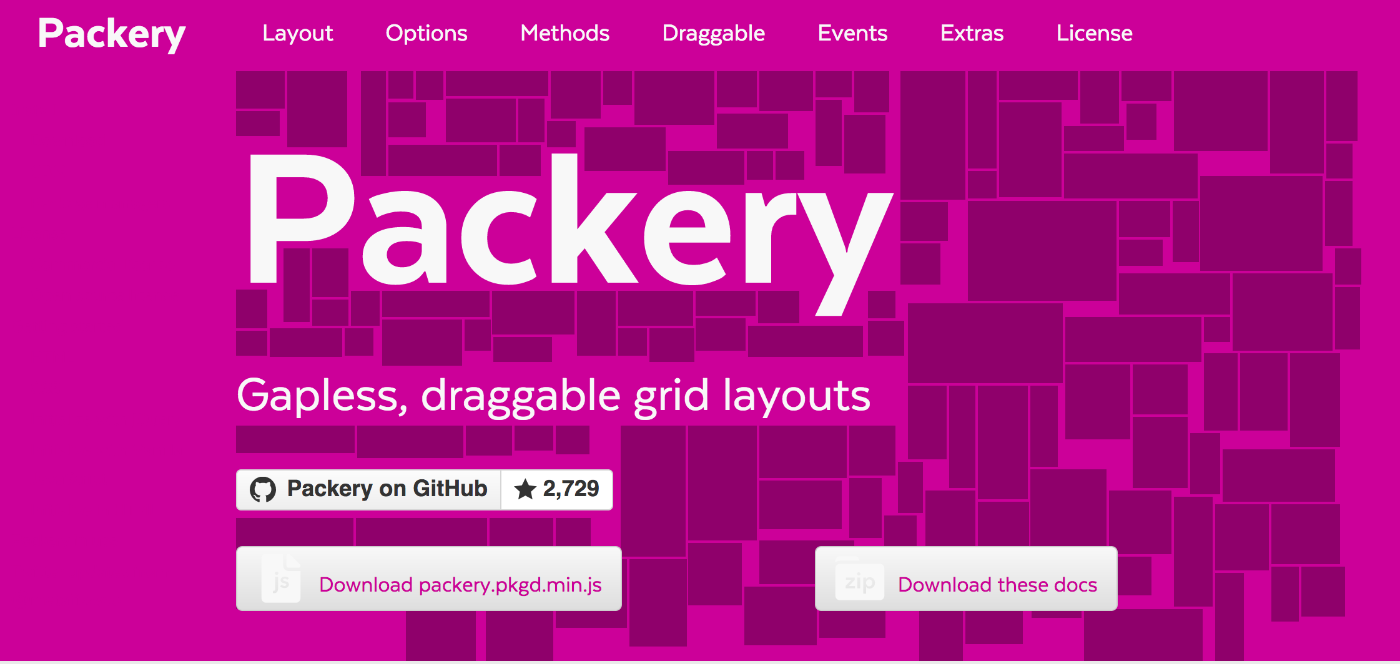
Packery is a JavaScript library and jQuery plugin that makes gapless and draggable layouts. It uses a bin-packing algorithm to fill in empty gaps.
It is suitable for creating a draggable dashboard and seamless Masonry image galleries. Check out Packery here.
GridList
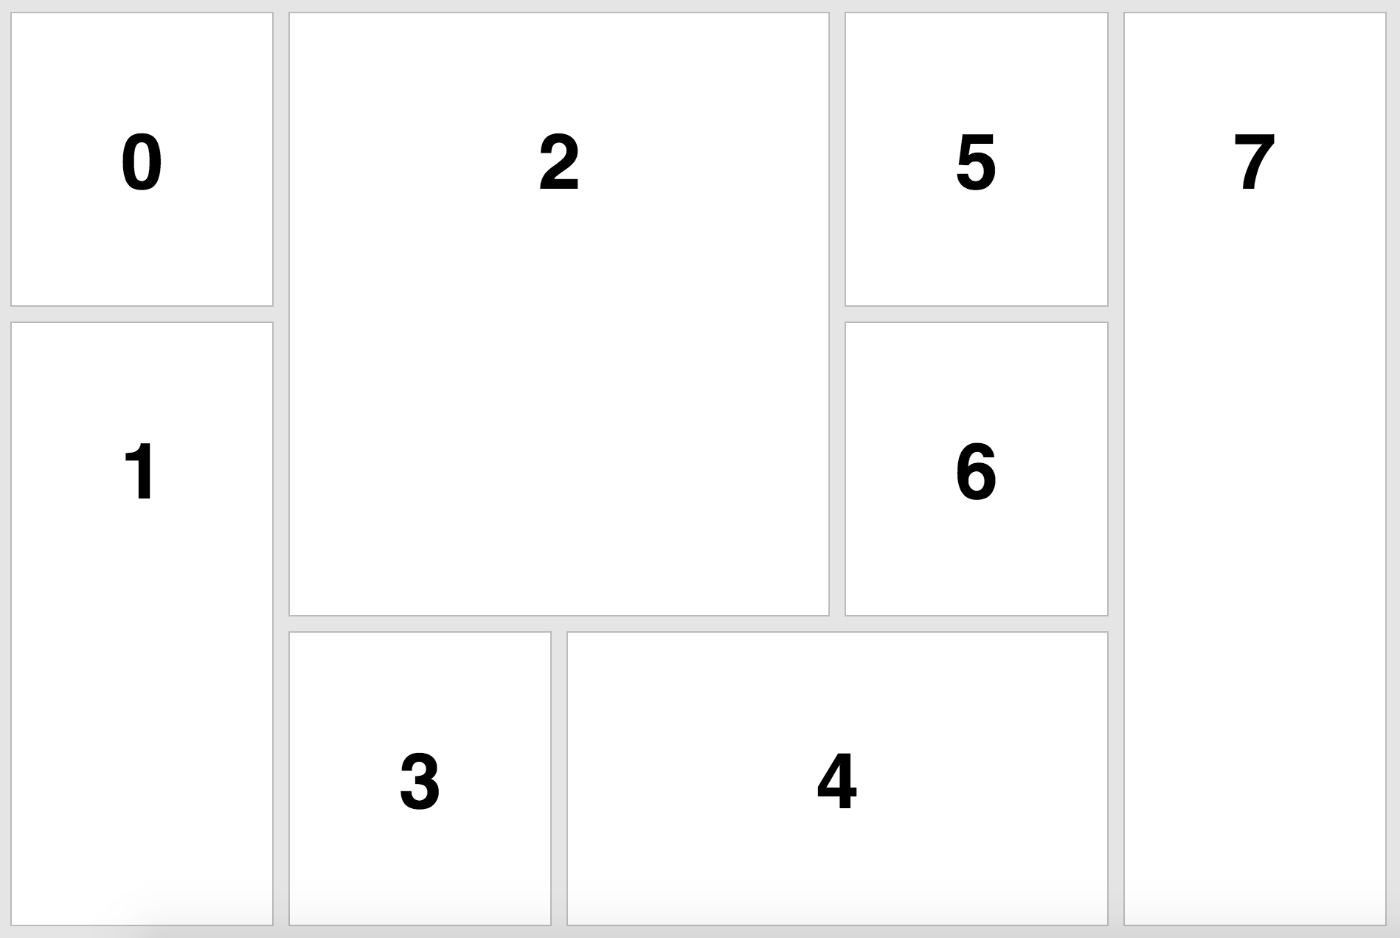
A jQuery library built on top of the GridList class that translates the generic items' positions into responsive DOM elements with drag and drop capabilities.
Look at the demo here.
Dazzle
Dazzle is a library for building dashboards with React JS. Dazzle does not depend on any front-end libraries but it makes it easier to integrate with them.
It lets you have a grid based layout, add or remove widgets, and drag and drop widgets. Demo can be viewed here.
Conclusion
Ultimately, the library you choose to invest in will come down to personal preference and the type of projects you and your team work on. Hence, choose the one that fits your project needs and save time and money.
Published at DZone with permission of Swathi Prasad. See the original article here.
Opinions expressed by DZone contributors are their own.