7 JVM Arguments of Highly Effective Applications
Join the DZone community and get the full member experience.
Join For FreeAt the time (March 2020) of writing this article, there are 600+ arguments that you can pass to JVM just around garbage collection and memory. If you include other aspects, the number of JVM arguments will easily cross 1000+. It’s way too many arguments for anyone to digest and comprehend. In this article, we will highlight seven important JVM arguments that you may find useful.
1. -Xmx and -XX:MaxMetaspaceSize
-Xmx is probably the most important JVM argument. -Xmx defines the maximum amount of heap size you are allocating to your application. (To learn about different memory regions in a JVM, you may watch this short video clip). You can define your application’s heap size like this:
xxxxxxxxxx
-Xmx2g
Heap size plays a critical role in determining your:
a. Application performance.
b. Bill, that you are going to get from your cloud provider (AWS, Azure, etc.)
This brings up the question, what is the right heap size for my application? Should I allocate a large heap size or small heap size for my application? The answer is: "It depends." In this article, we have shared our thoughts on whether you need to go with large or small heap size.
Metaspace is the region where JVM’s metadata definitions, such as class definitions, method definitions, will be stored. By default, the amount of memory that can be used to store this metadata information is unlimited (i.e. limited by your container or machine’s RAM size). You need to use: XX:MaxMetaspaceSize argument to specify an upper limit on the amount of memory that can be used to store metadata information.
xxxxxxxxxx
-XX:MaxMetaspaceSize=256m
2. GC Algorithm
As of March 2020, there are 7 different GC algorithms in OpenJDK:
- Serial GC.
- Parallel GC.
- Concurrent Mark and Sweep GC.
- G1 GC.
- Shenandoah GC.
- Z GC.
- Epsilon GC.
If you don’t specify the GC algorithm explicitly, then JVM will choose the default algorithm. Until Java 8, Parallel GC is the default GC algorithm. Since Java 9, G1 GC is the default GC algorithm.
The selection of the GC algorithm plays a crucial role in determining the application’s performance. Based on our research, we are observing excellent performance results with the Z GC algorithm. If you are running with JVM 11+, then you may consider using the Z GC algorithm (i.e. -XX:+UseZGC). More details about the Z GC algorithm can be found here.
The following table summarizes the JVM argument that you need to pass to activate each type of Garbage Collection algorithm.
| GC Algorithm | JVM argument |
| Serial GC | -XX:+UseSerialGC |
| Parallel GC | -XX:+UseParallelGC |
| Concurrent Market & Sweep (CMS) GC | -XX:+UseConcMarkSweepGC |
| G1 GC | -XX:+UseG1GC |
| Shenandoah GC | -XX:+UseShenandoahGC |
| Z GC | -XX:+UseZGC |
| Epsilon GC | -XX:+UseEpsilonGC |
3. Enable GC Logging
Garbage Collection logs contain information about Garbage Collection events, memory reclaimed, pause time duration, etc. You can enable the garbage collection log by passing following JVM arguments:
From JDK 1 to JDK 8:
xxxxxxxxxx
-XX:+PrintGCDetails -XX:+PrintGCDateStamps -Xloggc:{file-path}
From JDK 9 and above:
xxxxxxxxxx
-Xlog:gc*:file={file-path}
Example:
xxxxxxxxxx
-XX:+PrintGCDetails -XX:+PrintGCDateStamps -Xloggc:/opt/workspace/myAppgc.log
-Xlog:gc*:file=/opt/workspace/myAppgc.log
Typically, GC logs are used for tuning garbage collection performance. However, GC logs contain vital micro metrics. These metrics can be used for forecasting an application’s availability and performance characteristics.
In this article, we would like to highlight one such micrometric: ‘GC Throughput‘ (to read more on other available micrometrics, you may refer to this article). GC Throughput is the amount of time your application spends in processing customer transactions verse the amount of time it spends in processing GC activities. If your application’s GC throughput is 98%, then it means your application is spending 98% of its time in processing customer activity, and the remaining 2% is spent in GC activity.
Now, let’s look at the heap usage graph of a healthy JVM: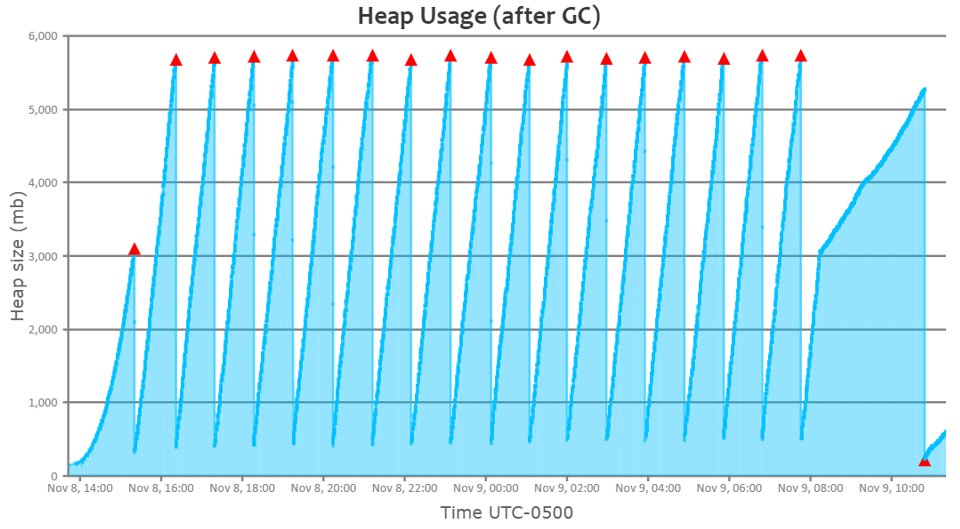
You can see a perfect saw-tooth pattern. You can notice that when Full GC (red triangle) runs, memory utilization drops all the way to bottom.
Now, let’s look at the heap usage graph of a sick JVM: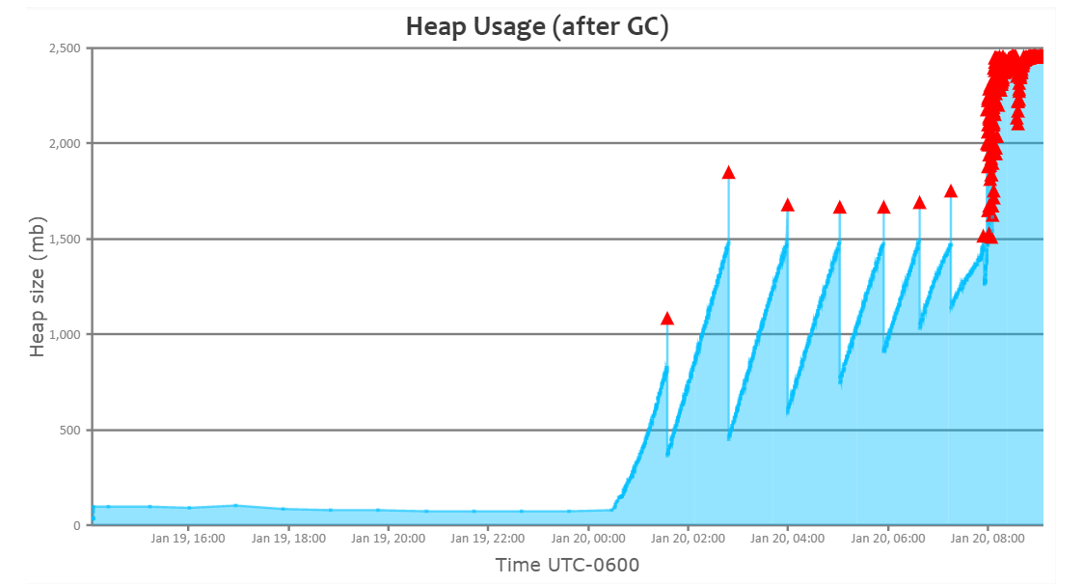
You can notice towards the right end of the graph, even though GC repeatedly runs, memory utilization isn’t dropping. It’s a classic indication that the application is suffering from some sort of memory problem.
If you take a closer look at the graph, you will notice that repeated full GC’s started to happen right around 8 am. However, the application starts to get an OutOfMemoryError only around 8:45 am. Till 8 am, the application’s GC throughput was about 99%.
But right after 8 am, GC throughput started to drop down to 60%. Because, when repeated GC runs, the application wouldn’t be processing any customer transactions and it will only be doing GC activity. As a proactive measure, if you notice GC throughput starting to drop, you can take out the JVM from the load balancer pool. So that unhealthy JVM will not process any new traffic. It will minimize customer impact.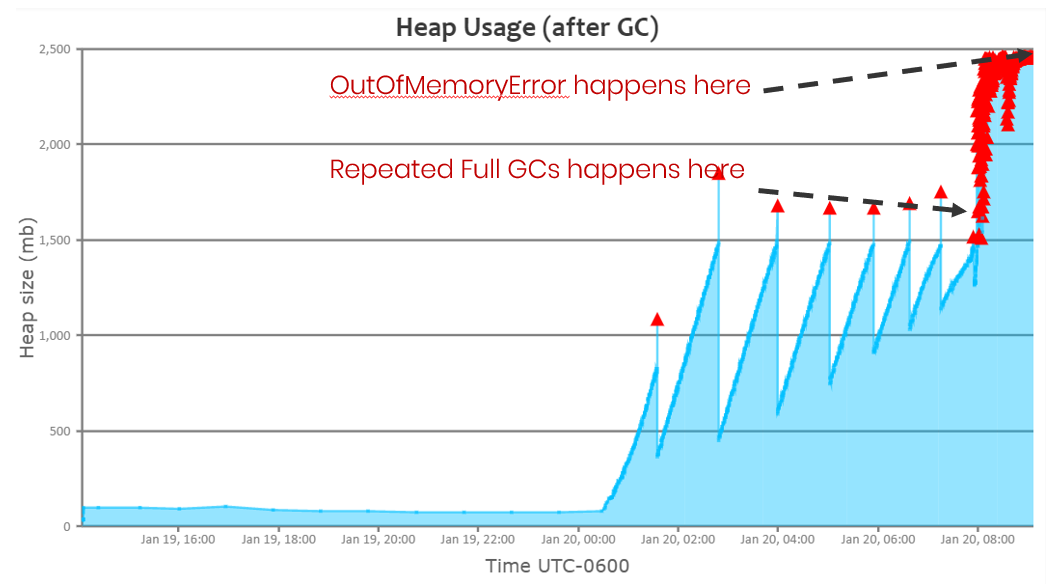
You can monitor GC related micrometrics in real-time using GCeasy REST API.
4. -XX:+HeapDumpOnOutOfMemoryError, -XX:HeapDumpPath
OutOfMemoryError is a serious problem that will affect your application’s availability/performance SLAs. To diagnose OutOfMemoryError or any memory-related problems, one would have to capture the heap dump right at the moment or few moments before the application starts to experience OutOfMemoryError.
As we don’t know when OutOfMemoryError will be thrown, it’s hard to capture the heap dump manually at the right around the time. However, capturing heap dumps can be automated by passing following JVM arguments:
-XX:+HeapDumpOnOutOfMemoryError and -XX:HeapDumpPath={HEAP-DUMP-FILE-PATH}
In -XX:HeapDumpPath, you need to specify the file path where heap dump should be stored. When you pass these two JVM arguments, heap dumps will be automatically captured and written to a defined file path, when OutOfMemoryError is thrown. Example:
xxxxxxxxxx
-XX:+HeapDumpOnOutOfMemoryError -XX:HeapDumpPath=/crashes/my-heap-dump.hprof
Once heap dumps are captured, you can use tools like HeapHero or EclipseMAT to analyze heap dumps.
More details around the OutOfMemoryError JVM arguments can be found in this article.
5. -Xss
Each application will have tens, hundreds, thousands of threads. Each thread will have its own stack. In each thread’s stack following information are stored:
- Methods/functions that are currently executed.
- Primitive datatypes.
- Variables.
- Object pointers.
- Return values.
Each one of them consumes memory. If their consumption goes beyond a certain limit, then a StackOverflowError is thrown. More details about StackOverflowError and solutions to resolve it can be found in this article. However, you can increase the thread’s stack size limit by passing the -Xss argument. Example:
xxxxxxxxxx
-Xss256k
If you set this -Xss value to a huge number, then memory will be blocked and wasted. Suppose you are assigning -Xss value to be 2mb whereas, it needs only 256kb, then you will end up wasting a huge amount of memory, not just 1792kb (i.e. 2mb – 256kb). Do you wonder why?
Say your application has 500 threads, then with -Xss value to be 2mb, your threads will be consuming 1000mb of memory (i.e. 500 threads x 2mb/thread). On the other hand, if you've only allocated -Xss to be 256kb, then your threads will be consuming only 125mb of memory (i.e. 500 threads x 256kb/thread). You will save 875mb (i.e. 1000mb – 125mb) of memory per JVM. Yes, it will make such a huge difference.
Note: Threads are created outside of the heap (i.e. -Xmx), thus this 1000mb will be in addition to the -Xmx value you have already assigned. To understand why threads are created outside the heap, you can watch this short video clip.
Our recommendation is to start from a low value (say 256kb). Run thorough regression, performance, and AB testing with this setting. Only if you experience a StackOverflowError should you increase the value; otherwise consider sticking to a low value.
6. -Dsun.net.client.defaultConnectTimeout and -Dsun.net.client.defaultReadTimeout
Modern applications use numerous protocols (i.e. SOAP, REST, HTTP, HTTPS, JDBC, RMI, etc.) to connect with remote applications. Sometimes remote applications might take a long time to respond. Sometimes they may not respond at all.
If you don’t have proper timeout settings, and if remote applications don’t respond fast enough, then your application threads/resources will get stuck. Remote applications unresponsiveness can affect your application’s availability. It can bring down your application to a grinding halt. To safeguard your application’s high availability, appropriate timeout settings should be configured.
You can pass these two powerful timeout networking properties at the JVM level that can be globally applicable to all protocol handlers that uses java.net.URLConnection:
- sun.net.client.defaultConnectTimeout specifies the timeout (in milliseconds) to establish the connection to the host. For example, for HTTP connections, it is the timeout when establishing the connection to the HTTP server.
- sun.net.client.defaultReadTimeout specifies the timeout (in milliseconds) when reading from the input stream when a connection is established to a resource.
Example, if you would like to set these properties to 2 seconds:
xxxxxxxxxx
-Dsun.net.client.defaultConnectTimeout=2000 -Dsun.net.client.defaultReadTimeout=2000
Note: By default, values for these two properties are -1, which means no timeout is set. More details on these properties can be found in this article.
7. -Duser.timeZone
Your application might have sensitive business requirements around time/date. For example, if you are building a trading application, you can’t take a transaction before 9:30 am. To implement those time/date related business requirements, you might be using java.util.Date or java.util.Calendar objects.
These objects, by default, pick up time zone information from the underlying operating system. This will become a problem if your application is running in a distributed environment. Take a look at the following scenarios:
- If your application is running across multiple data centers, say, San Francisco, Chicago, Singapore – then JVMs in each data center would end up having a different time zone. Thus, JVMs in each data center would exhibit different behaviors. It would result in inconsistent results.
- If you are deploying your application in a cloud environment, applications could be moved to different data centers without your knowledge. In that circumstance also, your application would end up producing different results.
- Your own Operations team can also change the time zone without bringing to the development team’s knowledge. It would also skew the results.
To avoid these commotions, it’s highly recommended to set the time zone at the JVM using the Duser.timezone system property. For example, if you want to set EDT time zone for your application, you would do:
xxxxxxxxxx
-Duser.timezone=US/Eastern
Conclusion
In this article, we have attempted to summarize some of the important JVM arguments and their positive impacts. We hope you may find it helpful.
Opinions expressed by DZone contributors are their own.
Comments