

WebRTC at Scale: Docker, GPU Nodes, Prometheus, and Latency-Based Autoscaling on GKE
WebRTC needs more than CPU scaling. Discover how GKE, Docker, GPUs, and Prometheus enable latency-driven autoscaling for faster, smoother, real-time applications.
 ·
·
Join the DZone community and get the full member experience.
Join For FreeReal-time apps are now part of daily life. We use them for video calls, live classes, online games, and health checkups. These apps need to respond fast. Even a small delay in sound or video makes them hard to use.
WebRTC is the open standard that powers most of these apps. It runs in browsers and on mobile devices, allowing direct audio, video, and data connections. But scaling WebRTC apps in the cloud is tricky.
Why? Because these apps are heavy on compute. They use video encoding, decoding, and sometimes extra features like background blur or translation. CPUs alone are not always enough to handle the load. And when usage grows quickly, users will notice lag before the system begins to show signs of trouble.
In this article, I will show how I built a Dockerized WebRTC application on Google Kubernetes Engine (GKE) with GPU nodes, Prometheus and Grafana monitoring, and autoscaling based on latency. I will also share lessons I learned and scripts I wrote to save costs.
Why CPU Metrics Are Not Enough
Most Kubernetes setups use the Horizontal Pod Autoscaler (HPA) with CPU utilization as the metric. The HPA checks CPU or memory use and adds pods when the usage passes a limit. This is fine for many apps. But it does not work well for WebRTC.
When I tested my demo app, CPU use stayed at normal levels. The HPA did not add more pods until usage hit 70%. By that time, video quality was already poor. The delay reached 300 - 400ms. Frames dropped. Audio broke up.
Users don’t care about CPU use. They care about smooth calls. This gap between system metrics and user experience is the main problem.
The solution is to monitor latency, not CPU usage. Latency shows how long it takes the app to respond. A spike in latency tells us users are suffering, even if CPU is fine.
The Setup
Here’s the system I built:
- Cluster: A GKE cluster with two pools. One pool uses regular CPU machines. The second pool uses NVIDIA T4 GPUs.
- NVIDIA device plugin: This plugin makes GPUs visible to Kubernetes. Pods can then ask for GPU resources.
- WebRTC app: A Dockerizedcontainer service that asks for one GPU. It exposes two endpoints:
- /healthz to show if it is running
- /metrics to share latency data
-
Prometheus and Grafana: These tools collect metrics and show them on dashboards. They let me see latency, GPU use, requests per second, and pod count.
-
Autoscaling: I kept a CPU-based HPA for basic scaling. But I also added KEDA (Kubernetes Event Drive Autoscaling), which scales pods based on Prometheus queries. This allowed me to scale on latency.
I also added a simple HTML dashboard built in JavaScript to simulate requests to the /process endpoint. It shows live p95 latency, RPS, and bar graphs for each mode: CPU, GPU, and autoscaling. This made it easy to demonstrate how latency changed with each mode — CPU vs. GPU.
This system ties scaling directly to what the user feels.
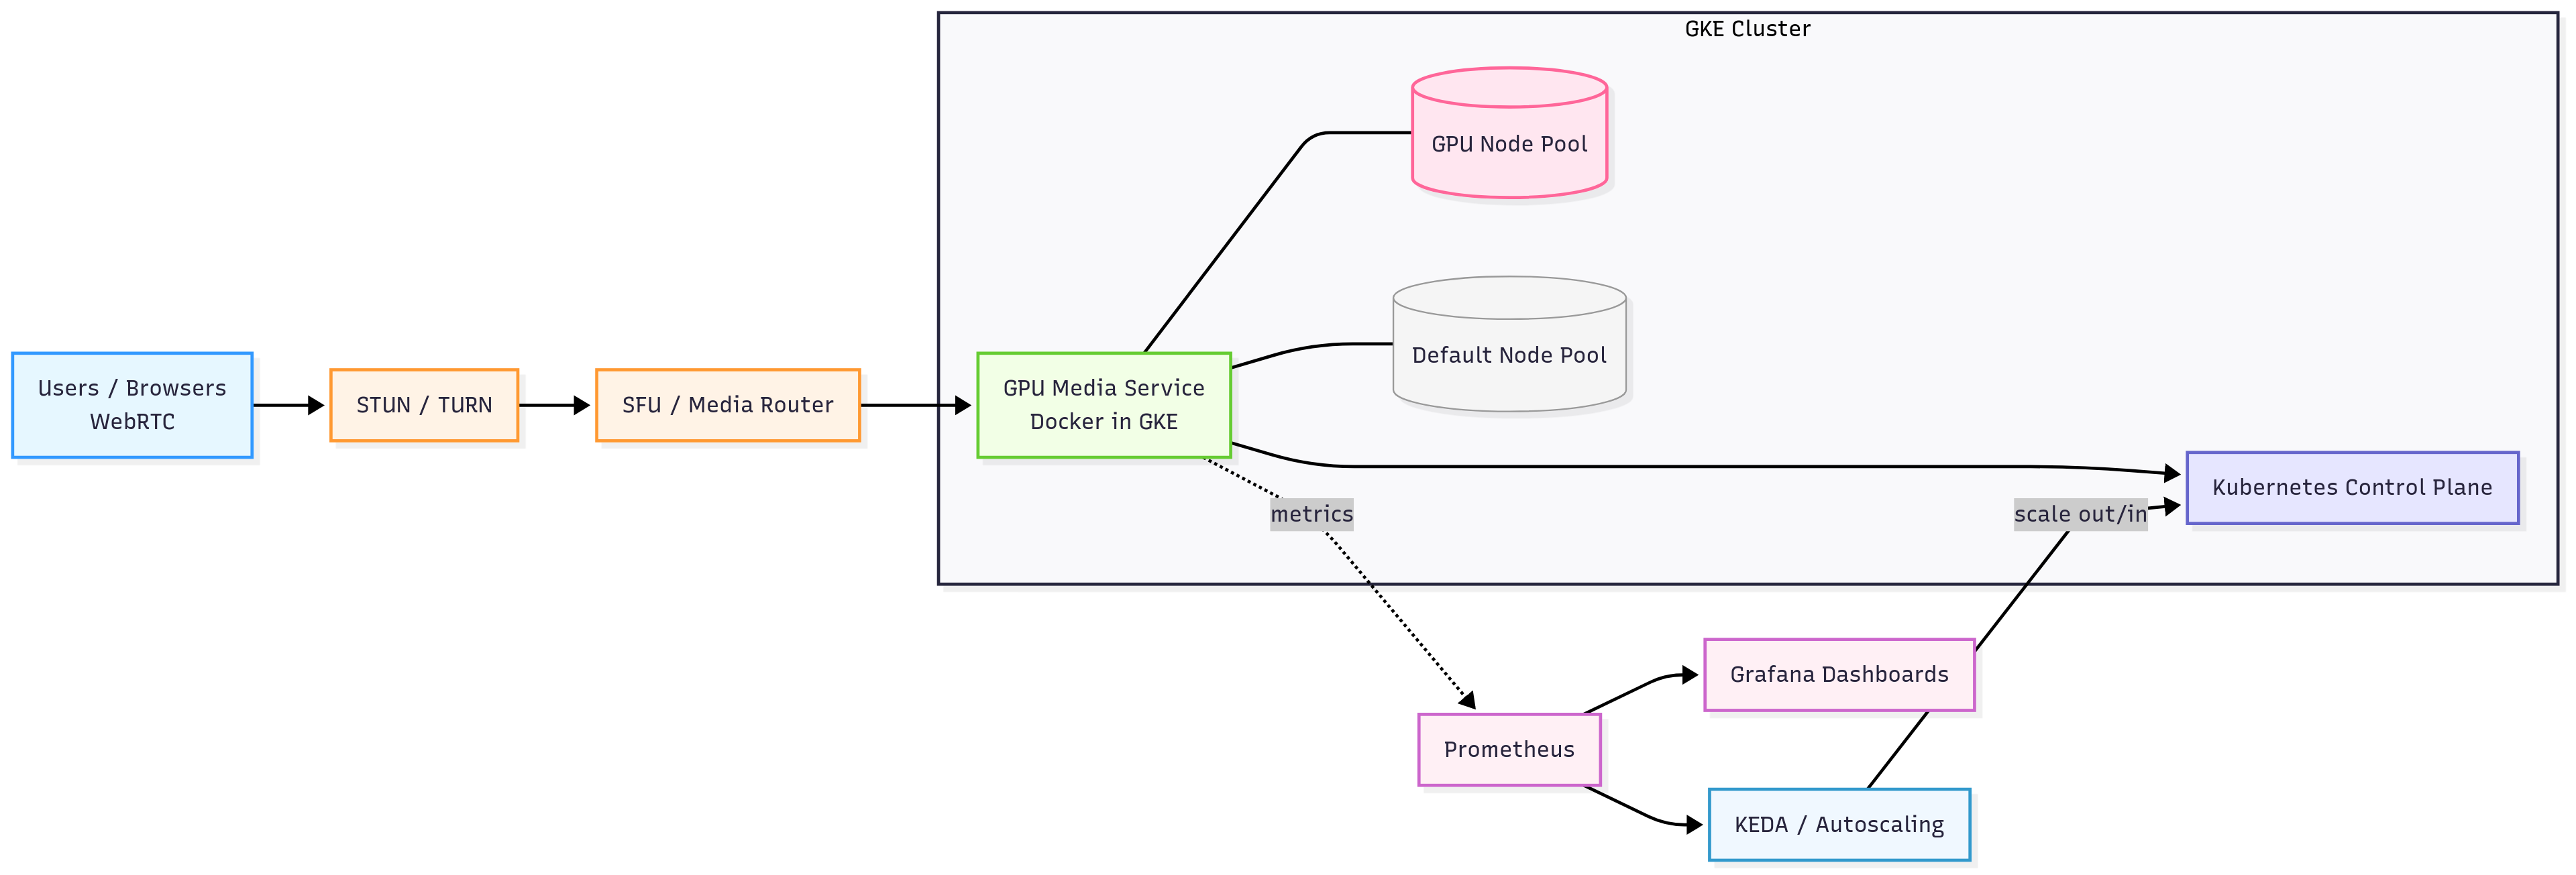
Figure 1: End-to-end setup for scaling WebRTC on GKE. A GPU-backed media service runs in a Kubernetes cluster. Prometheus, Grafana, and KEDA handle monitoring and autoscaling.
Startup and Teardown
Cloud resources cost money. GPU nodes are expensive, even when idle. I wanted a way to spin things up fast for testing and then shut them down when done.
I wrote two scripts:
startup.sh
This script sets up everything I need:
- Creates a cluster with both CPU and GPU node pools
- Installs the NVIDIA device plugin
- Installs Prometheus, Grafana, and the DCGM exporter for GPU metrics
- Deploys the WebRTC app in the rtc namespace
It only creates the GPU pool if I pass CREATE_GPU=1. This lets me test with CPU only when I don’t need GPUs.
teardown.sh
This script cleans up:
- Deletes the WebRTC app and namespace
- Removes Prometheus and Grafana
- Deletes GPU pools and the cluster
- Checks for leftover load balancers, IPs, and disks
This step is critical. These scripts reduce setup time and protect against unexpected bills.
Also, since the app runs in Docker, I could test the same image locally before pushing it to Artifact Registry and deploying it on GKE.
Interactive Demo and Visualization
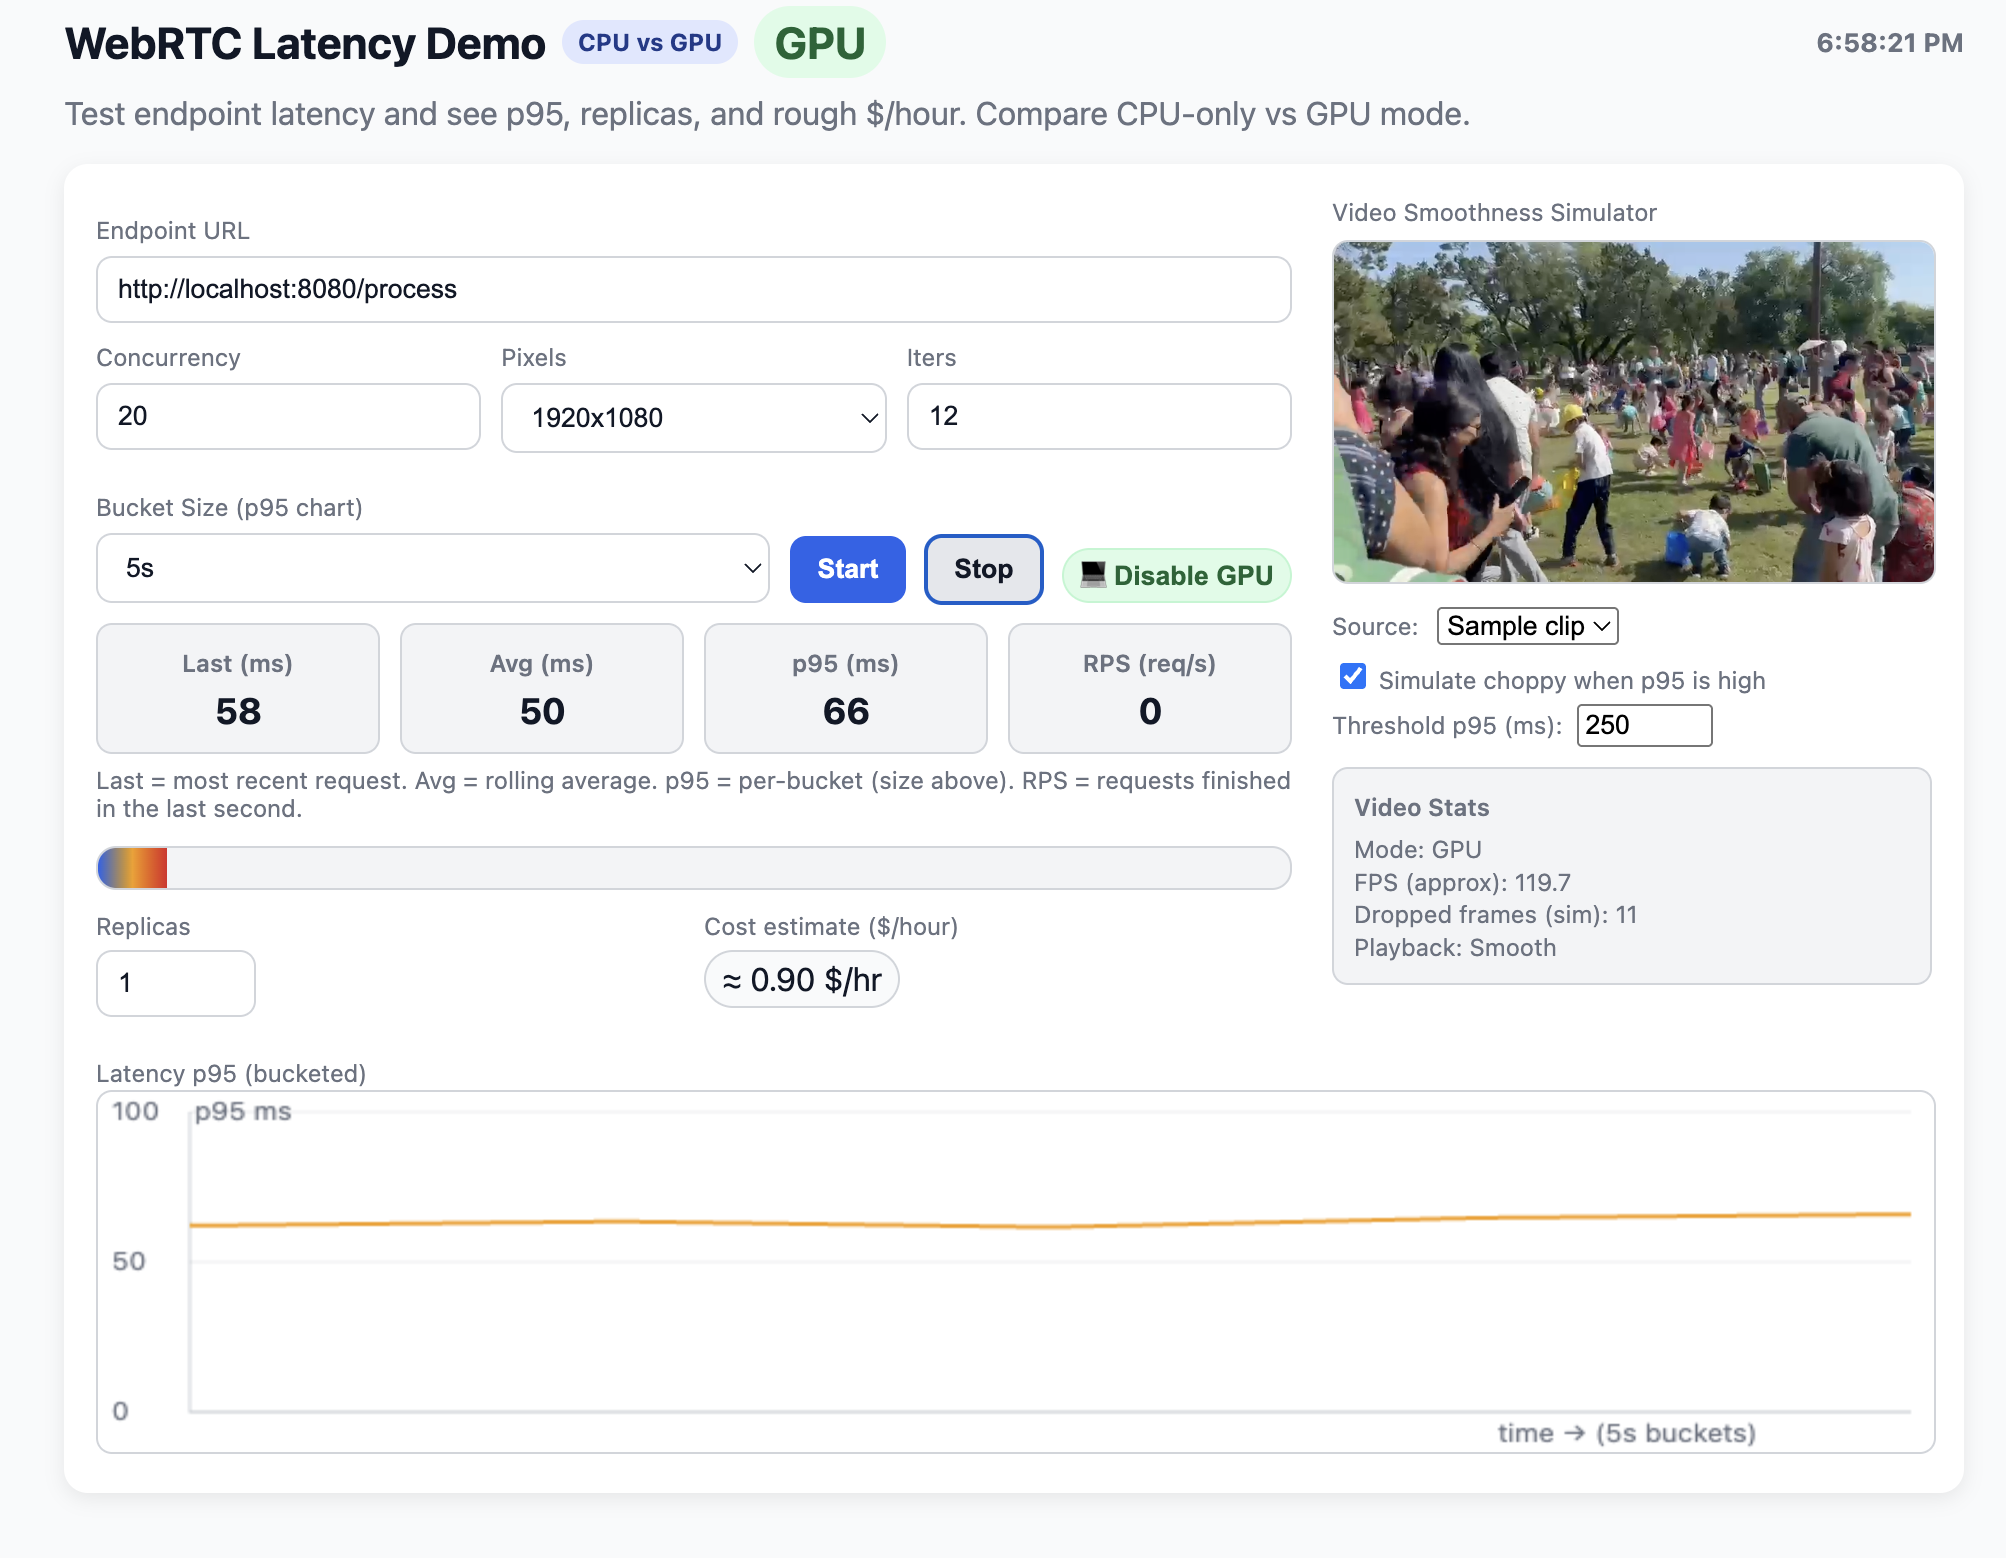
To make the scaling results more tangible, I built a lightweight HTML dashboard.
It sends concurrent POST requests to the /process endpoint, measures round-trip time, and updates a live chart showing average and p95 latency.
The dashboard also includes:
- A GPU/CPU mode indicator, showing where requests are being handled.
- Concurrency and iteration controls to adjust live load.
- A colored latency bar for quick visual feedback.
This helped simulate real-time stress tests in the browser and visualize how GPU acceleration and autoscaling improved performance. Below is the picture of the same.
Deploying the WebRTC App
A simplified deployment looks like this:
apiVersion: apps/v1
kind: Deployment
metadata:
  name: gpu-media
  namespace: rtc
spec:
  replicas: 1
  selector:
    matchLabels:
      app: gpu-media
  template:
    metadata:
      labels:
        app: gpu-media
    spec:
      containers:
      - name: gpu-media
        image: us-central1-docker.pkg.dev/webrtcscaling/containers/gpu-media:v1
        ports:
        - containerPort: 8080
        resources:
          requests:
            cpu: "1"
            memory: "2Gi"
            nvidia.com/gpu: 1
          limits:
            cpu: "2"
            memory: "4Gi"
            nvidia.com/gpu: 1
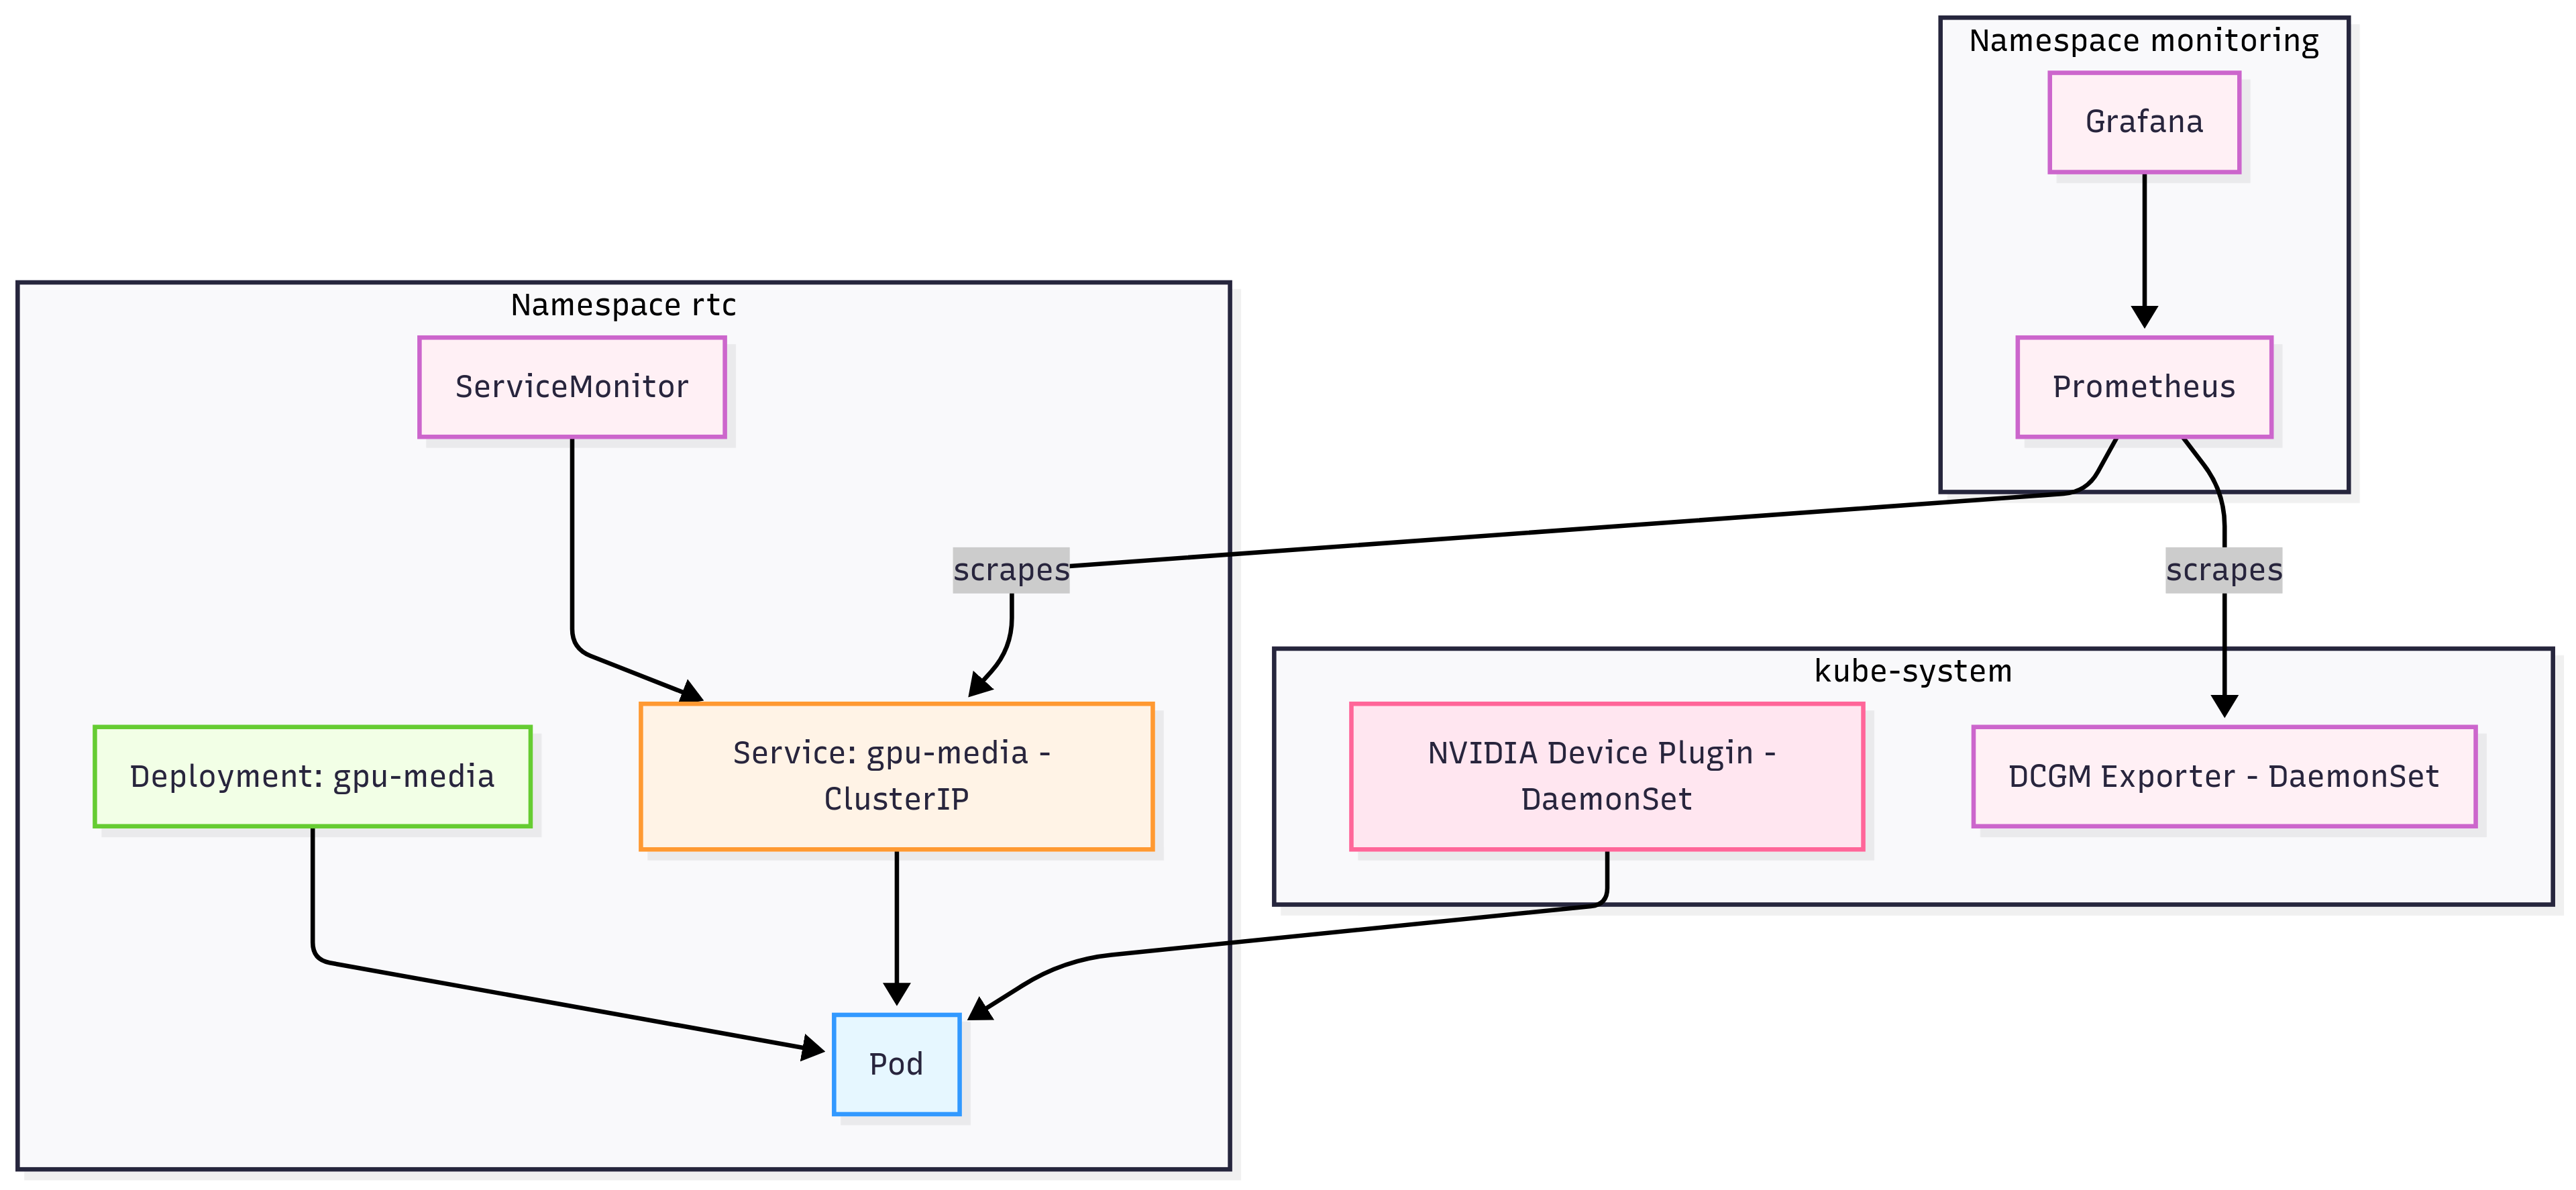
Once the pod is running, I checked it with:
kubectl -n rtc port-forward svc/gpu-media 8080:80
curl -s http://localhost:8080/healthz
The result looked like this:
{"ok": true, "device": "cuda"}This shows the pod is on a GPU node.
Monitoring Latency
CPU graphs are not enough. I needed to see what users would see. That means latency.
I used Prometheus to scrape the app’s /metrics endpoint. I also used the NVIDIA DCGM exporter to track GPU use. Grafana dashboards made it easy to view everything together.
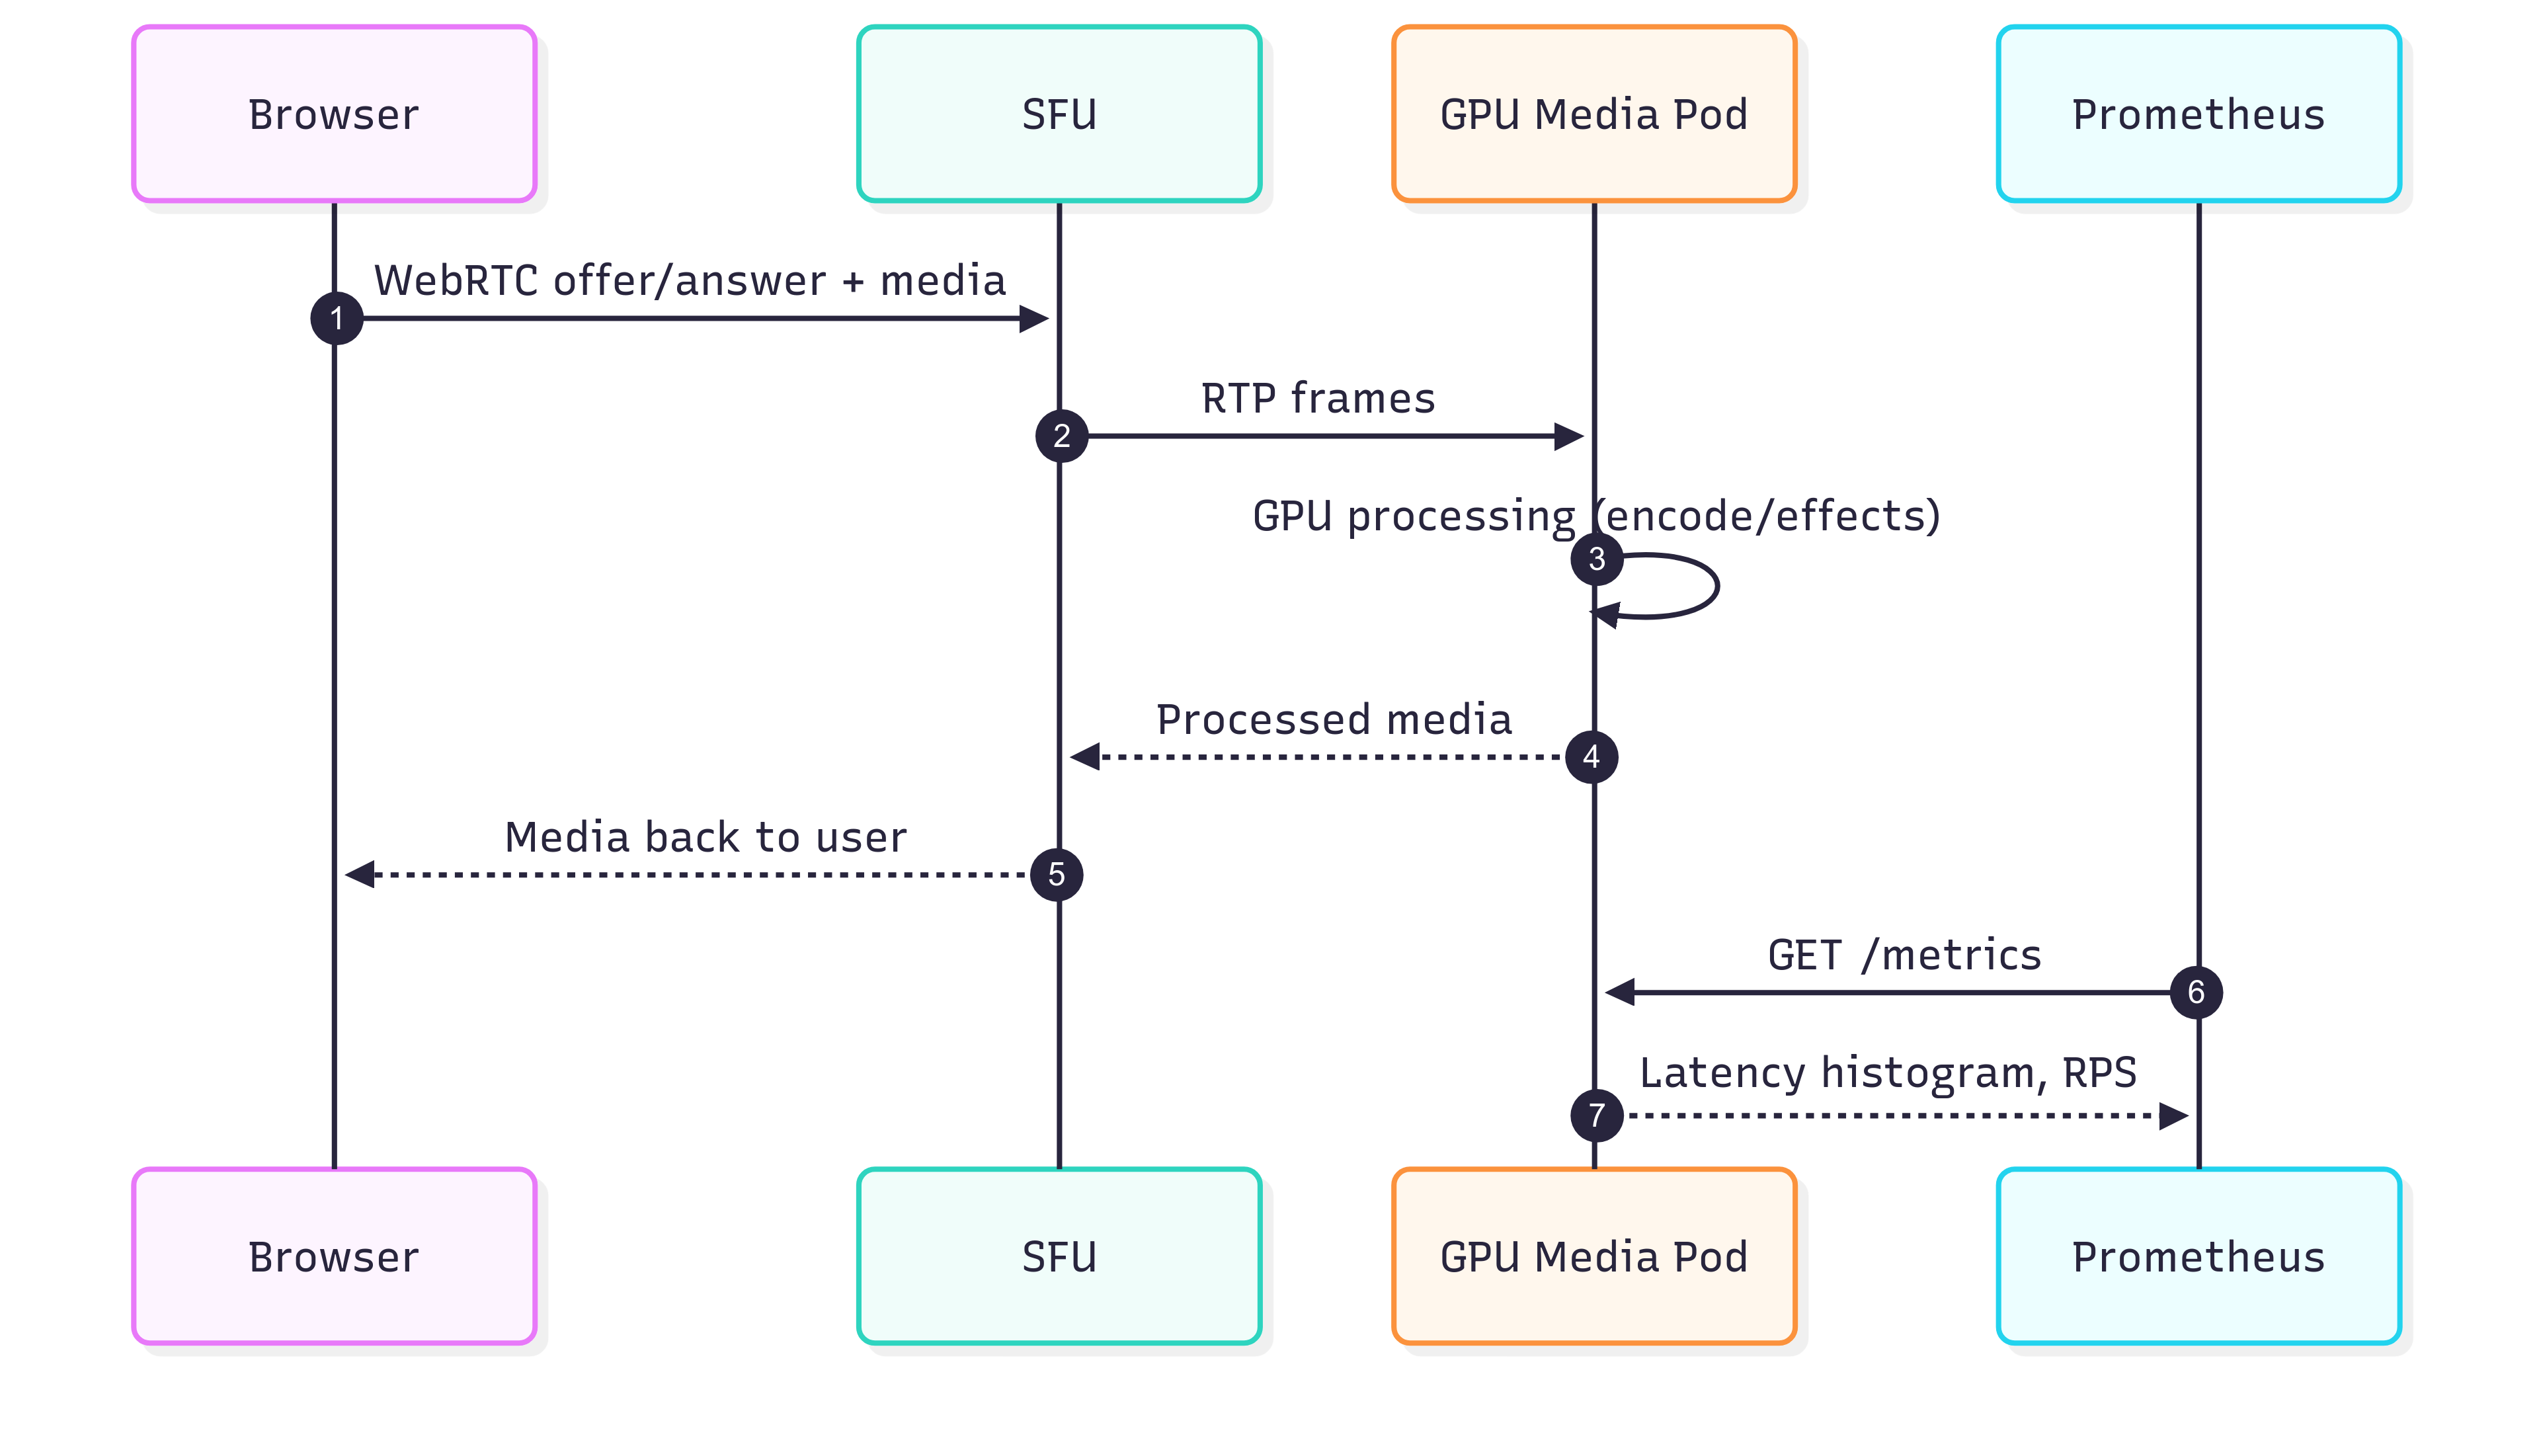
Figure 3: How media flows through the GPU pod and how Prometheus scrapes latency metrics for monitoring.
My dashboard had four key panels:
- p95 latency — 95% of requests were faster than this value.
- Requests per second — showed the traffic level.
- GPU use — checked how hard the GPU was working.
- Pod replicas — confirmed scaling actions.
The main PromQL query for p95 latency:
histogram_quantile(0.95, sum(rate(app_request_latency_seconds_bucket[2m])) by (le))With this, you can see latency spikes on Grafana panels. You can also watch GPU use and pod counts.
I could see latency spikes before users complained.
Autoscaling on Latency
The real power came from autoscaling based on latency.
First, here’s a standard CPU-based HPA:
metrics:
- type: Resource
  resource:
    name: cpu
    target:
      type: Utilization
      averageUtilization: 60
This works, but only reacts when CPU usage is high. By that time, user calls may already be choppy.
With KEDA, I set a scaling rule on latency:
apiVersion: keda.sh/v1alpha1
kind: ScaledObject
metadata:
  name: gpu-media-latency
  namespace: rtc
spec:
  scaleTargetRef:
    name: gpu-media
  minReplicaCount: 1
  maxReplicaCount: 5
  triggers:
  - type: prometheus
    metadata:
      serverAddress: http://kube-prometheus-stack-prometheus.monitoring.svc:9090
      metricName: app_latency_p95_seconds
      query: |
        histogram_quantile(0.95, sum(rate(app_request_latency_seconds_bucket[2m])) by (le))
      threshold: "0.20"
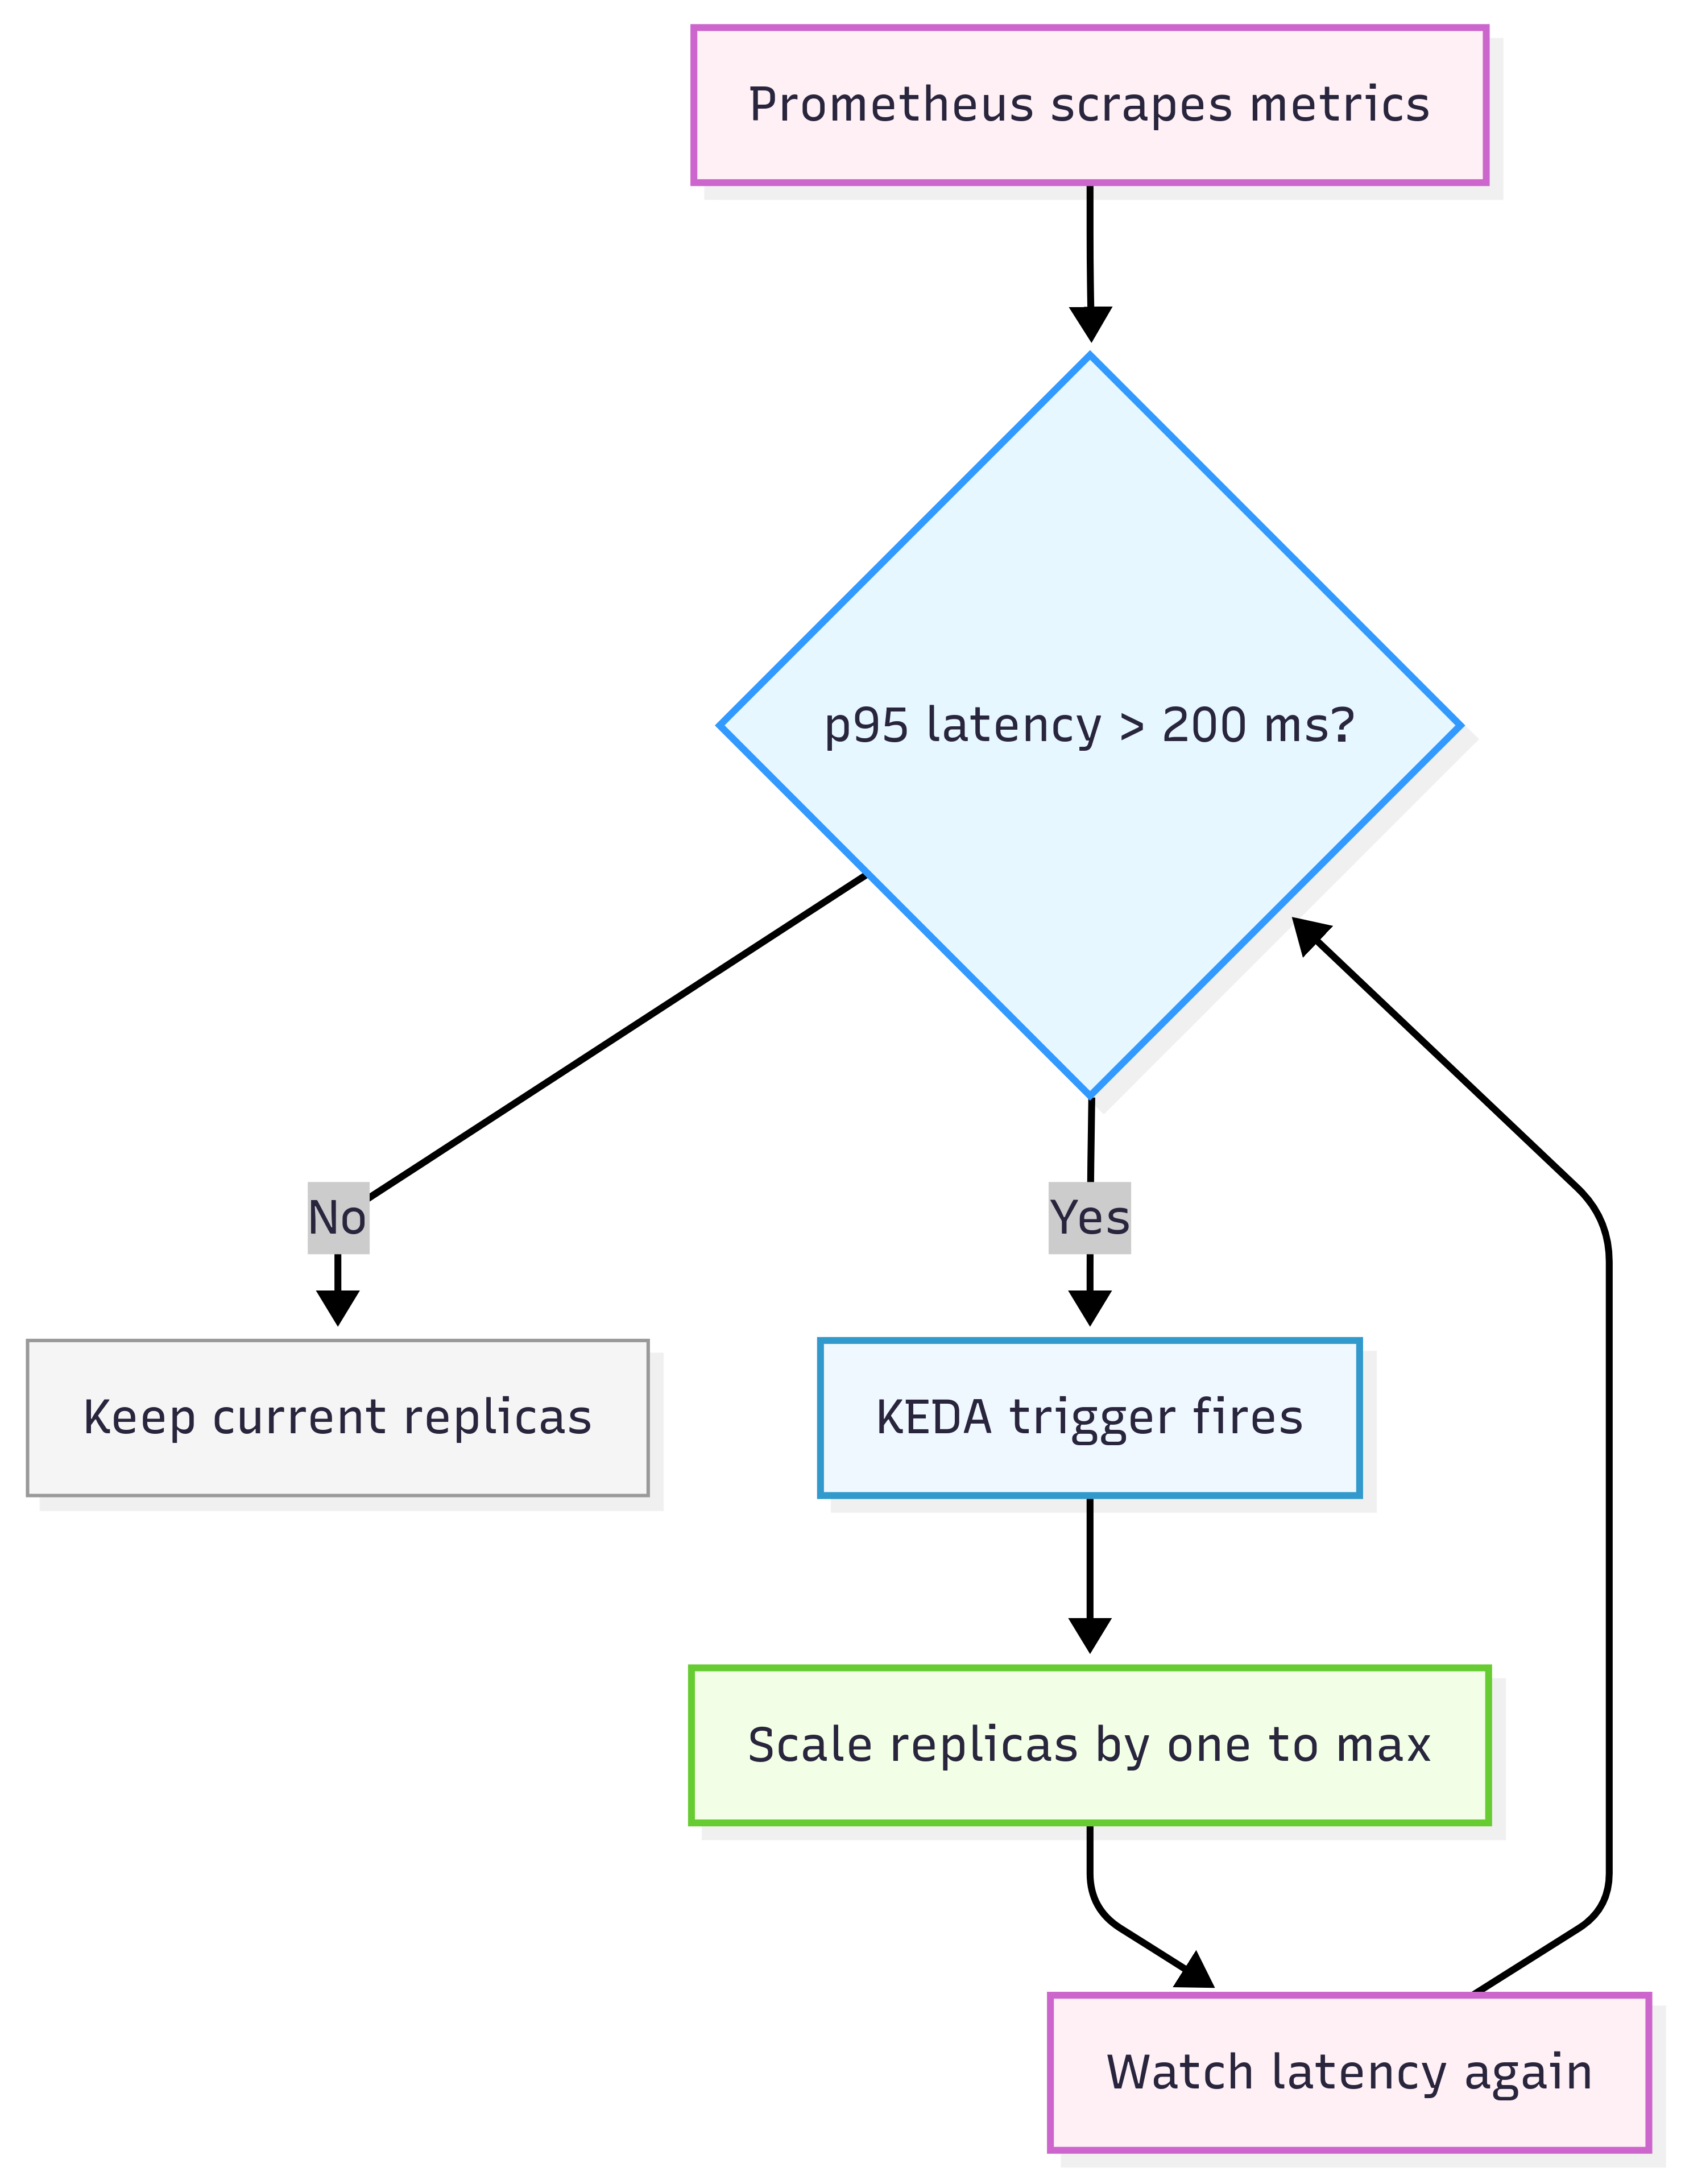
This means that if the p95 latency is above 200ms, scale out.
In tests, latency jumped past 200ms under load. KEDA added pods. Latency dropped back under the target. This was clear proof that scaling was tied to what users feel.
CPU vs GPU vs Autoscaling: Trade-offs in Real-Time Scaling
During testing, I compared three setups side by side — CPU-only, GPU-enabled, and Autoscaling (using KEDA with Prometheus).
| Setup | Description | Performance | Cost | Best Use Case |
|---|---|---|---|---|
| CPU-only | Default pods on standard GKE nodes | Moderate latency (~400 ms under load) | Low | Small groups or low concurrency |
| GPU-enabled | Uses NVIDIA T4 GPU node pool | Stable latency (~150 ms even under load) | High | Heavy video workloads (encoding, filters, ML) |
| Autoscaling (KEDA) | Scales based on latency or queue metrics | Dynamic — grows only when needed | Medium | Burst traffic, variable loads |
The takeaway:
- CPU-only is predictable but limited.
- GPU-enabled gives smooth real-time video at higher cost.
- Autoscaling balances both by using extra pods or GPU nodes only when latency rises.
Lessons Learned
- NodeSelector problems: Initially, my pods remained pending. The cause was a bad label. The right label is:
cloud.google.com/gke-accelerator: nvidia-tesla-t4
Figure 5: The scheduler only places GPU workloads on nodes with the correct accelerator label.
Figure 5: The scheduler only places GPU workloads on nodes with the correct accelerator label.
Plugin URL: An old NVIDIA plugin link gave a 404. The correct one is:
https://raw.githubusercontent.com/NVIDIA/k8s-device-plugin/main/deployments/static/nvidia-device-plugin.yml- GPU quota: My project had no GPU quota at first. I had to request quota before the GPU pool worked. Also, GPU quota is regional; check per zone.
- Costs: GPU nodes are pricey. Safe startup defaults and teardown scripts kept me from running them by accident.
- Cluster operations overlap: GKE can block new node pool creation while another operation is running. Always check with
gcloud container operations listbefore retrying. - Pending Pods Debugging: If pods stay pending, describe the
Events:section — it’s often node affinity or GPU scheduling issues. - Startup/Teardown Testing: Test teardown thoroughly — a missed load balancer or disk can keep billing active.
Best Practices
Here’s what worked well for me:
- Scale on latency SLOs, not just CPU.
- Collect metrics that reflect what users feel: latency, jitter, frame drops.
- Use Prometheus and Grafana for visibility.
- Automate infra setup/teardown with scripts.
- Check GPU quotas before you build.
Conclusion
Scaling WebRTC is not only about adding pods. It is about keeping calls smooth for users.
With Dockerized workloads, GKE, GPU nodes, Prometheus monitoring, and KEDA autoscaling, you can:
- Scale on latency, not just CPU.
- Keep user calls stable under load.
- Control costs with startup and teardown scripts.
Users don’t care about system graphs. They care about video and audio that work. With this setup, scaling aligns with what matters most — the experience on the other end of the call.
Opinions expressed by DZone contributors are their own.
Comments