

Building an Agentic AIOps Pipeline With IBM Storage Insights, n8n, and Elastic
Build an automated human-in-the-loop AIOps pipeline using n8n, Elastic, and AI to filter IBM Storage Insights alerts to reduce alert fatigue.
Join the DZone community and get the full member experience.
Join For FreeIBM Storage Insights is a cloud-based storage monitoring and analytics platform designed to provide visibility across enterprise storage environments. It continuously collects telemetry from storage systems, analyzes capacity and performance trends, detects risks, and generates alerts when thresholds or anomalies are detected. These alerts can range from capacity and performance issues to configuration, security, and hardware health notifications.
In large environments, Storage Insights becomes a critical early-warning system — but it can also generate a high volume of alerts that require triage, investigation, and remediation. Some are critical and demand immediate attention, many are informational, and a surprising number are duplicates of issues that have already been investigated and resolved. Over time, this creates a familiar problem for operations teams: alert fatigue. Engineers spend more time triaging notifications than solving real problems, and valuable context is scattered across dashboards, chat threads, and ticketing systems.
What if alerts could arrive already enriched with context, historical knowledge, and a suggested course of action — while still keeping humans firmly in the decision loop?
In this article, we build an end-to-end, human-in-the-loop automation pipeline for IBM Storage Insights alerts using n8n on IBM Cloud Code Engine, Elastic Cloud, Google Gemini, Slack, and Jira. Alerts flow into n8n via webhooks, are enriched and analyzed using AI and historical incident memory stored in Elastic, and are then routed to Slack, where administrators can acknowledge, delete, or escalate them directly. Every decision feeds back into Elastic, continuously improving future triage.
Overall Architecture
The following diagram shows the end-to-end architecture of the solution and how each component participates in the alert remediation loop.
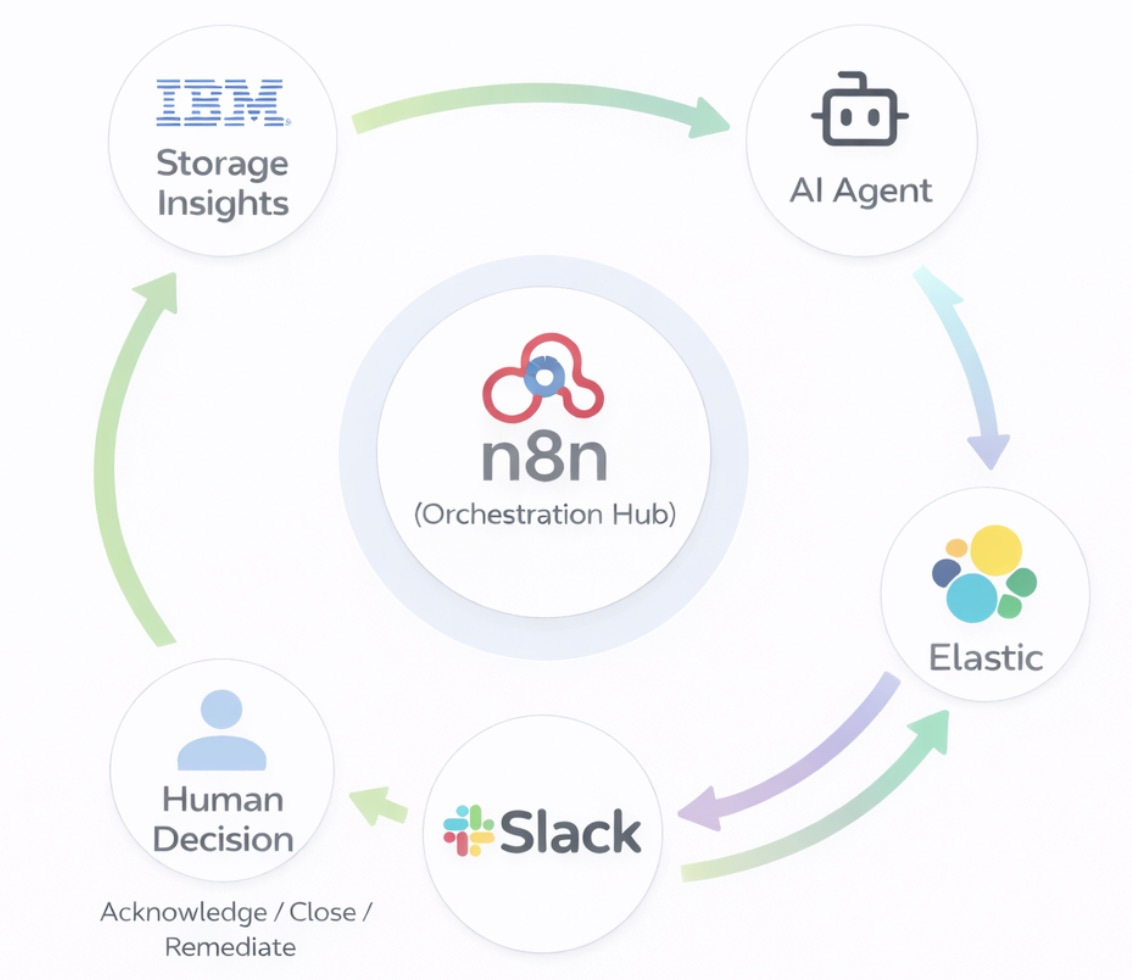
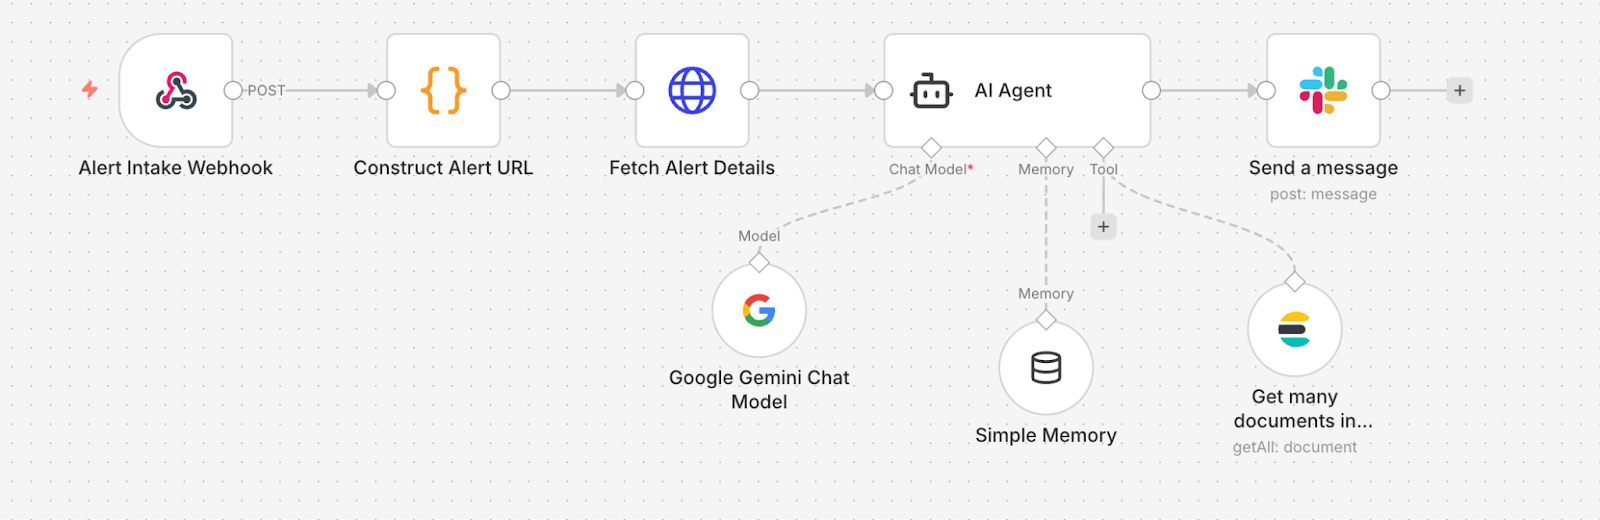
At the center of the system sits n8n, acting as the orchestration hub that connects IBM Storage Insights, the AI agent, Elastic Cloud, Slack, and the human decision loop. When a new alert is generated, it enters an automated cycle where it is enriched, analyzed, reviewed, and finally remediated.
In this architecture:
- IBM Storage Insights is the alert source and remediation endpoint.
- The AI agent performs reasoning, summarization, and decision support.
- Elastic Cloud acts as the incident memory and analytics layer, storing alerts, embeddings, outcomes, and historical evidence for retrieval and dashboards.
- Slack enables human-in-the-loop triage and decision-making.
- n8n orchestrates the entire lifecycle — routing data, invoking APIs, coordinating AI analysis, and executing remediation actions.
Together, these components create a continuous feedback loop that turns raw alerts into actionable, measurable, and increasingly intelligent remediation workflows.
Receiving Alerts in n8n
We first need to get the alerts flowing from IBM Storage Insights into our automation platform. This section establishes the foundation of the entire pipeline: a webhook endpoint in n8n that acts as the entry point for every alert.
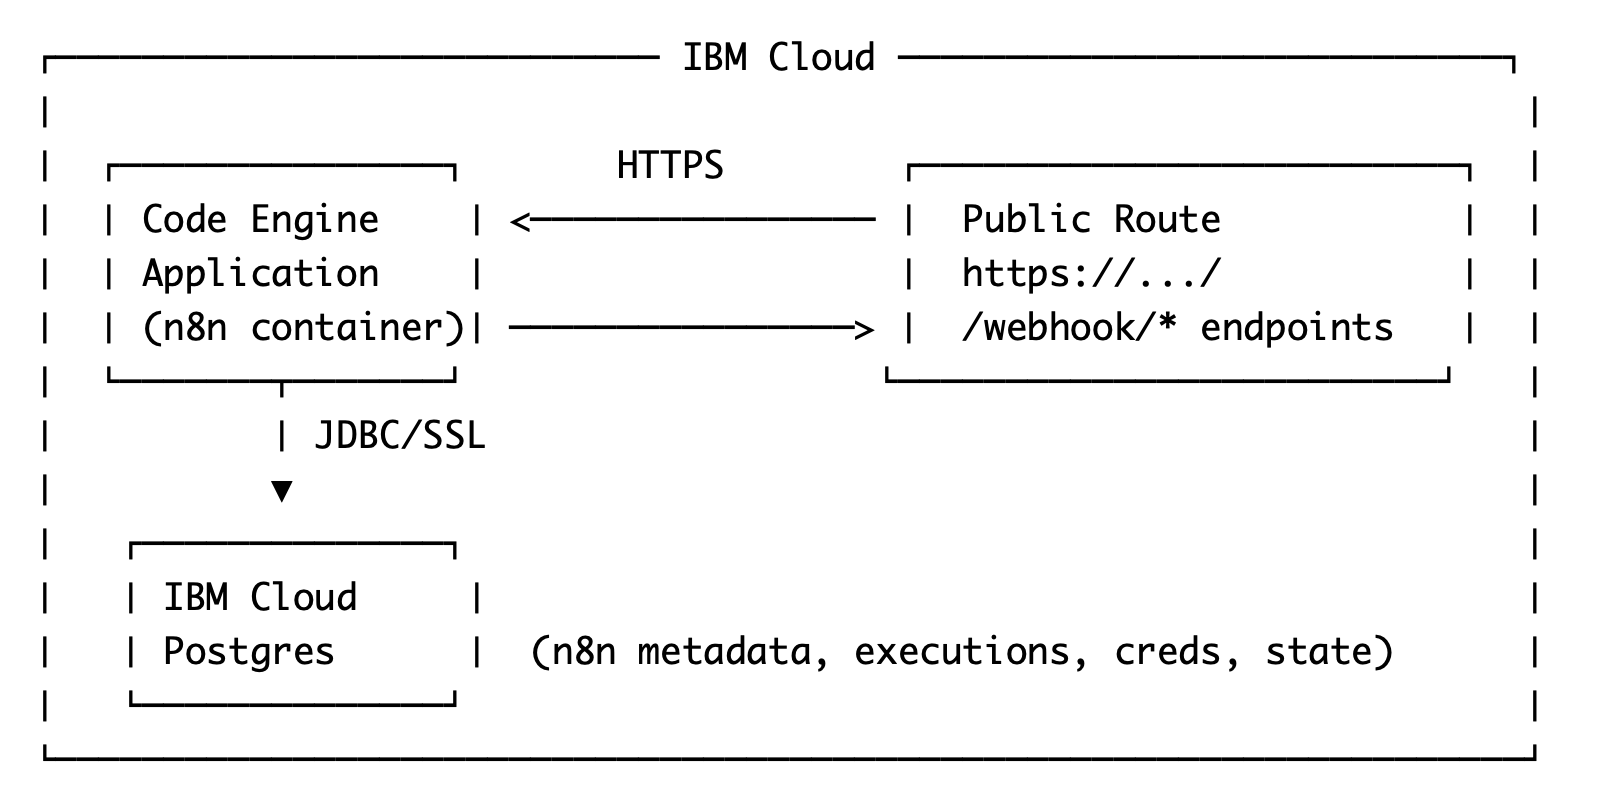
With n8n already deployed on IBM Cloud Code Engine and accessible over HTTPS, we can configure it to receive alerts from IBM Storage Insights.
Creating the Alert Intake Webhook in n8n
The Webhook node in n8n exposes an HTTPS endpoint that external systems can call whenever an event occurs. In our case, IBM Storage Insights will send alert payloads to this endpoint.
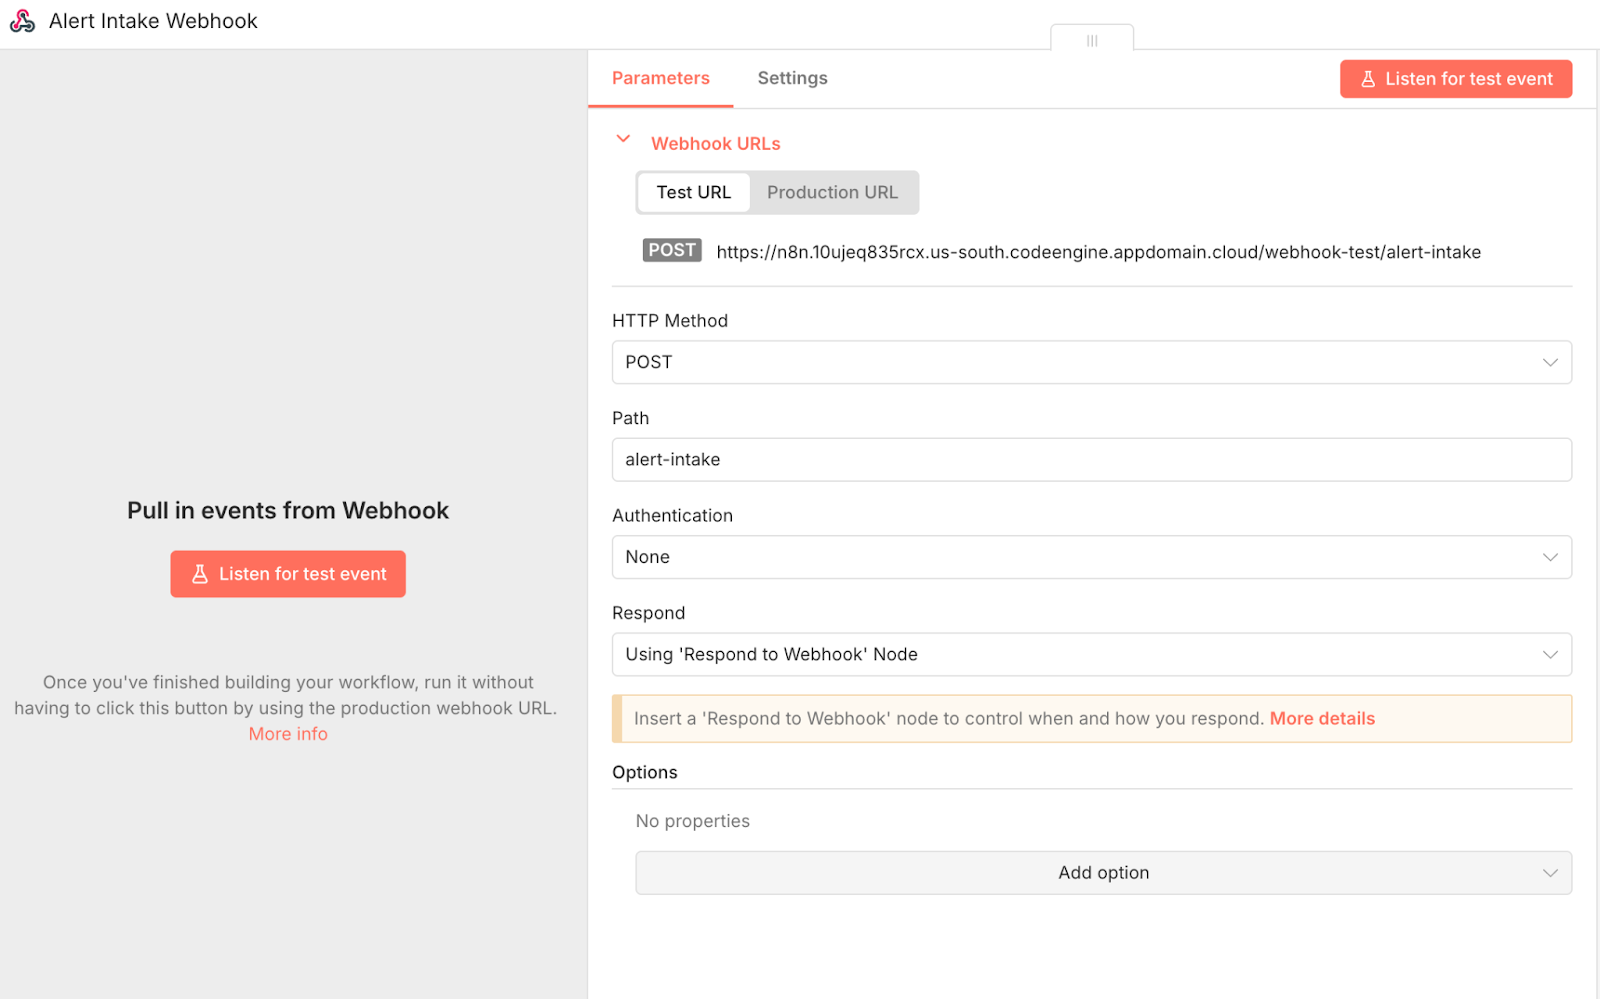
Create a new workflow in n8n and add a Webhook node with the following configuration:
- HTTP method: POST
- Path: alert-intake
- Authentication: None
- Respond: Immediately
- Response code: 200
Once saved and activated, this creates the production endpoint that Storage Insights will call whenever a new alert is generated.
Configuring IBM Storage Insights to Send Alerts
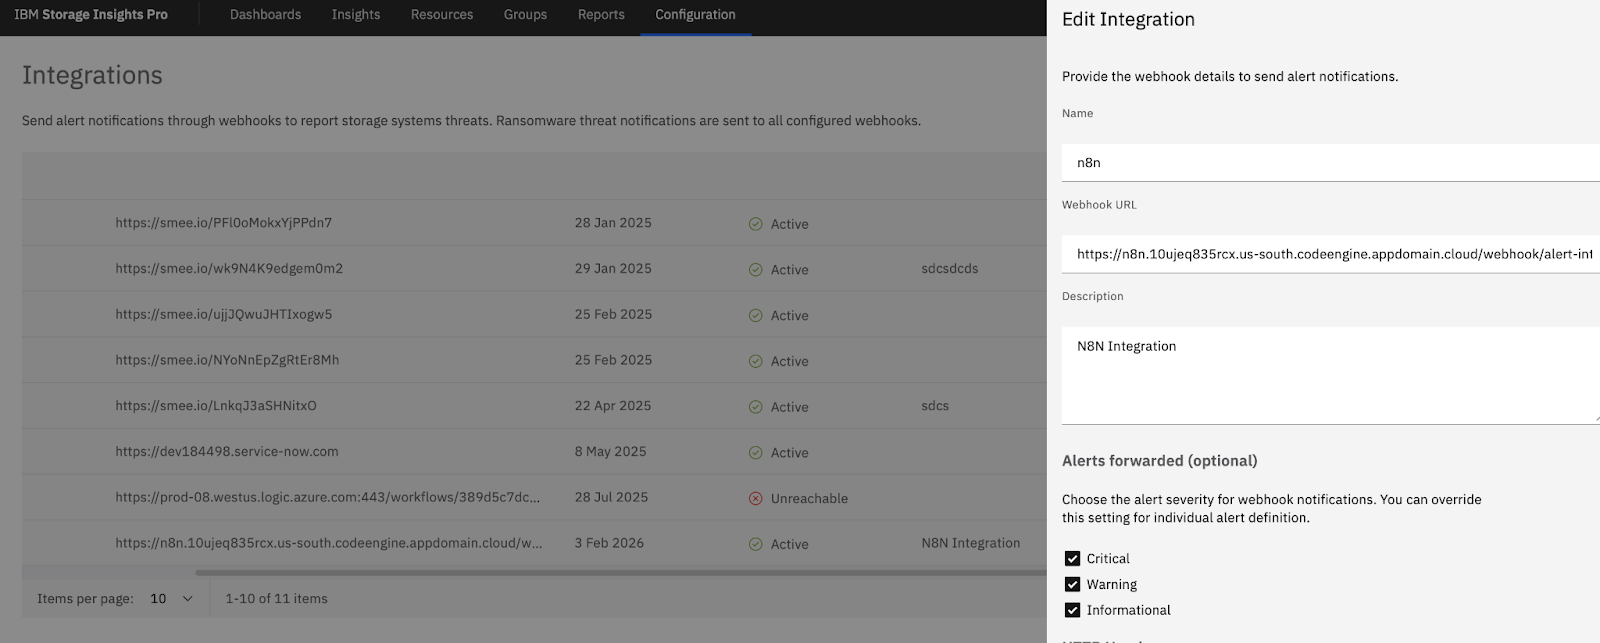
IBM Storage Insights supports outbound webhooks that deliver alert payloads as JSON. Configure the webhook URL in Storage Insights to point to the n8n endpoint created in the previous step.
Enriching Alerts With Storage Insights APIs
The webhook payload received from IBM Storage Insights is lightweight. It contains identifiers and metadata that allow downstream systems to locate the alert, but it does not include the full event details required for analysis and remediation. This enrichment step transforms the webhook from a simple notification into a fully contextualized event that can be analyzed by the AI agent and stored in Elastic.
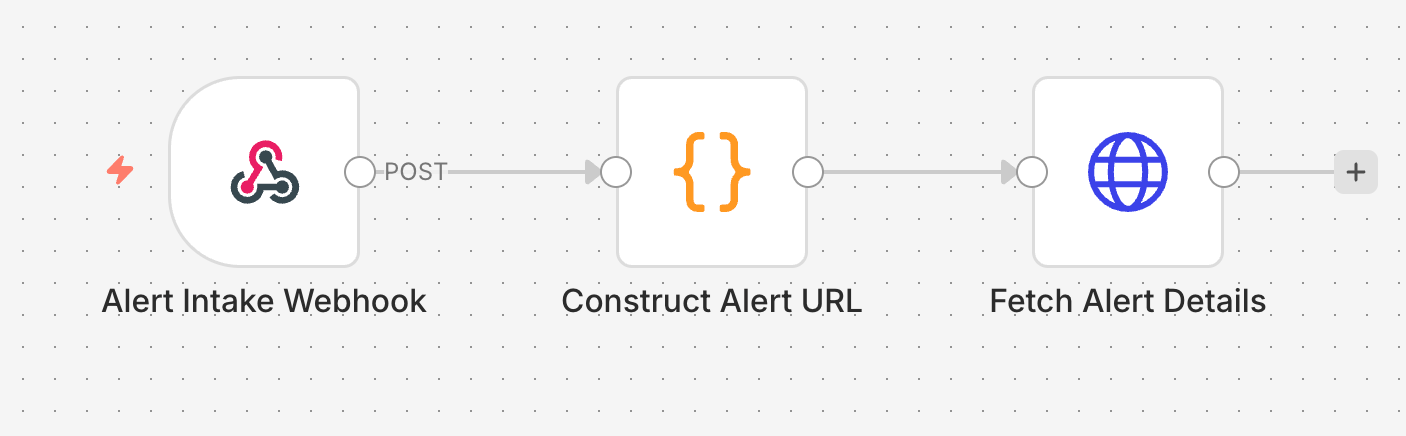
To retrieve the full alert details, add an HTTP Request node immediately after the webhook node. This node calls the Storage Insights event API using values extracted from the incoming payload.
At this point, the pipeline has successfully moved from alert ingestion to alert enrichment. The next step is to persist these enriched alerts in Elastic Cloud so they can be searched, analyzed, and used as long-term incident memory.
Elastic as Both Memory and Analytics Layer
At this point in the workflow, Elastic Cloud serves two equally important roles.
First, it acts as the long-term memory of the AI agent. Every alert that flows through the system — along with the AI-generated summary, human decision, and final outcome — is stored in Elasticsearch. Over time, this creates an evolving knowledge base of incidents that the agent can search to identify duplicates, recurring patterns, and previously resolved issues.
Second, Elastic functions as the analytics platform for alert operations. Because each alert is indexed as a structured document, we can query, aggregate, and visualize alert trends directly in Kibana. This enables teams to measure alert volume, track noise reduction, monitor response times, and identify the systems or subcategories generating the most incidents.
Creating Elastic Index
Before we can query Elasticsearch for similar alerts, we first need to create the index and ingest our first alert document. The simplest way to do this is to send a JSON document representing an alert from the n8n workflow into Elastic Cloud. Elasticsearch will automatically create the index (or apply an existing template) and establish the document structure. This initial ingestion step seeds the incident corpus that will later power similarity search, AI memory, and operational analytics. Once the first alert is indexed, every subsequent alert will enrich and expand this shared knowledge base.
Add an Elasticsearch node with authentication details fetched from the Elastic Cloud console.
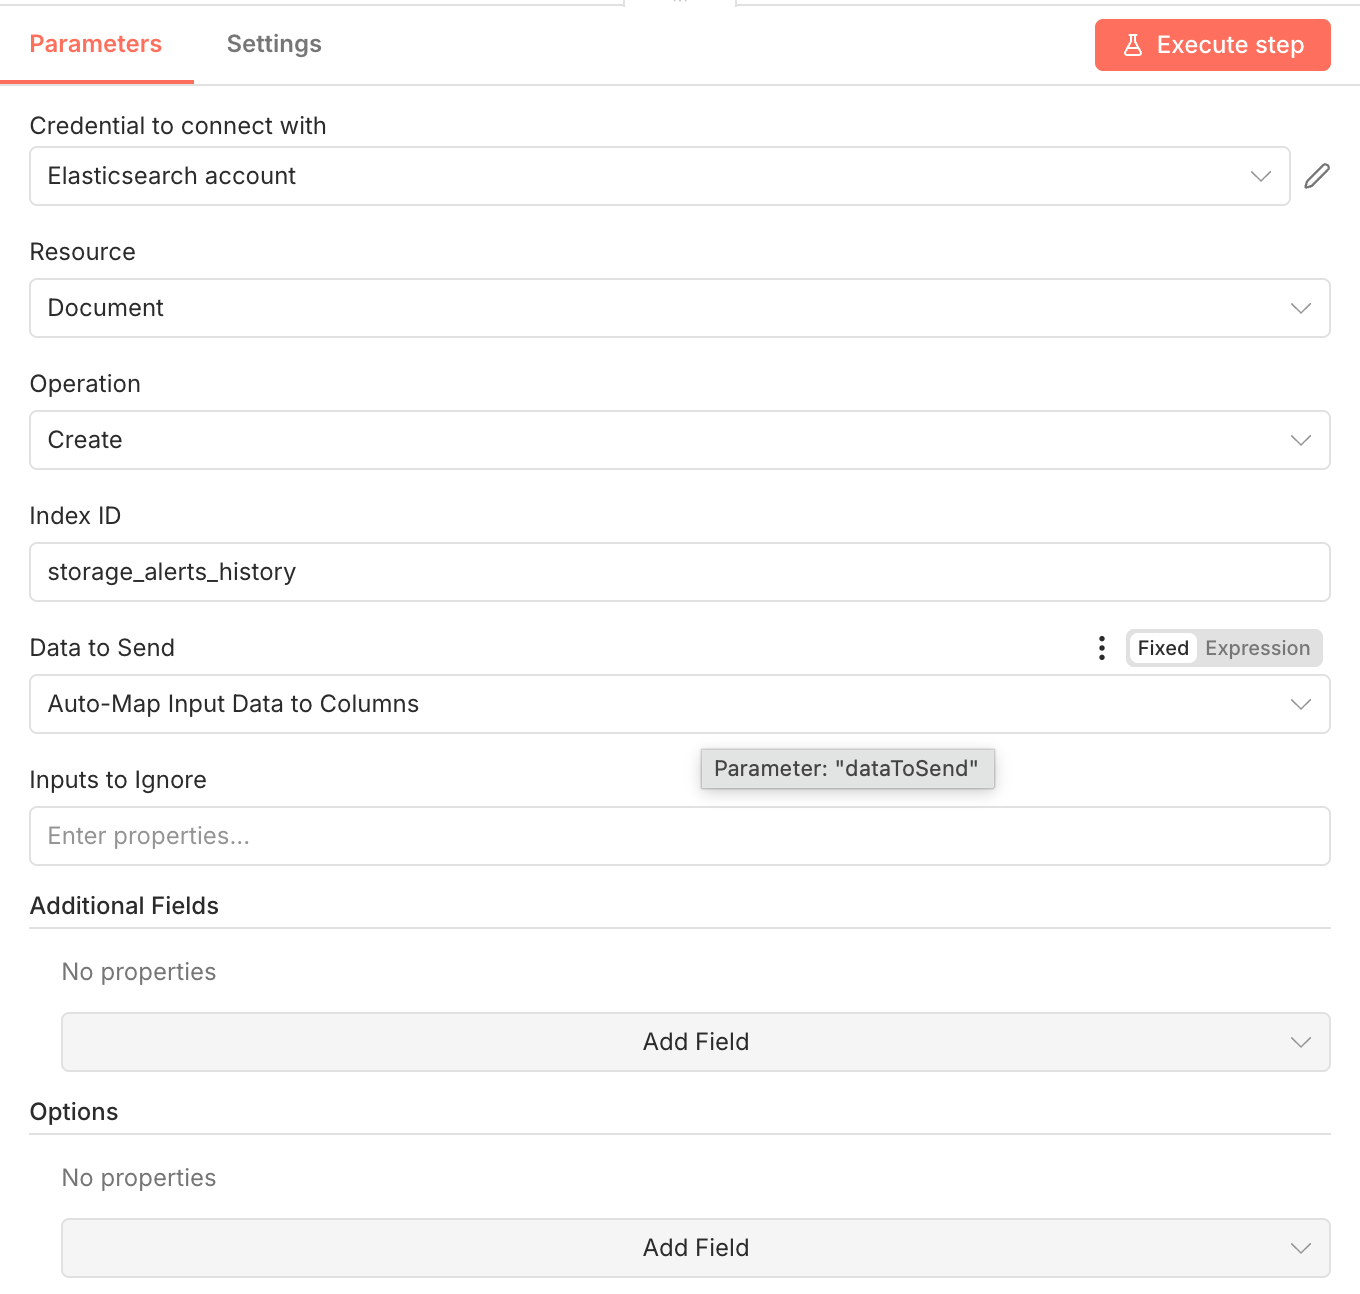
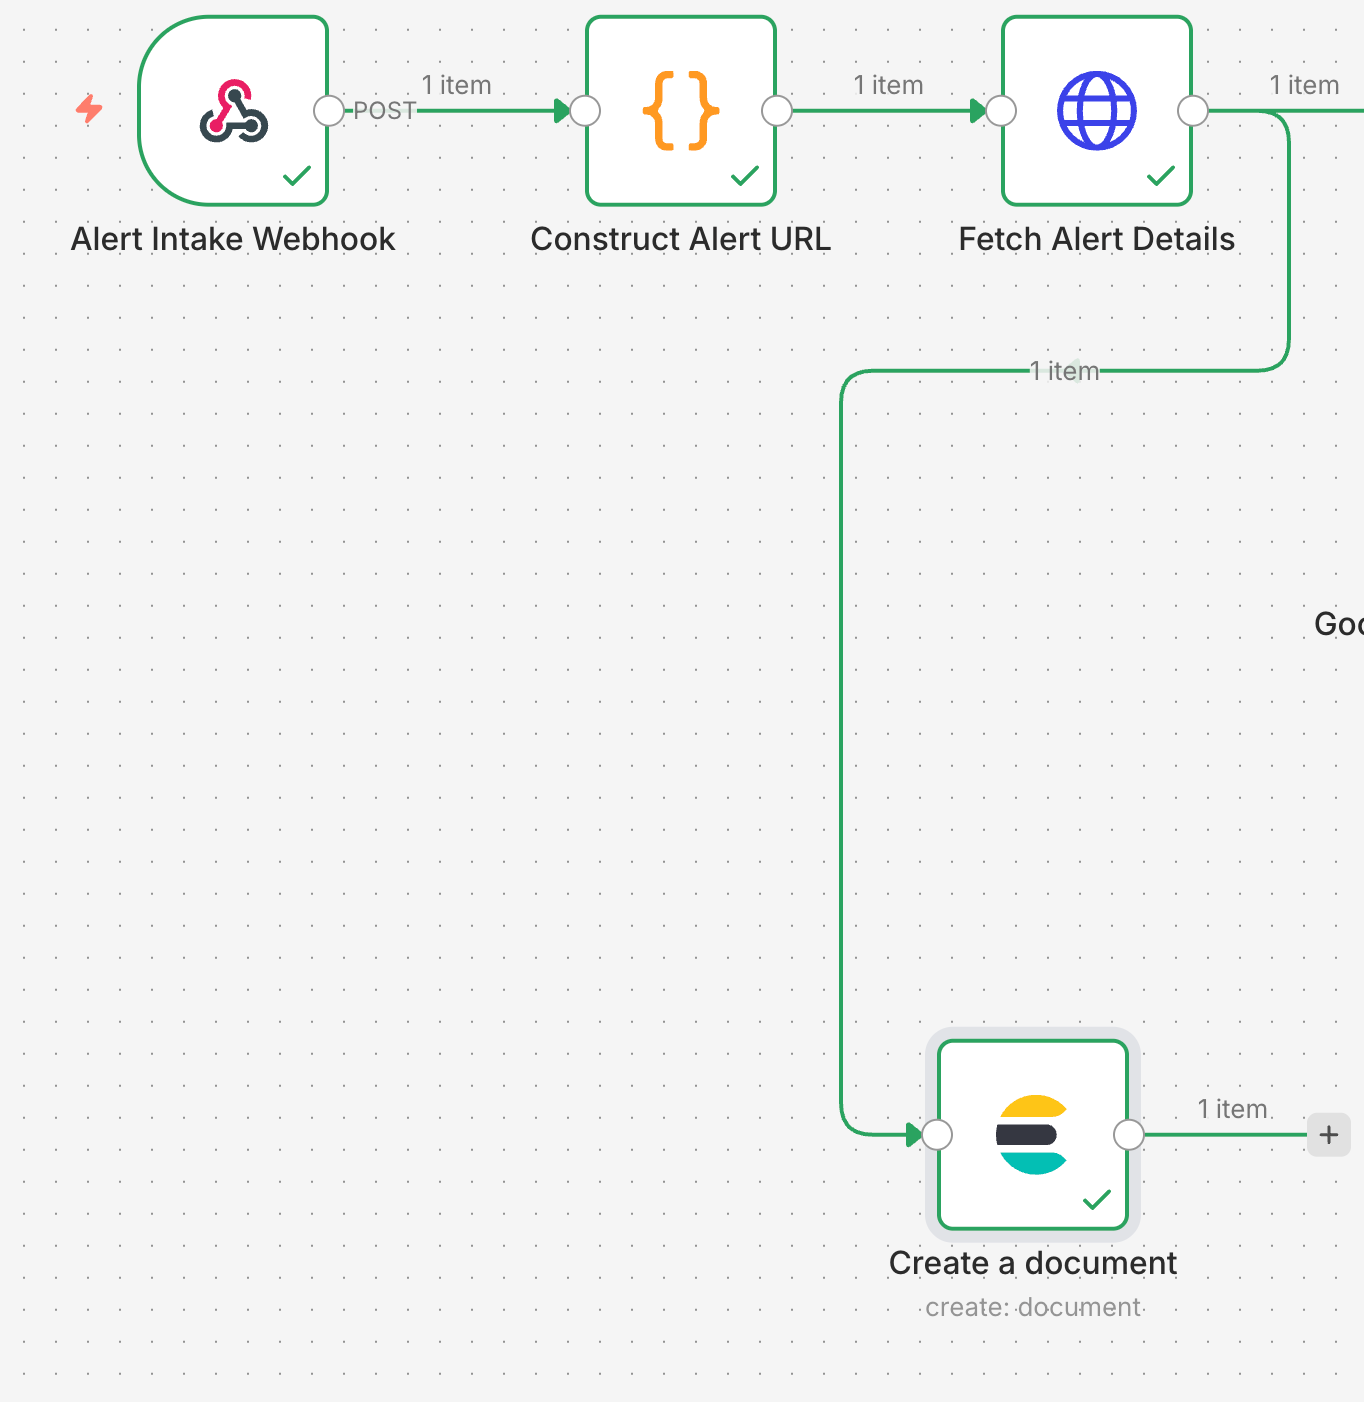
Connect the existing Fetch Alert Details node directly to the Elasticsearch node.
- Data to send: In the "Data to Send" field, select Auto-Map Input Data to Columns.
- Result: n8n will automatically take the JSON output from the previous node and push it into the storage_alerts_history index.
Once you successfully execute the node:
- Go to your Elastic Cloud project.
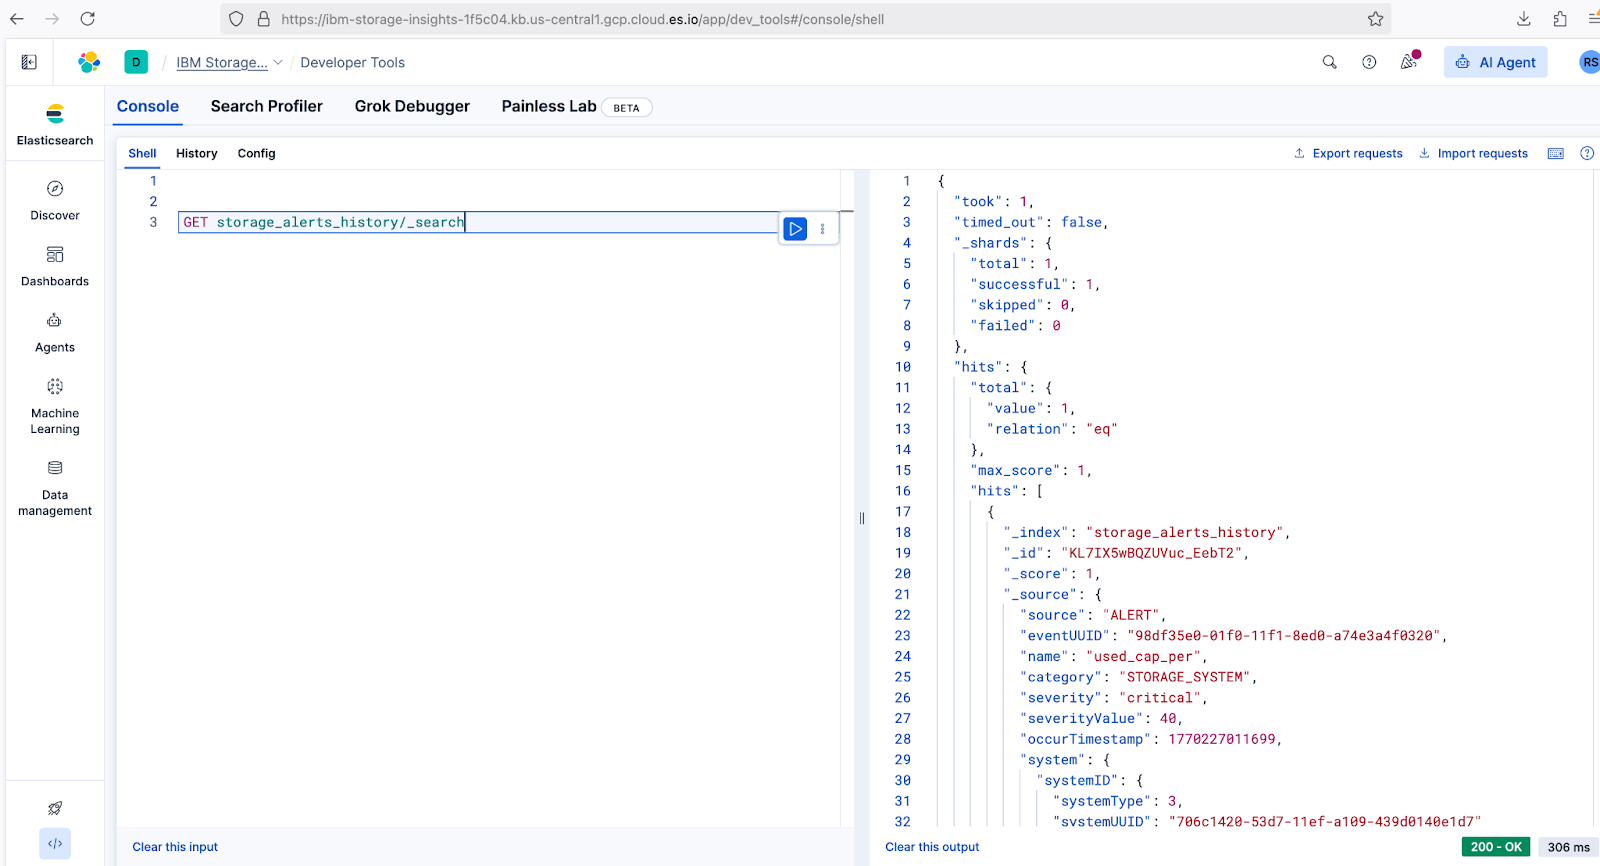
- Open the Dev Tools console (the hammer icon or via search).
- Run the command: GET storage_alerts_history/_search.
- If you see your alert data, the "seed" is complete.
Configuring the AI Agent
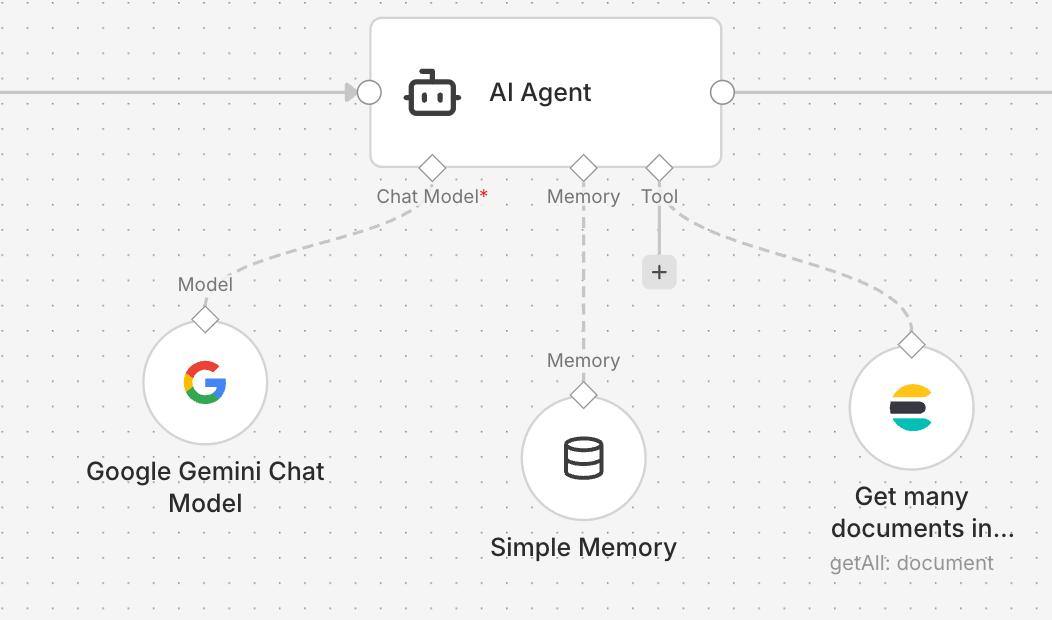
With alerts now being ingested into Elastic, the next step is to introduce the AI agent that will interpret and triage each event. The agent is configured in n8n to use a Gemini chat model, with Elasticsearch connected as a tool for retrieval. Before generating its analysis, the agent queries Elastic to find similar historical alerts and their outcomes. This gives the model real operational context — whether an alert was previously acknowledged, closed as a duplicate, or escalated to Jira — so its recommendations are grounded in past decisions rather than isolated reasoning. Elastic, therefore, becomes both the agent’s memory and evidence source, enabling a true retrieval-augmented triage workflow.
1. Connect the AI Agent to the Elastic Tool
- Add the AI Agent node after your Fetch Alert Details node.
- Attach the Elasticsearch Tool to it
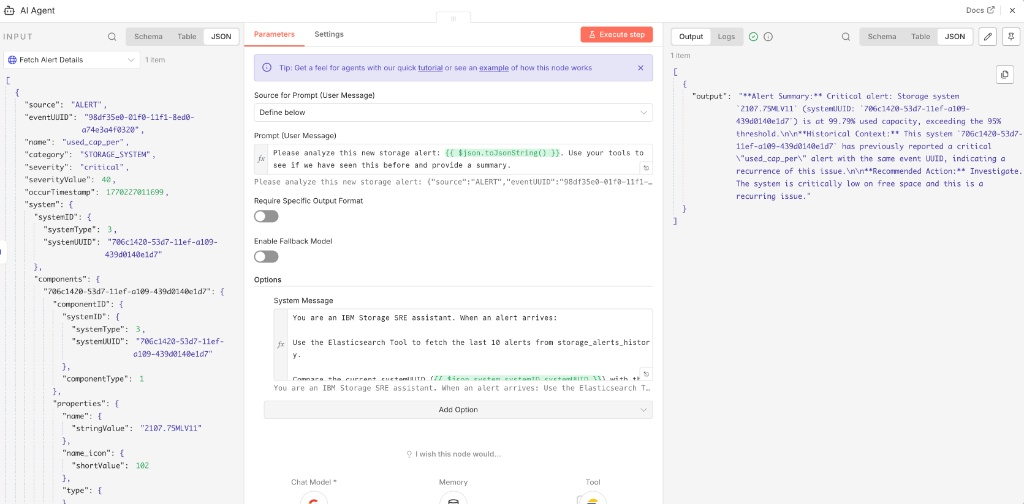
- Tell the agent to analyze the incoming JSON from the previous node by setting the User Message:
Please analyze this new storage alert: {{ $json.name }} - Severity: {{ $json.severity }}. Use your tools to see if we have seen this before and provide a summary.
2. Craft the System Prompt
The agent needs to know why it has this tool. Use a prompt similar to this:
"You are an IBM Storage SRE assistant. When an alert arrives, use the Elasticsearch Tool to fetch the last 10 alerts from storage_alerts_history. Look for patterns: Is this the same systemUUID as past failures? If so, tell the human in Slack: 'This system has alerted 3 times this week.' Suggest a remediation based on what worked before."
An AI agent should be able to generate a contextual summary at this stage:
Humans into the Loop With Slack
While the AI agent can summarize alerts and recommend actions, final decisions for critical infrastructure should remain under human control. To enable this, the workflow posts the AI-generated triage summary to a Slack channel using interactive message buttons. Administrators can review the context, view similar incidents retrieved from Elastic, and choose whether to acknowledge, delete, or escalate the alert. Their decision is sent back to n8n via Slack interactivity webhooks, allowing the workflow to continue automatically.
At this stage, a Slack message is sent to the Slack channel configured.
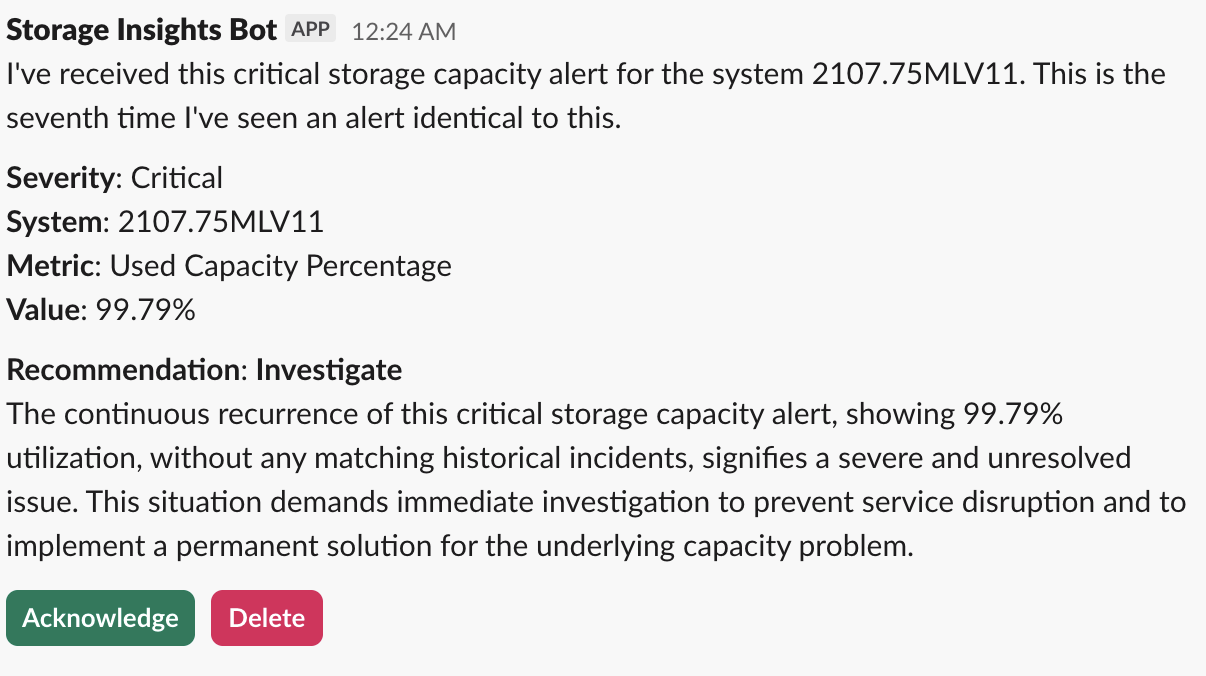
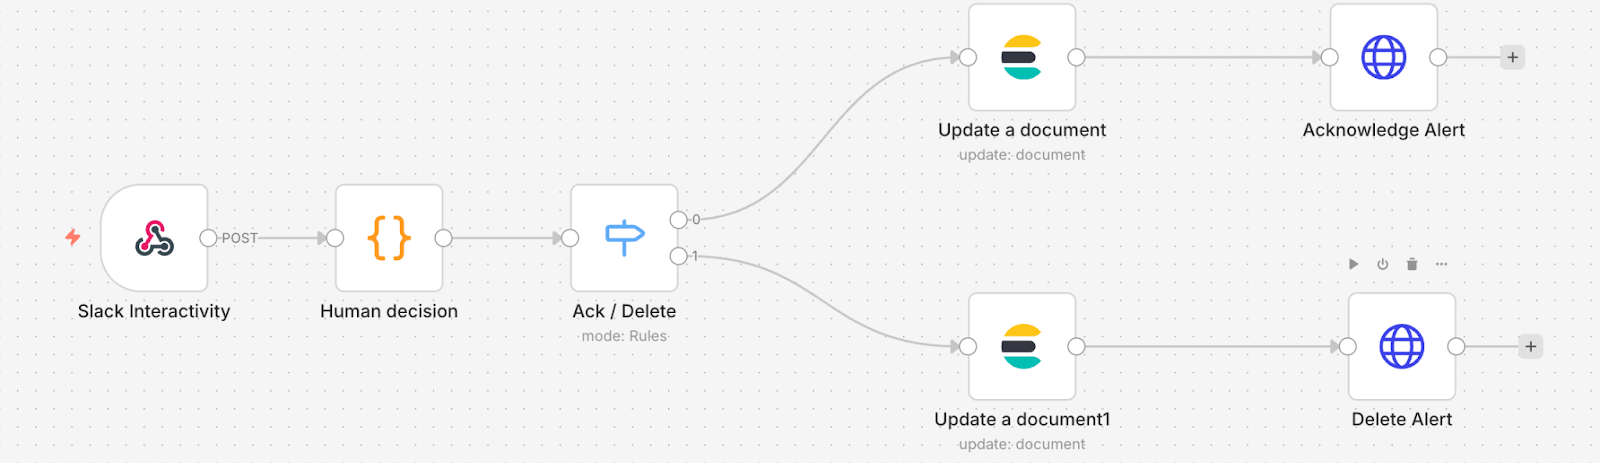
The final workflow begins when an administrator clicks a button in the Slack message. Slack sends the interaction payload back to n8n through the Slack Interactivity Webhook, which acts as the entry point for the resolution phase.
The Human decision code node parses the Slack payload to determine which action the administrator selected. This decision is passed to the Ack / Delete rules node, which routes the workflow down the appropriate branch.
Before taking action in IBM Storage Insights, the workflow updates the corresponding alert document in Elastic. This ensures the system maintains a complete lifecycle history of every alert — from ingestion and AI analysis to human decision and final resolution. If the alert is acknowledged, the Update Document → Acknowledge Alert branch marks the alert as acknowledged in Elastic and then calls the Storage Insights API to acknowledge the alert. If the alert is deemed unnecessary, the Update Document → Delete Alert branch marks the alert as deleted in Elastic before calling the API to remove it.
Turning Alerts into Insights: Elastic as the Analytics Engine
Up to this point, Elastic has acted as the memory layer for the AI agent and the system of record for the alert lifecycle. But the real power of Elastic emerges when we begin to treat this growing dataset as an observability and analytics platform.
Every alert flowing through the workflow now becomes structured, queryable data:
- Raw alert payload from IBM Storage Insights
- AI classification and summary
- Similar incident matches
- Slack discussions and human decisions
- Final resolution (acknowledged or deleted)
- Time taken to resolve
Over time, this creates a rich dataset describing how your organization actually handles storage incidents.
Using Kibana dashboards, we can now answer questions that were previously impossible without manual reporting:
Operational Analytics
- How many alerts are generated per day/week/month?
- Which storage systems generate the most noise?
- What percentage of alerts are auto-resolved vs require human action?
AI Effectiveness Analytics
- How often does the AI recommendation match the human decision?
- How many alerts were auto-closed due to similarity detection?
- Which alert types still require manual investigation?
SRE Productivity Analytics
- Mean time to acknowledge (MTTA)
- Mean time to resolve (MTTR)
- Alert volume by severity and category
- Peak alert hours and workload distribution
Because Elastic stores the full lifecycle of every alert, these dashboards are created without additional data pipelines — they are built directly on the same index used by the AI agent.
Conclusion
We started with a familiar problem: alert fatigue. IBM Storage Insights provides powerful visibility into enterprise storage environments, but like any monitoring platform, its value multiplies when alerts can be triaged, enriched, and acted upon automatically. By combining n8n, AI, Elastic, Slack, and human expertise, we transformed a simple webhook integration into a complete agentic remediation workflow. Most importantly, this approach demonstrates how modern platforms like Elastic can evolve from search and analytics tools into the foundation of agentic operations.
Opinions expressed by DZone contributors are their own.
Comments