Aggregated Audit Logging With Google Cloud and Python
Get meaningful insights into your website's performance using Google Cloud and Python to allow you to visually identify performance trends.
Join the DZone community and get the full member experience.
Join For FreeIn this post, we will be aggregating all of our logs into Google BigQuery Audit Logs. Using big data techniques we can run our audit log aggregation in the cloud.
Essentially, we are going to take some Apache2 server access logs from a production web server (this one in fact), convert the log file line-by-line to JSON data, publish that JSON data to a Google PubSub topic, transform the data using Google DataFlow, and store the resulting log file in Google BigQuery long-term storage. It sounds a lot harder than it actually is.
Why Go Through This?
This gives us the ability to do some big things with our data using big data principles. For example, with the infrastructure as outlined, we have a log analyzer akin to Splunk but we can use standard SQL to analyze the logs. We could pump the data into Graphite/Graphana to visually identify trends. And the best part is that it only takes a few lines of Python code!
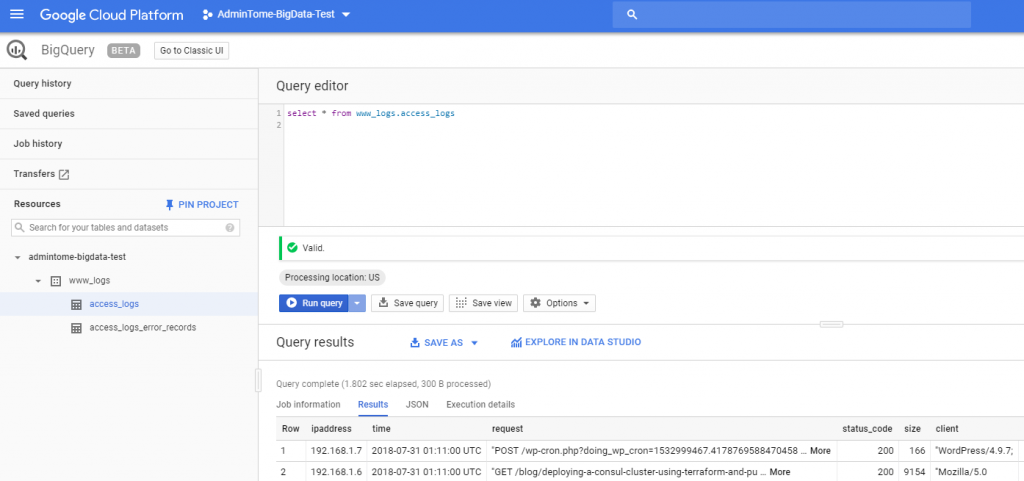
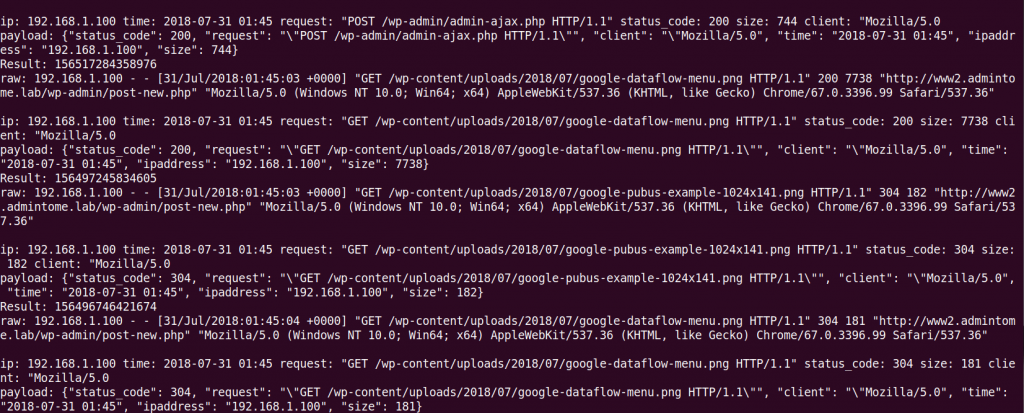
Just so you know, looking at my actual production logs in this screenshot, I just realized I have my HTTP reverse proxy misconfigured. The IP address in the log should be the IP address from my website visitor. There you go, the benefits of Big Data in action!
Assumptions
I am going to assume that you have a Google GCP account. If not, then you can signup for the Google Cloud Platform Free Tier.
Please note: The Google solutions I outline in this post can cost you some money. Check the Google Cloud Platform Pricing Calculator to see what you can expect. You will need to associate a billing account to your project in order to follow along with this article.
I also assume you know how to create a service account in IAM. Refer to the Creating and Managing Service Accounts document for help completing this.
Finally, I assume that you know how to enable the API for Google PubSub. If you don't then don't worry there will be a popup when you enable Google PubSub that tells you what to do.
Configuring Google PubSub
Let's get down to the nitty-gritty. The first thing we need to do is enable Google PubSub for our Project. This article assumes you already have a project created in GCP. If you don't you can follow the Creating and Managing Projects document on Google Cloud.
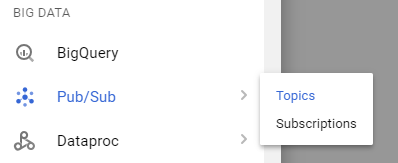
Next, go to Google PubSub from the main GCP menu on the right.
If this is your first time here, it will tell you to create a new topic.
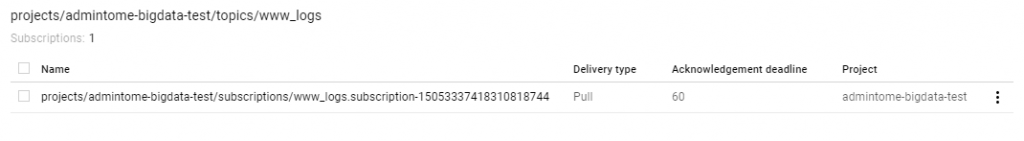
Topic names must look like this projects/{project}/topics/{topic}. My topic was projects/admintome-bigdata-test/topics/www_logs.
Click on Create and your topic is created. Pretty simple stuff so far.
Later when we start developing our application in Python we will push JSON messages to this topic. Next, we need to configure Google DataFlow to transform our JSON data into something we can insert into our Google BigQuery table.
Configuring Google DataFlow
Google was nice to us and includes a ton of templates that allow us to connect many of the GCP products to each other to provide robust cloud solutions.
Before we actually go to configure Google DataFlow we need to have a Google Storage Bucket configured. If you don't know how to do this follow the Creating Storage Buckets document on GCP. Now that you have a Google Storage Bucket ready make sure you remember the Storage Bucket name because we will need it next.
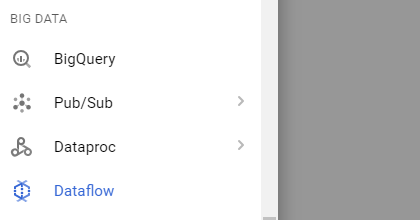
First, go to DataFlow from the GCP menu.
Again, if this is your first time here GCP will ask you to create a job from the template.
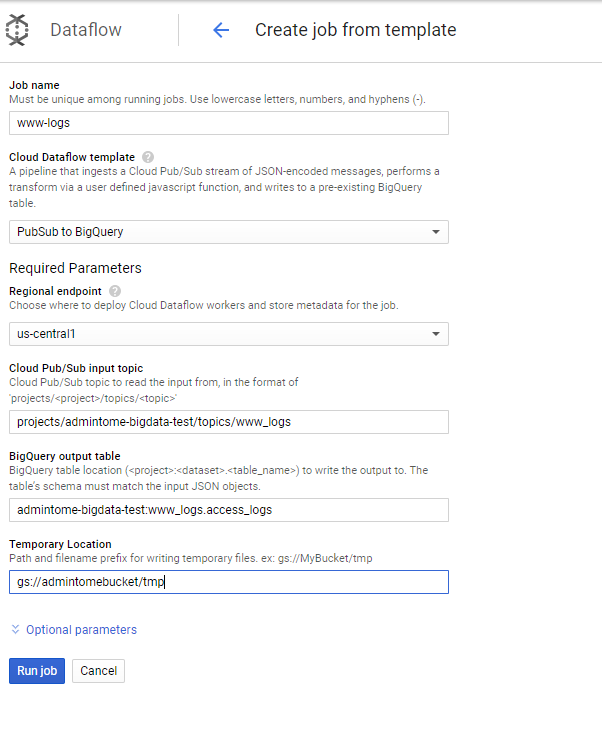
Here you can see that I gave it a Job name of www-logs. Under Cloud DataFlow template select PubSub to BigQuery.
Next, we need to enter the Cloud Pub/Sub input topic. Given my example topic from above, I set this to projects/admintome-bigdata-test/topics/www_logs.
Now we need to tell it the Google BigQuery output table to use. In this example, I use admintome-bigdata-test:www_logs.access_logs.
Now it is time to enter that Google Storage bucket information I talked about earlier. The bucket I created was named admintomebucket.
In the Temporary Location field enter "gs://{bucketname}/tmp".
After you click on "create," you will see a pretty diagram of the DataFlow:
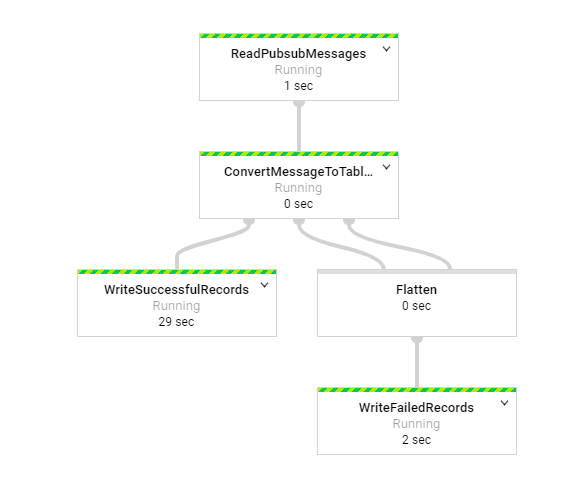
What do we see here? Well, the first task in the flow is a ReadPubsubMessages task that will consume messages from the topic we gave earlier. The next task is the ConvertMessageToTable task which takes our JSON data and converts it to a table row. It then tries to append the table we specified in the parameters of the DataFlow. If it is successful then you will have a new table in BigQuery. Any problems then it creates a new table called access_logs_error_records. If this table doesn't exit it will create the table first. Actually, this is true for our original table too. We will verify this later after we write and deploy our Python application.
Python BigQuery Audit Logs
Now for the fun part of creating our BigQuery Audit Logs solution. Let's get to coding.
Preparing a Python environment. Use virtualenv or pyenv to create a python virtual environment for our application.
Next, we need to install some Python modules to work with Google Cloud.
$ pip install google-cloud-pubsubHere is the code to our application:
producer.py
import time
import datetime
import json
from google.cloud import bigquery
from google.cloud import pubsub_v1


def parse_log_line(line):
    try:
        print("raw: {}".format(line))
        strptime = datetime.datetime.strptime
        temp_log = line.split(' ')
        entry = {}
        entry['ipaddress'] = temp_log[0]
        time = temp_log[3][1::]
        entry['time'] = strptime(
            time, "%d/%b/%Y:%H:%M:%S").strftime("%Y-%m-%d %H:%M")
        request = " ".join((temp_log[5], temp_log[6], temp_log[7]))
        entry['request'] = request
        entry['status_code'] = int(temp_log[8])
        entry['size'] = int(temp_log[9])
        entry['client'] = temp_log[11]
        return entry
    except ValueError:
        print("Got back a log line I don't understand: {}".format(line))
        return None


def show_entry(entry):
    print("ip: {} time: {} request: {} status_code: {} size: {} client: {}".format(
        entry['ipaddress'],
        entry['time'],
        entry['request'],
        entry['status_code'],
        entry['size'],
        entry['client']))


def follow(syslog_file):
    publisher = pubsub_v1.PublisherClient()
    topic_path = publisher.topic_path(
        'admintome-bigdata-test', 'www_logs')
    syslog_file.seek(0, 2)
    while True:
        line = syslog_file.readline()
        if not line:
            time.sleep(0.1)
            continue
        else:
            entry = parse_log_line(line)
            if not entry:
                continue
            show_entry(entry)
            row = (
                entry['ipaddress'],
                entry['time'],
                entry['request'],
                entry['status_code'],
                entry['size'],
                entry['client']
            )
            result = publisher.publish(topic_path, json.dumps(entry).encode())
            print("payload: {}".format(json.dumps(entry).encode()))
            print("Result: {}".format(result.result()))


f = open("/var/log/apache2/access.log", "rt")
follow(f)
The first function we use is the follow function, which is from a StackOverFlow Answer to tail a log file. The follow function reads a line from a log file (/var/log/apache/access.log) as it arrives and sends it to the parse_log_line function.
The parse_log_line function is a crude function that parses the standard Apache2 access.log lines and creates a dict of the values called entry. This function could use a lot of work, I know. It then returns the entry dict back to our follow function.
The follow function then converts the entry dict into JSON and sends it to our Google PubSub Topic with these lines:
publisher = pubsub_v1.PublisherClient()
topic_path = publisher.topic_path('admintome-bigdata-test', 'www_logs')
result = publisher.publish(topic_path, json.dumps(entry).encode())
That's all there is to it. Deploy the application to your production web server and run it and you should see your log files sent to your Google PubSub Topic.
Viewing BigQuery Audit Logs
Now we have data being published to our Google PubSub, and the Google DataFlow process is pushing that to our BigQuery table, we can examine our results.
Go to BigQuery in the GCP menu.
You will see our BigQuery resource admintome-bigdata-test.
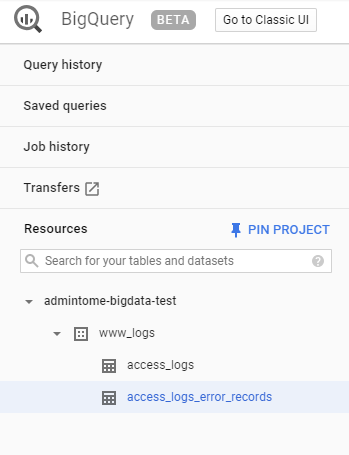
You can also see our tables under www_logs: access_logs. If DataFlow had any issues adding rows to your table (like mine did at first) then you will see the associated error_records table.
Click on access_logs and you will see the Query editor. Enter a simple SQL query to look at your data.
SELECT * FROM www_logs.access_logsClick on the "Run query" button and you should see your logs!
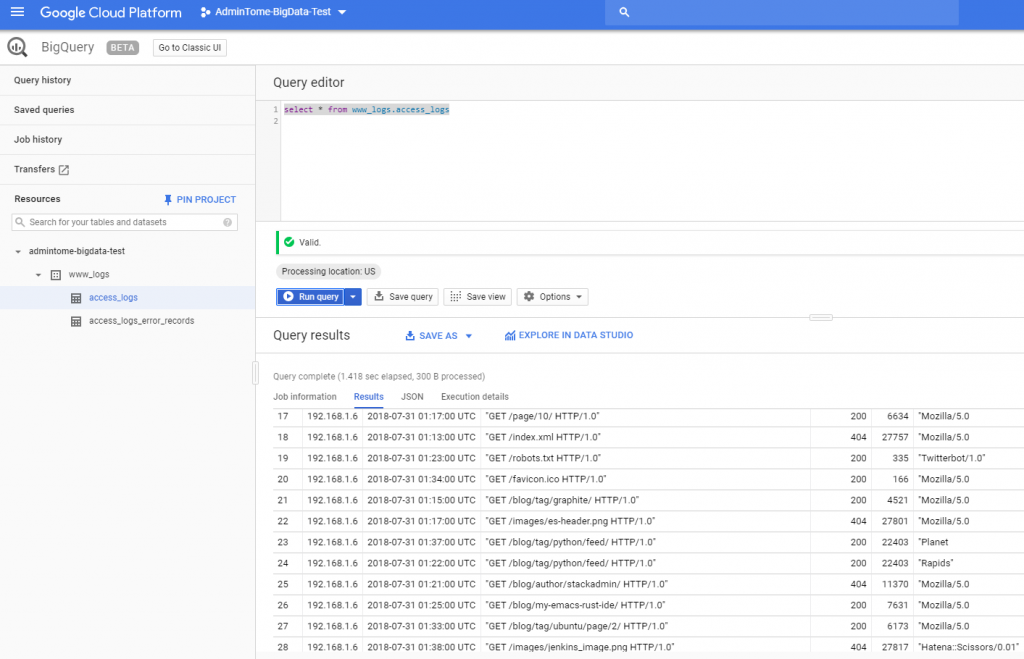
Using simple SQL queries we can combine this table with other tables and get some meaningful insights into our website's performance using BigQuery Audit Logs!
I hope you enjoyed this post. If you did then please share it on Facebook, Twitter, and Google+. Also be sure to comment below, I would love to hear from you.
Published at DZone with permission of Bill Ward. See the original article here.
Opinions expressed by DZone contributors are their own.
Comments