AI-Assisted Kubernetes Diagnostics: A Practical Implementation
Proof-of-concept tool using GPT-4 to detect failing Kubernetes pods, analyze logs and events, and suggest fixes with human approval for common issues.
Join the DZone community and get the full member experience.
Join For FreeKubernetes troubleshooting follows a repetitive pattern: identify unhealthy pods, examine descriptions, review logs, analyze events, and correlate information to find root causes. For common issues like CrashLoopBackOff, ImagePullBackOff, or OOMKilled pods, engineers repeat the same diagnostic steps daily, sometimes dozens of times per week in busy production environments.
The traditional workflow requires running multiple kubectl commands in sequence, mentally correlating outputs from pod descriptions, container logs, event streams, and resource configurations. An engineer investigating a single failing pod might execute 5–10 commands, read through hundreds of lines of output, and spend 10-30 minutes connecting the dots between symptoms and root causes. For straightforward issues like memory limits or missing images, this time investment yields solutions that follow predictable patterns.
Large language models can process this same information — pod descriptions, logs, events — and apply pattern recognition trained on thousands of similar scenarios. Instead of an engineer manually correlating data points, an LLM can analyze the complete context at once and suggest likely root causes with specific remediation steps.
This article walks through a proof-of-concept tool available at [opscart/k8s-ai-diagnostics](https://github.com/opscart/k8s-ai-diagnostics). The tool detects unhealthy pods in a namespace, analyzes them using OpenAI GPT-4, and provides diagnostics with suggested remediation steps. For certain failure types like CrashLoopBackOff or OOMKilled, it applies fixes automatically with human approval. The implementation stays minimal — just Python, kubectl, and the OpenAI API — making it easy to deploy and test in existing Kubernetes environments.
The Problem Space
Manual Diagnostic Overhead
When a pod fails in Kubernetes, the diagnostic process typically looks like this:
# Check pod status
kubectl get pods -n production

# Examine pod details
kubectl describe pod failing-pod -n production

# Review container logs
kubectl logs failing-pod -n production

# Check previous container logs if crashed
kubectl logs failing-pod -n production --previous

# Examine events
kubectl get events -n production --field-selector involvedObject.name=failing-pod
For experienced engineers, this workflow becomes muscle memory. However, it still requires:
- Context switching between multiple kubectl commands
- Mental correlation of information across different outputs
- Knowledge of common failure patterns and their solutions
- Time to write and apply remediation patches
Common Failure Patterns
Kubernetes pods fail in predictable ways:
- ImagePullBackOff: Wrong image name, missing credentials, or registry connectivity issues
- CrashLoopBackOff: Application startup failures, missing dependencies, or configuration errors
- OOMKilled: Container memory usage exceeds defined limits
- Probe Failures: Readiness or liveness probes fail due to application issues or misconfigurations
Each pattern has typical root causes and standard remediation approaches. This repetitive nature makes automation worth exploring.
The Solution: LLM-Powered Diagnostics
The k8s-ai-diagnostics project implements an agent that:
- Scans a namespace for unhealthy pods
- Collects pod descriptions and logs via kubectl
- Sends context to OpenAI GPT-4 for analysis
- Receives structured diagnostics, including root cause, reasons, and fixes
- Optionally applies remediation with human approval
Architecture
The tool uses a simple pipeline:
┌──────────────────┐
│  kubectl CLI     │
│  (pod status,    │
│  descriptions,   │
│  logs)           │
└────────┬─────────┘
         │
         ▼
┌──────────────────┐
│  Python Script   │
│  - Detect pods   │
│  - Collect data  │
│  - Build context │
└────────┬─────────┘
         │
         ▼
┌──────────────────┐
│  OpenAI GPT-4    │
│  - Analyze data  │
│  - Root cause    │
│  - Suggest fixes │
└────────┬─────────┘
         │
         ▼
┌──────────────────┐
│  Remediation     │
│  - Human approve │
│  - Apply patches │
│  - kubectl cmds  │
└──────────────────┘
The implementation keeps dependencies minimal: Python 3.8+, kubectl, and the OpenAI API.
Installation and Setup
Prerequisites
# Python 3.8 or higher
python3 --version

# kubectl configured with cluster access
kubectl cluster-info

# OpenAI API key
export OPENAI_API_KEY="your-api-key"
Installation
# Clone repository
git clone https://github.com/opscart/k8s-ai-diagnostics.git
cd k8s-ai-diagnostics

# Create virtual environment
python3 -m venv venv
source venv/bin/activate

# Install dependencies
pip install -r requirements.txt
Deploy Test Scenarios
The repository includes test deployments that simulate common failures:
# Create namespace
kubectl create namespace ai-apps
# Deploy test scenarios
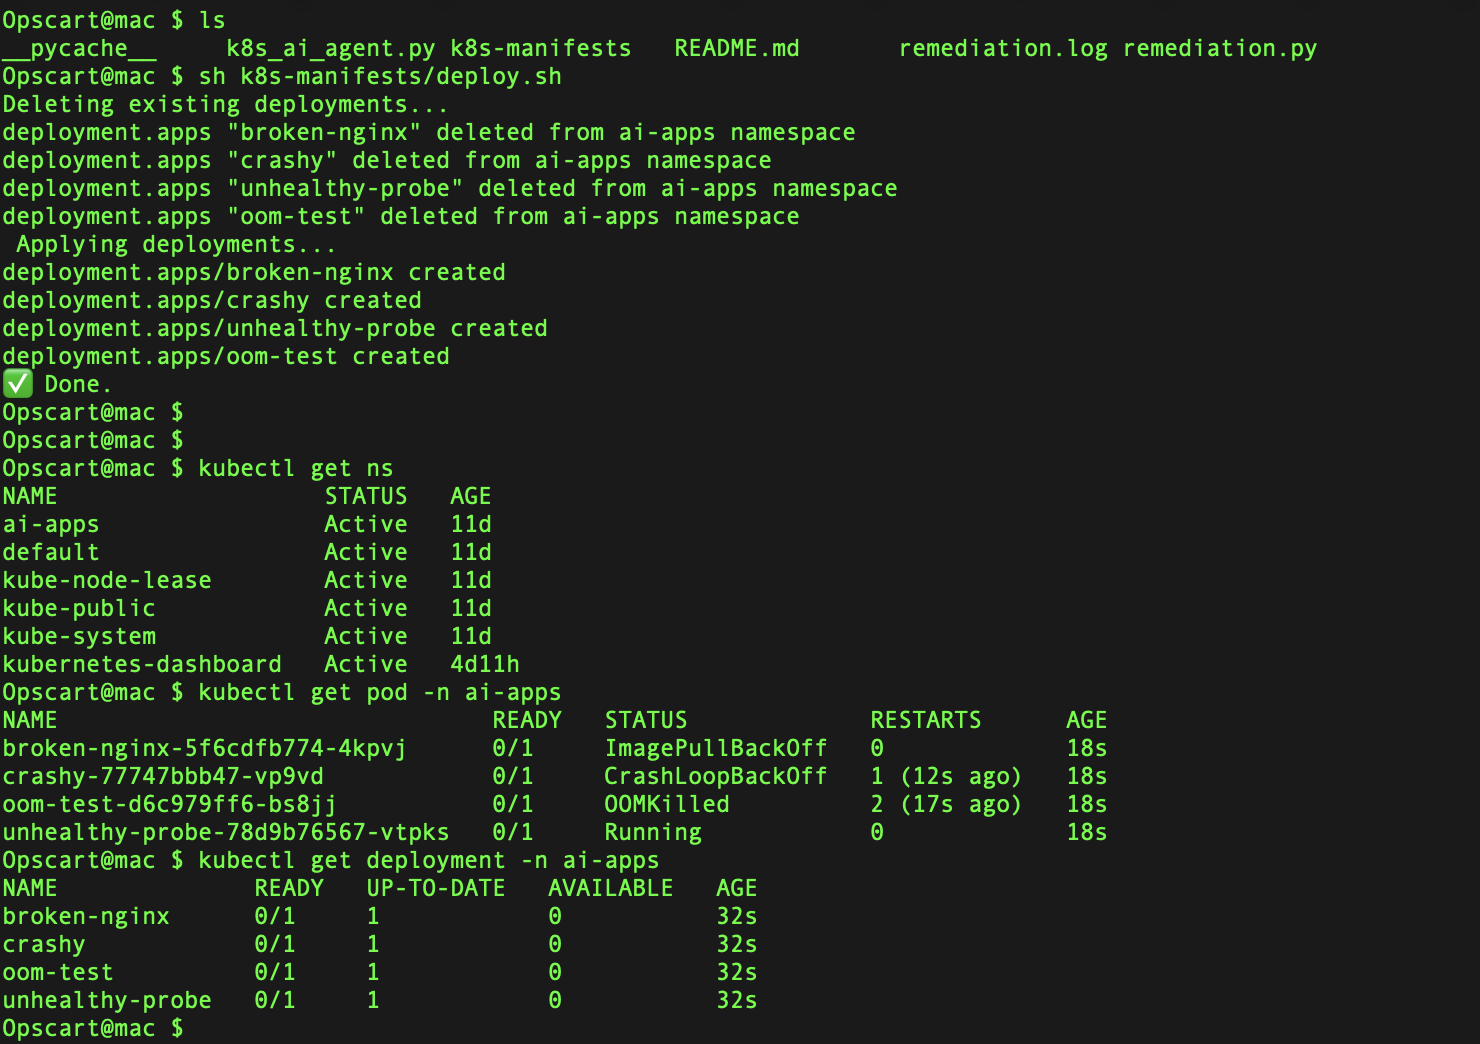
sh k8s-manifests/deploy.shThis deploys four intentionally broken pods:
- broken-nginx: ImagePullBackOff (invalid image name)
- crashy: CrashLoopBackOff (container exits immediately)
- oom-test: OOMKilled (exceeds memory limits)
- unhealthy-probe: Probe failures (missing expected files)
Verify deployment:
kubectl get pods -n ai-appsExpected output:
NAME                               READY   STATUS             RESTARTS      AGE
broken-nginx-5f6cdfb774-m7kw7      0/1     ImagePullBackOff   0             2m
crashy-77747bbb47-mr75j            0/1     CrashLoopBackOff   6             2m
oom-test-5fd8f6b8d9-c9p52          0/1     OOMKilled          3             2m
unhealthy-probe-78d9b76567-5x8h6   0/1     Running            1             2m
Running the Diagnostic Agent
Execute the agent:
python3 k8s_ai_agent.pyThe script prompts for a namespace:
Enter the namespace to scan: ai-appsExample Diagnostic Session
Found 4 unhealthy pod(s): ['broken-nginx', 'oom-test', 'crashy', 'unhealthy-probe']

Analyzing pod: crashy...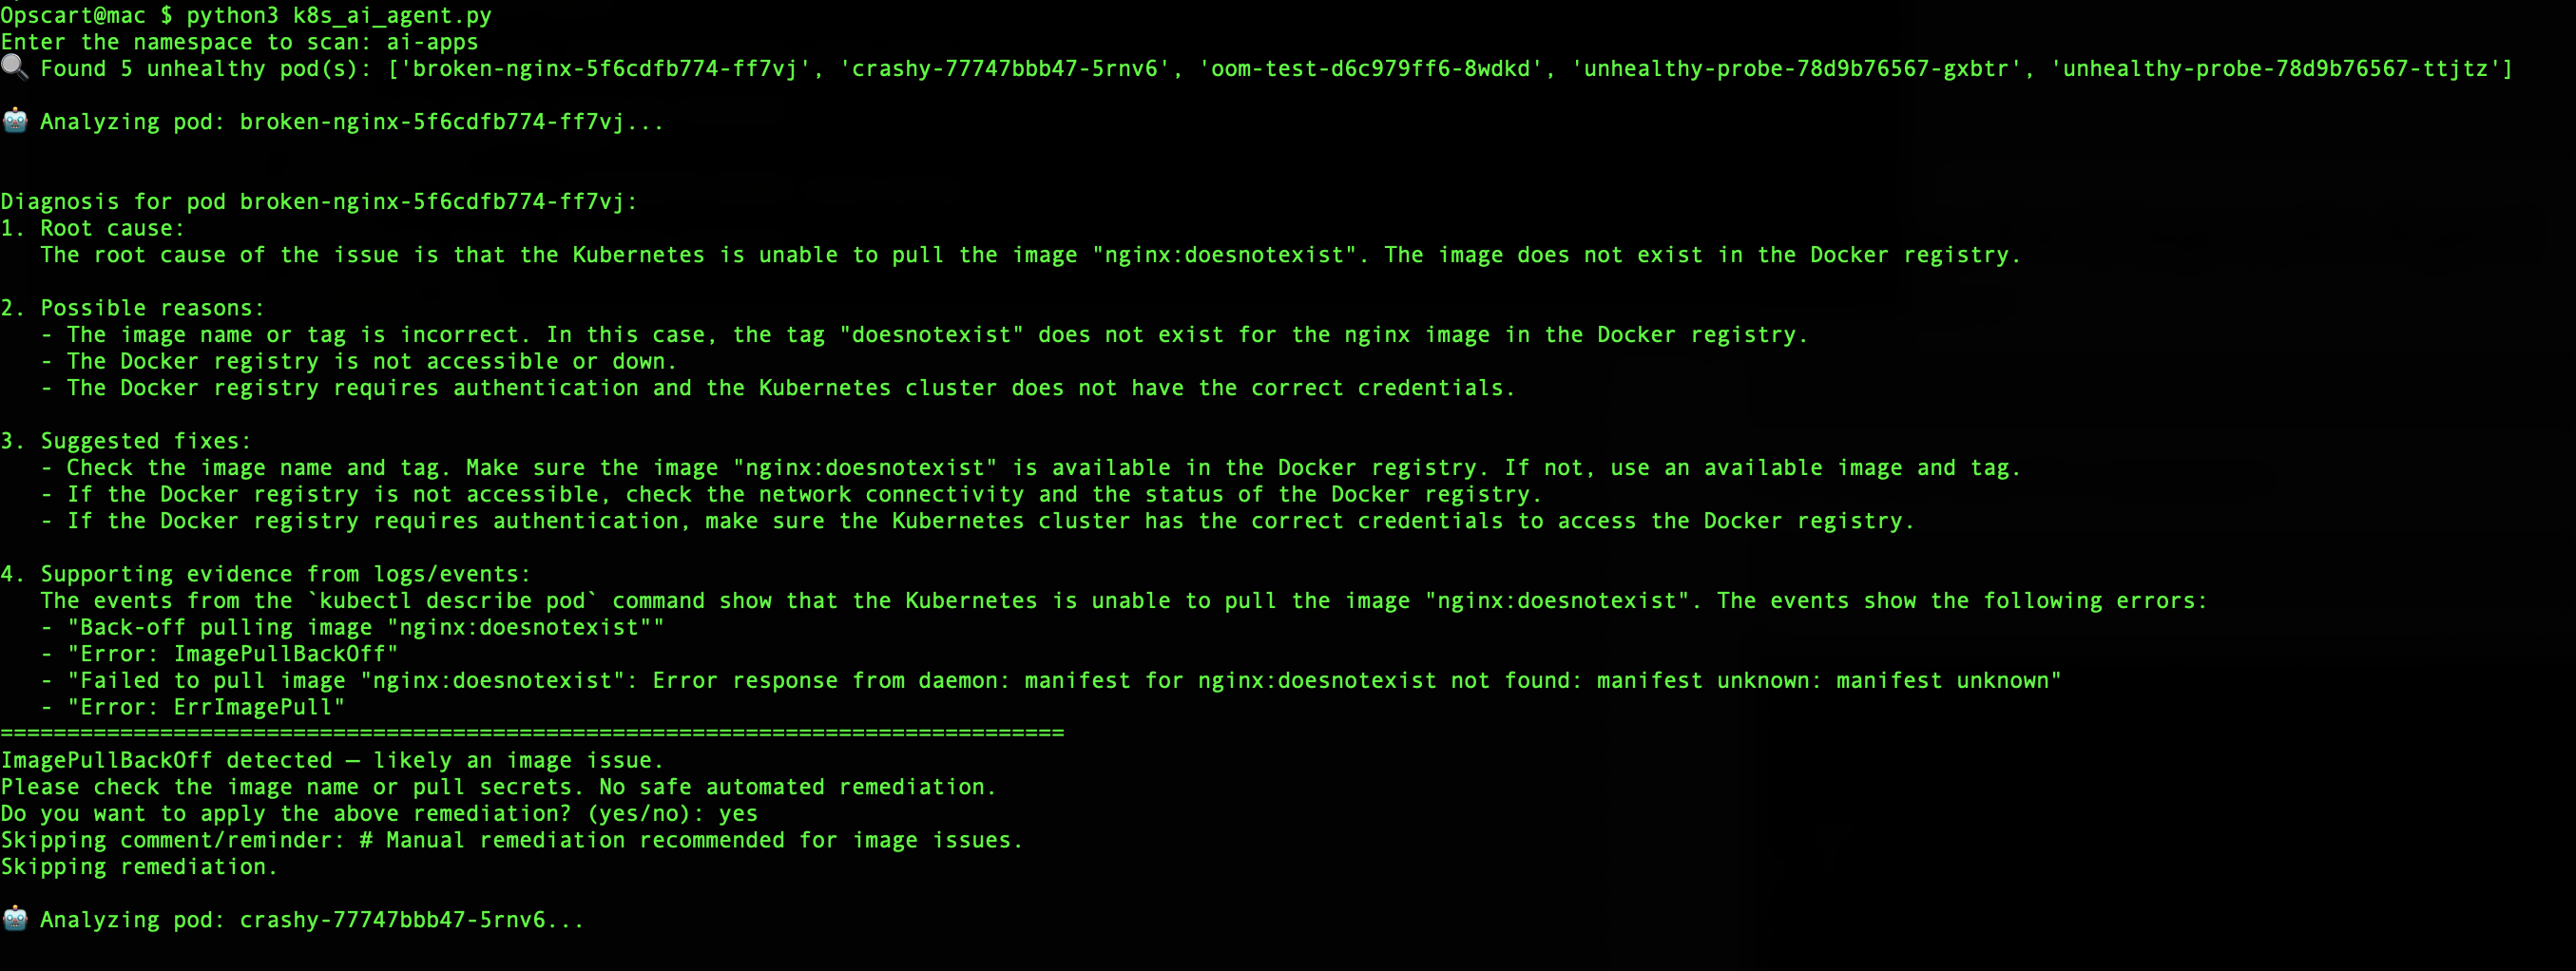
k8s_ai_agent.py execution
ROOT CAUSE ANALYSIS:
Container is exiting immediately with code 1. The application fails to start
due to a missing dependency or configuration error.

DIAGNOSTIC DETAILS:
- Exit Code: 1 (general application error)
- Container restart count: 6
- Last termination reason: Error
- No application logs available (exits too quickly)

SUGGESTED REMEDIATION:
1. Review container entrypoint and command
2. Check for missing environment variables
3. Verify required config files are mounted
4. Add verbose logging to startup process

IMMEDIATE ACTION:
Restart the pod to clear transient state issues.
The agent then prompts:
Detected CrashLoopBackOff. Suggest restarting the pod.
Do you want to apply the above remediation? (yes/no): yes
Upon approval, it executes:
kubectl delete pod crashy-77747bbb47-mr75j -n ai-appsResult:
Deployment crashy is now healthy.OOMKilled Remediation Example
For memory issues:
Analyzing pod: oom-test...

ROOT CAUSE ANALYSIS:
Container terminated due to Out-of-Memory (OOM) condition. Memory consumption
exceeded the defined limit of 128Mi.

SUGGESTED REMEDIATION:
Increase memory limit to accommodate actual usage patterns. Based on termination
history and typical application requirements, recommend 400Mi limit.

PATCH TO APPLY:
spec:
  template:
    spec:
      containers:
      - name: oom-test
        resources:
          limits:
            memory: "400Mi"
          requests:
            memory: "200Mi"

Detected OOMKilled. Suggest increasing memory limits.
Do you want to apply the above remediation? (yes/no): yes
The agent patches the deployment:
kubectl patch deployment oom-test -n ai-apps --type='json' \
  -p='[{"op": "replace", "path": "/spec/template/spec/containers/0/resources/limits/memory", "value":"400Mi"}]'
ImagePullBackOff Handling
For image issues, the agent identifies the problem but skips automatic remediation:
Analyzing pod: broken-nginx...

ROOT CAUSE ANALYSIS:
Failed to pull container image "nginx:nonexistent-tag". The specified image
tag does not exist in the registry.

DIAGNOSTIC DETAILS:
- Image: nginx:nonexistent-tag
- Error: manifest for nginx:nonexistent-tag not found
- Registry: docker.io

SUGGESTED REMEDIATION:
1. Verify image tag exists: docker pull nginx:nonexistent-tag
2. Check image name spelling and tag format
3. Ensure registry credentials are configured if using private registry
4. Update deployment with correct image reference

ImagePullBackOff detected — likely an image issue.
Skipping remediation.
This requires manual intervention because the correct image name needs human judgment.
How GPT-4 Analysis Works
Context Building
The agent collects context before sending to GPT-4:
def collect_pod_context(namespace, pod_name):
    context = {
        'pod_description': run_kubectl(['describe', 'pod', pod_name, '-n', namespace]),
        'pod_logs': run_kubectl(['logs', pod_name, '-n', namespace, '--tail=100']),
        'previous_logs': run_kubectl(['logs', pod_name, '-n', namespace, '--previous', '--tail=50']),
        'pod_events': run_kubectl(['get', 'events', '-n', namespace,
                                   '--field-selector', f'involvedObject.name={pod_name}'])
    }
    return context
Prompt Construction
The system prompt guides GPT-4 to provide structured responses:
system_prompt = """
You are a Kubernetes expert analyzing pod failures. Provide:

1. ROOT CAUSE ANALYSIS: Clear identification of the primary issue
2. DIAGNOSTIC DETAILS: Supporting evidence from events and logs
3. SUGGESTED REMEDIATION: Specific fixes with commands or YAML patches
4. IMMEDIATE ACTION: What to do right now

Focus on actionable advice. For resource issues, suggest specific limits.
For configuration problems, identify missing or incorrect settings.
"""

user_prompt = f"""
Analyze this Kubernetes pod failure:

POD NAME: {pod_name}
NAMESPACE: {namespace}
STATUS: {pod_status}

DESCRIPTION:
{pod_description}

LOGS:
{logs}

EVENTS:
{events}

Provide detailed diagnosis and remediation steps.
"""
GPT-4 Response Parsing
The agent extracts structured information from GPT-4's response:
def parse_diagnosis(response):
    diagnosis = {
        'root_cause': extract_section(response, 'ROOT CAUSE'),
        'details': extract_section(response, 'DIAGNOSTIC DETAILS'),
        'remediation': extract_section(response, 'SUGGESTED REMEDIATION'),
        'immediate_action': extract_section(response, 'IMMEDIATE ACTION')
    }
    return diagnosis
The tool implements different remediation approaches based on failure type:
| Issue | Diagnosis | Automated Action | Rationale |
|---|---|---|---|
| ImagePullBackOff | Image issue | None (manual) | Requires human judgment on correct image |
| CrashLoopBackOff | Container crash | Pod restart | Clears transient state issues |
| OOMKilled | Memory overuse | Patch memory limits | Prevents future OOM kills |
| Probe failure | Misconfiguration | None (manual) | Needs application-level fixes |
Restart Remediation
For CrashLoopBackOff:
def restart_pod(namespace, pod_name):
    """Delete pod to trigger recreation by deployment"""
    run_kubectl(['delete', 'pod', pod_name, '-n', namespace])

    # Wait for new pod to be ready
    wait_for_pod_ready(namespace, deployment_name)
Memory Patch Remediation
For OOMKilled:
def patch_memory_limit(namespace, deployment_name, new_limit='400Mi'):
    """Patch deployment to increase memory limit"""
    patch = {
        'spec': {
            'template': {
                'spec': {
                    'containers': [{
                        'name': get_container_name(namespace, deployment_name),
                        'resources': {
                            'limits': {'memory': new_limit},
                            'requests': {'memory': str(int(new_limit[:-2]) // 2) + 'Mi'}
                        }
                    }]
                }
            }
        }
    }

    run_kubectl(['patch', 'deployment', deployment_name, '-n', namespace,
                 '--type', 'strategic', '-p', json.dumps(patch)])
Important note: The current implementation uses a fixed memory value (400Mi) as a remediation. This is a limitation — the actual memory size should be determined from historical usage patterns captured through metrics systems like Prometheus. Without access to actual resource consumption data, the tool cannot make informed decisions about appropriate memory limits. This is why Prometheus integration (discussed in the Future Work section) is necessary for production use.
Human Approval Gate
All remediation actions require explicit approval:
def apply_remediation(diagnosis, namespace, resource):
    print(f"\n{diagnosis['immediate_action']}")
    print(f"\nSUGGESTED FIX:\n{diagnosis['remediation']}")

    response = input("\nDo you want to apply the above remediation? (yes/no): ")

    if response.lower() == 'yes':
        execute_remediation(namespace, resource, diagnosis)
    else:
        print("Skipping remediation. Manual intervention required.")
Real-World Example: Complete Workflow
Here's a complete diagnostic session for an OOMKilled pod:
$ python3 k8s_ai_agent.py
Enter the namespace to scan: production

Found 1 unhealthy pod(s): ['api-server-7d5f8b-xk2p9']

Analyzing pod: api-server-7d5f8b-xk2p9...

=== GPT-4 ANALYSIS ===

ROOT CAUSE ANALYSIS:
The api-server container was terminated by the OOM killer. Memory usage exceeded
the configured limit of 256Mi. Analysis of previous terminations shows this is
a recurring pattern, indicating the application's memory footprint has grown
beyond the initial resource allocation.

DIAGNOSTIC DETAILS:
- Container terminated with reason: OOMKilled
- Memory limit: 256Mi
- Restart count: 8 (all OOM-related)
- Last termination: 2 minutes ago
- Pattern: Crashes occur approximately 15-20 minutes after startup
- Application logs show increasing heap usage before termination

MEMORY ANALYSIS:
Based on the termination pattern and logs:
- Initial memory usage: ~80Mi
- Pre-crash memory usage: ~250Mi (approaching limit)
- Growth pattern suggests memory leak or legitimate increased load
- Recommend 512Mi limit to provide headroom

SUGGESTED REMEDIATION:
1. Immediate: Increase memory limit to 512Mi
2. Set request to 384Mi (75% of limit)
3. Monitor actual usage with: kubectl top pod api-server-7d5f8b-xk2p9 -n production
4. Investigate memory leak if usage continues growing
5. Consider implementing horizontal pod autoscaling

YAML PATCH:
spec:
  template:
    spec:
      containers:
      - name: api-server
        resources:
          limits:
            memory: "512Mi"
          requests:
            memory: "384Mi"

IMMEDIATE ACTION:
Patch deployment with increased memory limits

======================

Detected OOMKilled. Suggest increasing memory limits.

REMEDIATION PLAN:
- Patch deployment 'api-server' memory limit to 512Mi
- Set memory request to 384Mi
- Trigger rolling restart

Do you want to apply the above remediation? (yes/no): yes

Applying remediation...
deployment.apps/api-server patched

Waiting for new pod to be ready...
Pod api-server-7d5f8b-n8x4m is now Running

Deployment api-server is now healthy.

NEXT STEPS:
1. Monitor pod memory usage: kubectl top pod -n production
2. Check application metrics for memory leak indicators
3. Review application logs for memory-related warnings
4. Consider adding memory usage alerts
What Works Well
Rapid Triage
The tool scans an entire namespace and identifies all unhealthy pods in seconds, providing immediate visibility into cluster health.
Context Analysis
GPT-4 analyzes pod descriptions, logs, and events together, correlating information that might require multiple mental steps for a human operator.
Knowledge Application
The model applies Kubernetes best practices and common troubleshooting patterns without requiring the operator to remember specific commands or solutions.
Executable Output
Rather than just identifying problems, the tool provides specific kubectl commands, YAML patches, and remediation scripts ready to execute.
Safe Automation
The human approval gate ensures operators review recommendations before applying changes, preventing automated mistakes in production environments.
Current Limitations
Single LLM Provider
The POC only supports OpenAI GPT-4. Adding support for Anthropic Claude, local models via Ollama, or Azure OpenAI would improve flexibility and reduce vendor lock-in.
Simple Remediation Logic
Current automated fixes are limited:
- Pod restarts for CrashLoopBackOff
- Memory limit patches for OOMKilled
- No automated fixes for ImagePullBackOff or probe failures
More work would require:
- Image name validation and correction
- Probe configuration analysis and fixes
- Network policy adjustments
- RBAC issue resolution
Single-Container Assumption
The memory patching logic assumes deployments have a single container. Multi-container pods require more analysis to determine which container needs resource adjustments.
No Historical Context
The agent analyzes each pod independently without considering:
- Previous diagnostic sessions
- Remediation success/failure patterns
- Cluster-wide trends
- Related failures in other namespaces
Limited Observability Integration
The tool relies solely on kubectl output. Integration with monitoring systems would provide:
- Historical resource usage trends
- Performance metrics before failures
- Application-specific telemetry
- Distributed tracing context
CLI-Only Interface
The current implementation is command-line interactive. Production use would benefit from:
- Web dashboard for visualization
- API endpoints for integration
- Slack/Teams notifications
- Incident management system integration
Cost Considerations
Each diagnostic session calls the OpenAI API. For large clusters with many unhealthy pods, costs can accumulate. Implementing caching, local models, or rate limiting would help manage expenses.
Security Concerns
Sending pod logs to external APIs (OpenAI) raises data security issues:
- Logs may contain sensitive information
- API keys, tokens, or credentials might leak
- Compliance requirements may prohibit external data transmission
Production deployments need:
- Log sanitization to remove sensitive data
- Local LLM options for sensitive environments
- Audit trails of what data was sent externally
Future Work
Multi-Provider LLM Support
Add support for alternative models:
class LLMProvider:
    def __init__(self, provider='openai', model='gpt-4'):
        self.provider = provider
        self.model = model

    def analyze(self, context):
        if self.provider == 'openai':
            return self._openai_analyze(context)
        elif self.provider == 'anthropic':
            return self._claude_analyze(context)
        elif self.provider == 'ollama':
            return self._ollama_analyze(context)
Prometheus Integration
Incorporate time-series metrics:
def enhance_context_with_metrics(namespace, pod_name):
    metrics = {
        'cpu_usage': query_prometheus(
            f'rate(container_cpu_usage_seconds_total{{pod="{pod_name}"}}[5m])'
        ),
        'memory_usage': query_prometheus(
            f'container_memory_working_set_bytes{{pod="{pod_name}"}}'
        ),
        'restart_history': query_prometheus(
            f'kube_pod_container_status_restarts_total{{pod="{pod_name}"}}'
        )
    }
    return metrics
This integration would solve the current limitation where OOMKilled remediation uses fixed memory values (400Mi). With Prometheus data, the tool could analyze actual memory usage patterns over time and recommend appropriate limits based on real consumption trends rather than arbitrary values.
Feedback Loop
Track remediation success to improve future diagnostics:
class RemediationTracker:
    def record_outcome(self, pod_name, diagnosis, action, success):
        """Track which fixes worked"""
        outcome = {
            'pod': pod_name,
            'issue_type': diagnosis['type'],
            'action_taken': action,
            'successful': success,
            'timestamp': datetime.now()
        }
        self.store_outcome(outcome)

    def get_success_rate(self, issue_type):
        """Calculate success rate for specific issue types"""
        outcomes = self.query_outcomes(issue_type)
        return sum(o['successful'] for o in outcomes) / len(outcomes)
Expanded Remediation
Expand automated fixes:
class AdvancedRemediation:
    def fix_image_pull_error(self, namespace, pod_name, diagnosis):
        """Attempt to fix common image pull issues"""
        # Check if image exists with 'latest' tag
        # Verify imagePullSecrets are configured
        # Test registry connectivity
        # Suggest alternative image sources
        pass

    def fix_probe_failure(self, namespace, deployment, diagnosis):
        """Adjust probe configuration based on actual app behavior"""
        # Analyze startup time from logs
        # Recommend appropriate initialDelaySeconds
        # Suggest probe endpoint alternatives
        pass
Web Dashboard
Build a visualization layer:
// React component for real-time diagnostics
function DiagnosticsDashboard() {
    const [pods, setPods] = useState([]);
    const [analyses, setAnalyses] = useState({});

    useEffect(() => {
        // Poll for unhealthy pods
        fetchUnhealthyPods().then(setPods);
    }, []);

    return (
        <div>
            <PodList pods={pods} onAnalyze={runDiagnostics} />
            <AnalysisPanel analyses={analyses} />
            <RemediationQueue onApprove={applyFix} />
        </div>
    );
}
Incident Management Integration
Connect to existing workflows:
def create_incident_with_diagnosis(pod_name, diagnosis):
    """Create PagerDuty incident with analysis"""
    incident = {
        'title': f'Pod Failure: {pod_name}',
        'description': diagnosis['root_cause'],
        'urgency': determine_urgency(diagnosis),
        'body': {
            'type': 'incident_body',
            'details': format_diagnosis_for_incident(diagnosis)
        }
    }
    pagerduty_client.create_incident(incident)
Getting Started
Quick Start
# Clone and setup
git clone https://github.com/opscart/k8s-ai-diagnostics.git
cd k8s-ai-diagnostics
python3 -m venv venv
source venv/bin/activate
pip install -r requirements.txt

# Set OpenAI API key
export OPENAI_API_KEY="your-key"

# Deploy test scenarios
kubectl create namespace ai-apps
sh k8s-manifests/deploy.sh

# Run diagnostics
python3 k8s_ai_agent.py
# Enter namespace: ai-apps
Production Considerations
Before using in production:
- Test in non-production environments – Verify remediation logic doesn't cause unintended consequences
- Implement log sanitization – Remove sensitive data before sending to OpenAI
- Set up monitoring – Track diagnostic success rates and API costs
- Configure rate limiting – Prevent API quota exhaustion
- Document approval workflows – Define who can approve which types of remediation
- Establish rollback procedures – Know how to revert automated changes
Conclusion
The k8s-ai-diagnostics project demonstrates that LLMs can automate routine Kubernetes troubleshooting tasks. By combining kubectl's data collection capabilities with GPT-4's analytical reasoning, the tool provides diagnostic insights that previously required experienced SRE intervention.
The POC shows particular strength in handling common failure patterns like CrashLoopBackOff and OOMKilled scenarios, where automated remediation can reduce MTTR. The human approval gate maintains safety while allowing operators to move quickly when confident in the recommendations.
However, the current implementation has clear limitations. Production readiness requires addressing security concerns around data transmission, expanding remediation capabilities beyond simple cases, and integrating with existing observability and incident management infrastructure. The OOMKilled remediation, for example, currently uses fixed memory values rather than analyzing actual usage patterns — a gap that Prometheus integration would fill.
For teams experiencing high volumes of routine pod failures, this approach offers a way to reduce operational toil. The tool handles repetitive diagnostic work, letting engineers focus on complex issues that require human judgment and problem-solving. As observability integration improves and remediation logic matures, LLM-augmented troubleshooting will become more viable for production environments.
Additional Resources
- GitHub repository: opscart/k8s-ai-diagnostics
- Kubernetes troubleshooting: kubernetes.io/docs/tasks/debug
- OpenAI API documentation: platform.openai.com/docs
- kubectl reference: kubernetes.io/docs/reference/kubectl
Opinions expressed by DZone contributors are their own.
Comments