An Introduction to Graph Data
In this article, we introduce graph data and graph convolutions, which are key for building graph neural networks (GNNs).
Join the DZone community and get the full member experience.
Join For FreeThis article is an excerpt from the book Machine Learning with PyTorch and Scikit-Learn from the best-selling Python Machine Learning series, updated and expanded to cover PyTorch, transformers, and graph neural networks.
Broadly speaking, graphs represent a certain way we describe and capture relationships in data. Graphs are a particular kind of data structure that is nonlinear and abstract. And since graphs are abstract objects, a concrete representation needs to be defined so the graphs can be operated on. Furthermore, graphs can be defined to have certain properties that may require different representations. Figure 1 summarizes the common types of graphs, which we will discuss in more detail in the following subsections: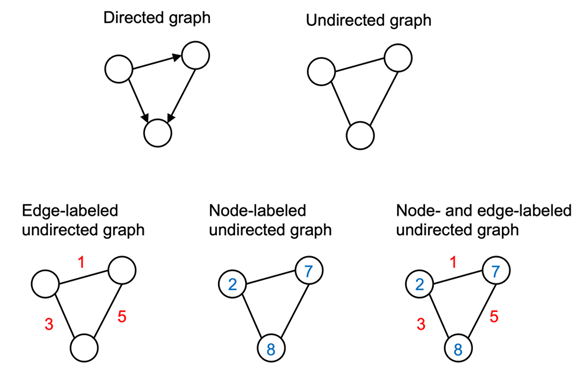
Undirected Graphs
An undirected graph consists of nodes (in graph theory also often called vertices) that are connected via edges where the order of the nodes and their connection does not matter. Figure 2 sketches two typical examples of undirected graphs, a friend graph, and a graph of a chemical molecule consisting of atoms connected through chemical bonds (we will discuss such molecular graphs in more detail in later on):
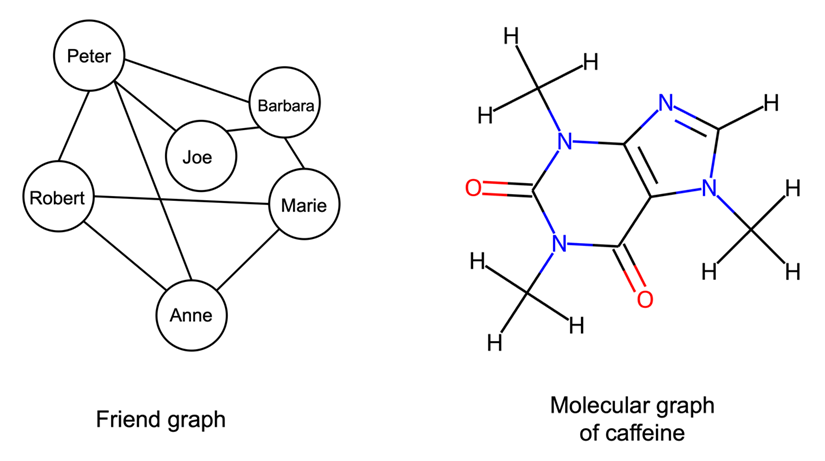
Other common examples of data that can be represented as undirected graphs include images, protein-protein interaction networks, and point clouds.
Mathematically, an undirected graph G is a pair (V, E), where V is a set of the graph’s nodes, and E is the set of edges making up the paired nodes. The graph can then be encoded as a |V|×|V| adjacency matrix A. Each element xij in matrix A is either a 1 or a 0, with 1 denoting an edge between nodes i and j (vice versa, 0 denotes the absence of an edge). Since the graph is undirected, an additional property of A is that xij = xji.
Directed Graphs
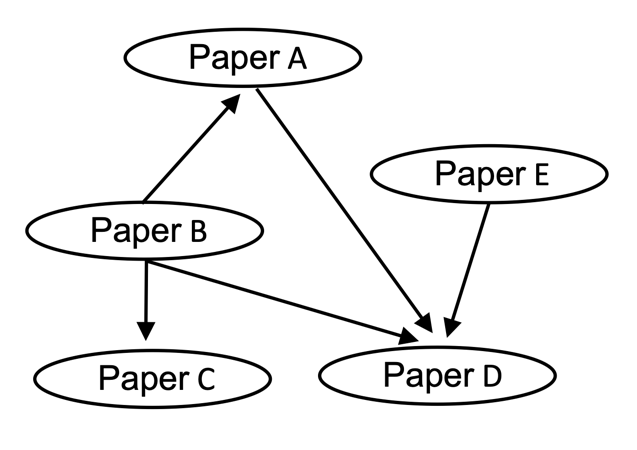
Directed graphs, in contrast to undirected graphs discussed in the previous section, connect nodes via directed edges. Mathematically they are defined in the same way as an undirected graph, except that E, the set of edges, is a set of ordered pairs. Therefore, element xij of A does need not equal xji. An example of a directed graph is a citation network, where nodes are publications and edges from a node are directed toward the nodes of papers that a given paper cited:
Labeled Graphs
Many graphs we are interested in working with have additional information associated with each of their nodes and edges. For example, if you consider the caffeine molecule shown earlier, molecules can be represented as graphs where each node is a chemical element (for example, atom types O, C, N, or H) and each edge is the type of bond (for example, single or double bond) between its two nodes. These node and edge features need to be encoded in some capacity. Given graph G, defined by the node set and edge set tuple (V, E), we define a |V|×fV node feature matrix X, where fV is the length of the label vector of each node. For edge labels, we define an |E|×fE edge feature matrix XE, where fE is the length of the label vector of each edge.
Molecules are an excellent example of data that can be represented as a labeled graph, and we will be working with molecular data throughout the chapter. As such, we will take this opportunity to cover their representation in detail in the next section.
Representing Molecules as Graphs
As a chemical overview, molecules can be thought of as groups of atoms held together by chemical bonds. There are different atoms corresponding to different chemical elements, for example, common elements include carbon (C), oxygen (O), nitrogen (N), and hydrogen (H). Also, there are different kinds of bonds that form the connection between atoms, for example, single or double bonds.
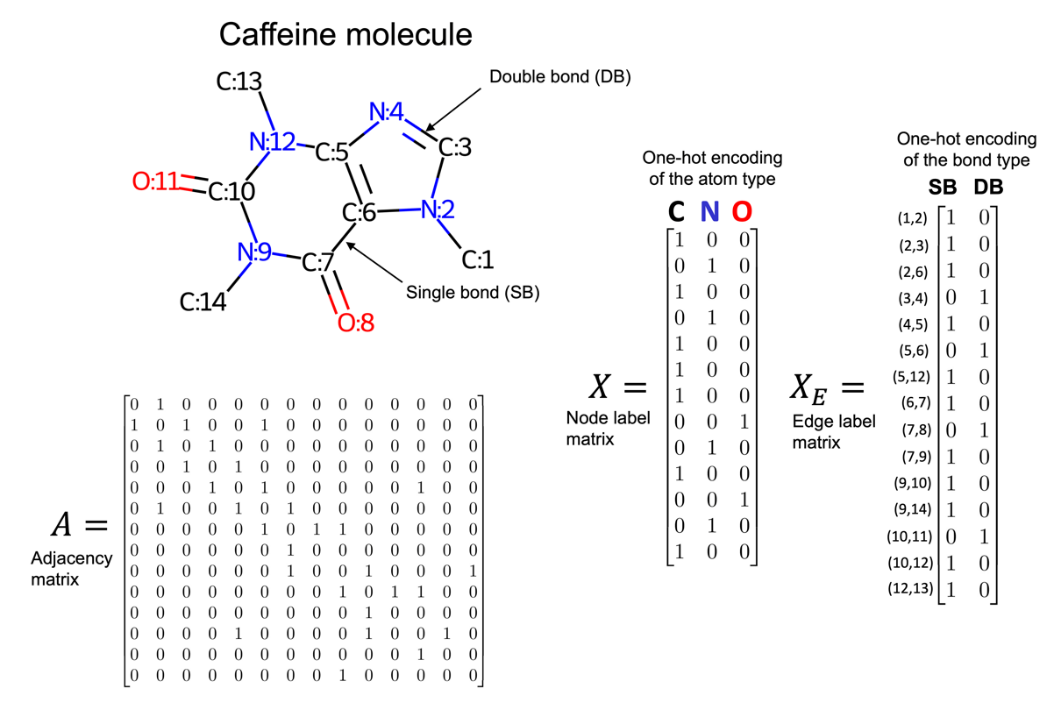
We can represent a molecule as an undirected graph with a node label matrix, where each row is a one-hot encoding of the associated node's atom type. Additionally, there is an edge label matrix where each row is a one-hot encoding of the associated edge's bond type. To simplify this representation, hydrogens are sometimes made implicit since their location can be inferred with basic chemical rules. Considering the caffeine molecule, we have seen earlier, an example of a graph representation with implicit hydrogens is shown in Figure 4:
We've seen how graph data can represented. The next logical step is to discuss what tools we have that can effectively utilize those representations.
Understanding Graph Convolutions
In this section, we will introduce graph convolutions, which are the key component for building GNNs. We'll see why we want to use convolutions on graphs and discuss what attributes we want those convolutions to have.
The Motivation Behind Using Graph Convolutions
To help explain graph convolutions, let's briefly recap how convolutions are utilized in convolutional neural networks (CNNs). In the context of images, we can think of a convolution as the process of sliding a convolutional filter over an image, where, at each step, a weighted sum is computed between the filter and the receptive field (the part of the image it is currently on top of). The filter can be viewed as a detector for a specific feature. This approach to feature detection is well-suited for images for several reasons, for instance, the following priors we can place on image data:
- Shift-invariance: We can still recognize a feature in an image regardless of where it is located (for example, after translation). A cat can be recognized as a cat whether it is in the top left, bottom right, or another part of an image.
- Locality: Nearby pixels are closely related.
- Hierarchy: Larger parts of an image can often be broken down into combinations of associated smaller parts. A cat has a head and legs; the head has eyes and a nose; the eyes have pupils and irises.
Another reason convolutions are well-suited for processing images is that the number of trainable parameters does not depend on the dimensionality of the input. You could train a series of 3×3 convolutional filters on, for example, a 256×256 or a 9×9 image. However, if the same image is presented in different resolutions, the receptive fields and, therefore, the extracted features will differ. And for higher-resolution images, we may want to choose larger kernels or add additional layers to extract useful features effectively.
Like images, graphs also have natural priors that justify a convolutional approach. Both kinds of data, images and graphs, share the locality prior. However, how we define locality differs. In images, the prior is on locality in 2D space, while with graphs, it is structural locality. Intuitively, this means that a node that is one edge away is more likely to be related than a node five edges away. For example, in a citation graph, a directly cited publication, which would be one edge away, is more likely to have similar subject matter than a publication with multiple degrees of separation.
A strict prior for graph data is permutation invariance, which means that the ordering of the nodes does not affect the output. This is illustrated in Figure 5, where changing the ordering of a graph's nodes does not change the graph's structure:
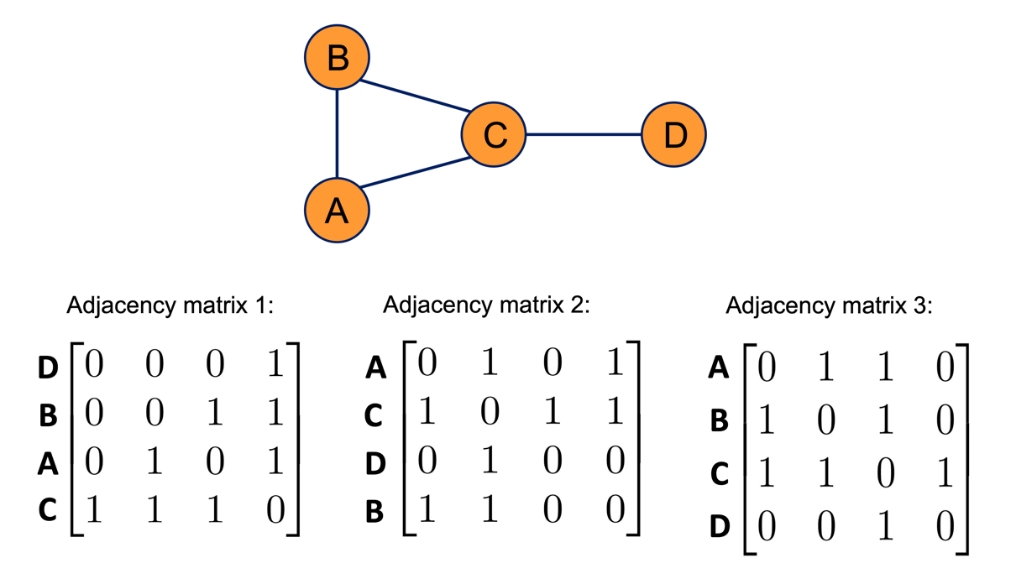
Since the same graph can be represented by multiple adjacency matrices, as illustrated in Figure 5, consequently, any graph convolution needs to be permutation invariant.
A convolutional approach is also desirable for graphs because it can function with a fixed parameter set for graphs of different sizes. This property is arguably even more important for graphs than images. For instance, there are many image datasets with a fixed resolution where a fully connected approach (for example, using a multilayer perceptron) could be possible. In contrast, most graph datasets contain graphs of varying sizes.
While image convolutional operators are standardized, there are many different kinds of graph convolutions, and the development of new graph convolutions is a very active area of research.
Opinions expressed by DZone contributors are their own.
Comments