Anypoint Monitoring in Mule
Learn about Anypoint monitoring in Mule and look at dashboards, event-driven alerts, and the logging system.
Join the DZone community and get the full member experience.
Join For FreeAnypoint Monitoring in Anypoint platform provides visibility into integrations across your app network. These monitoring tools provide feedback from Mule flows and components in your app network.
Operations and development teams use the monitoring tools to diagnose issues and prescribe solutions to behavior that negatively impacts digital performance. The monitoring tools are designed to reduce the time to identify and resolve these issues through aggregated metrics, data visualization tools, alerts for issues, and a log aggregation system. Specifically, Anypoint Monitoring provides ways to:
- Aggregate and map metrics across dependent systems in real-time.
- Configure dashboards and alerts to reduce the mean time to identification of issues (MTTI).
- Store and search log data at scale.
Dashboards
Use built-in dashboards or customize your own to provide instant visibility into your applications' performance and detailed analysis of your network.
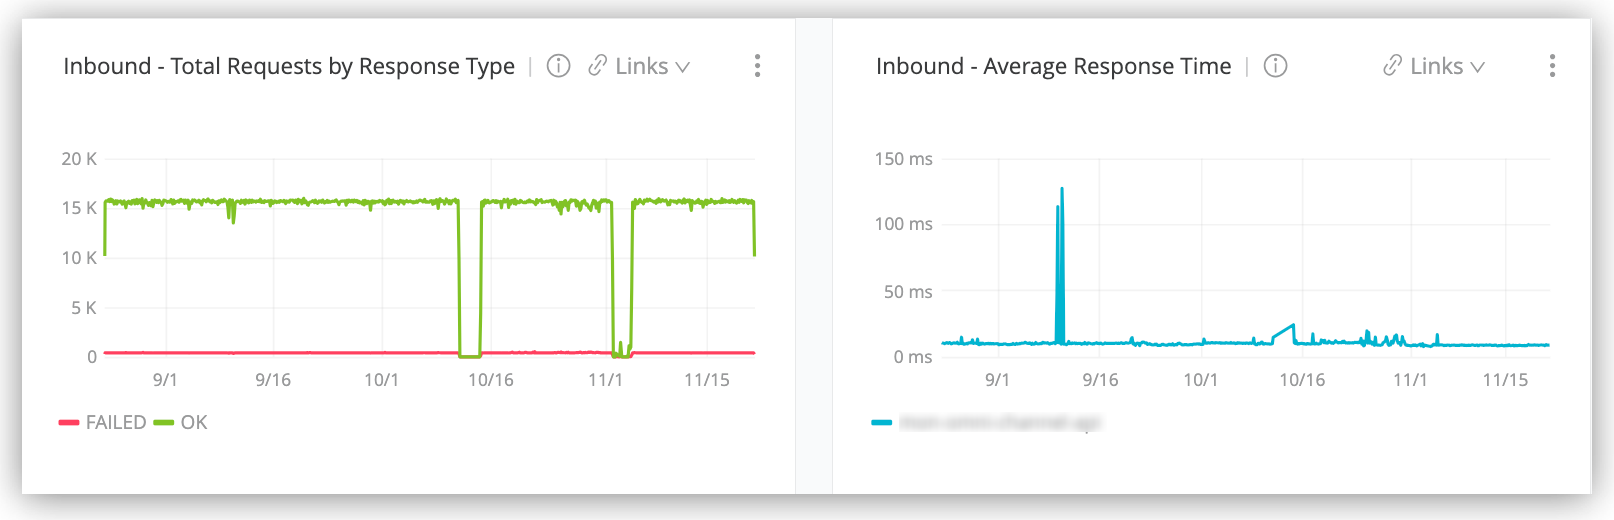
Built-in and custom dashboards expose the metrics on your app network. They provide visual representations of your resources so you can detect anomalies, troubleshoot issues, and see trends that are not obvious in raw form.
A custom dashboard provides a single screen that can bring together specific metrics and data points that are important to your organization. Custom dashboards can display graphs and other charts such as single statistics.
You can track numerous data points/metrics from a custom dashboard that looks across multiple services in the app and in your dashboards across all systems.
Event-Driven Alerts
Track trends and add your own alerts to identify abnormal behavior and problems in your application network.
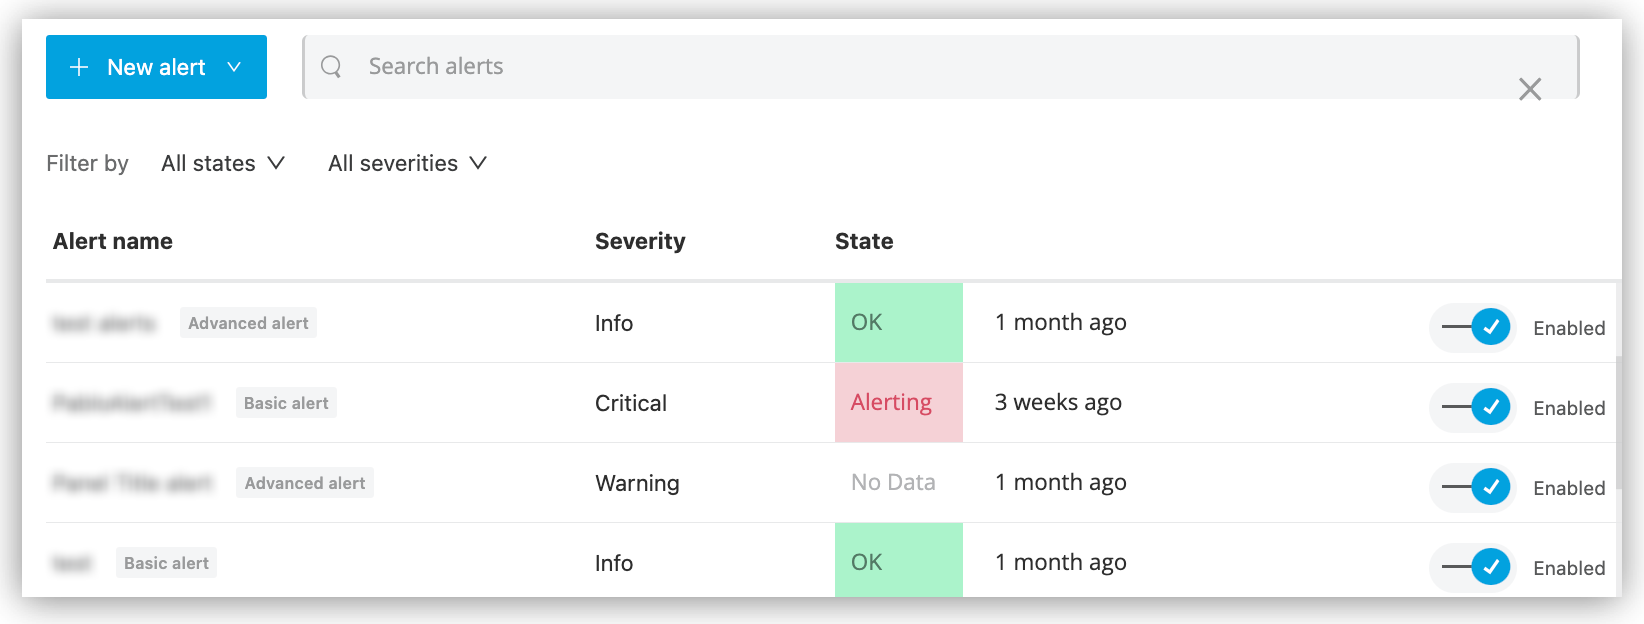
You can trigger alerts based on rules (or thresholds) and policies for your resources. When these thresholds are crossed for a certain period of time, you can receive notification to take action. The method of notification depends on the severity of the alert that you define.
Logging System
Search across log files, including archived logs to find information and events based on a specific query.
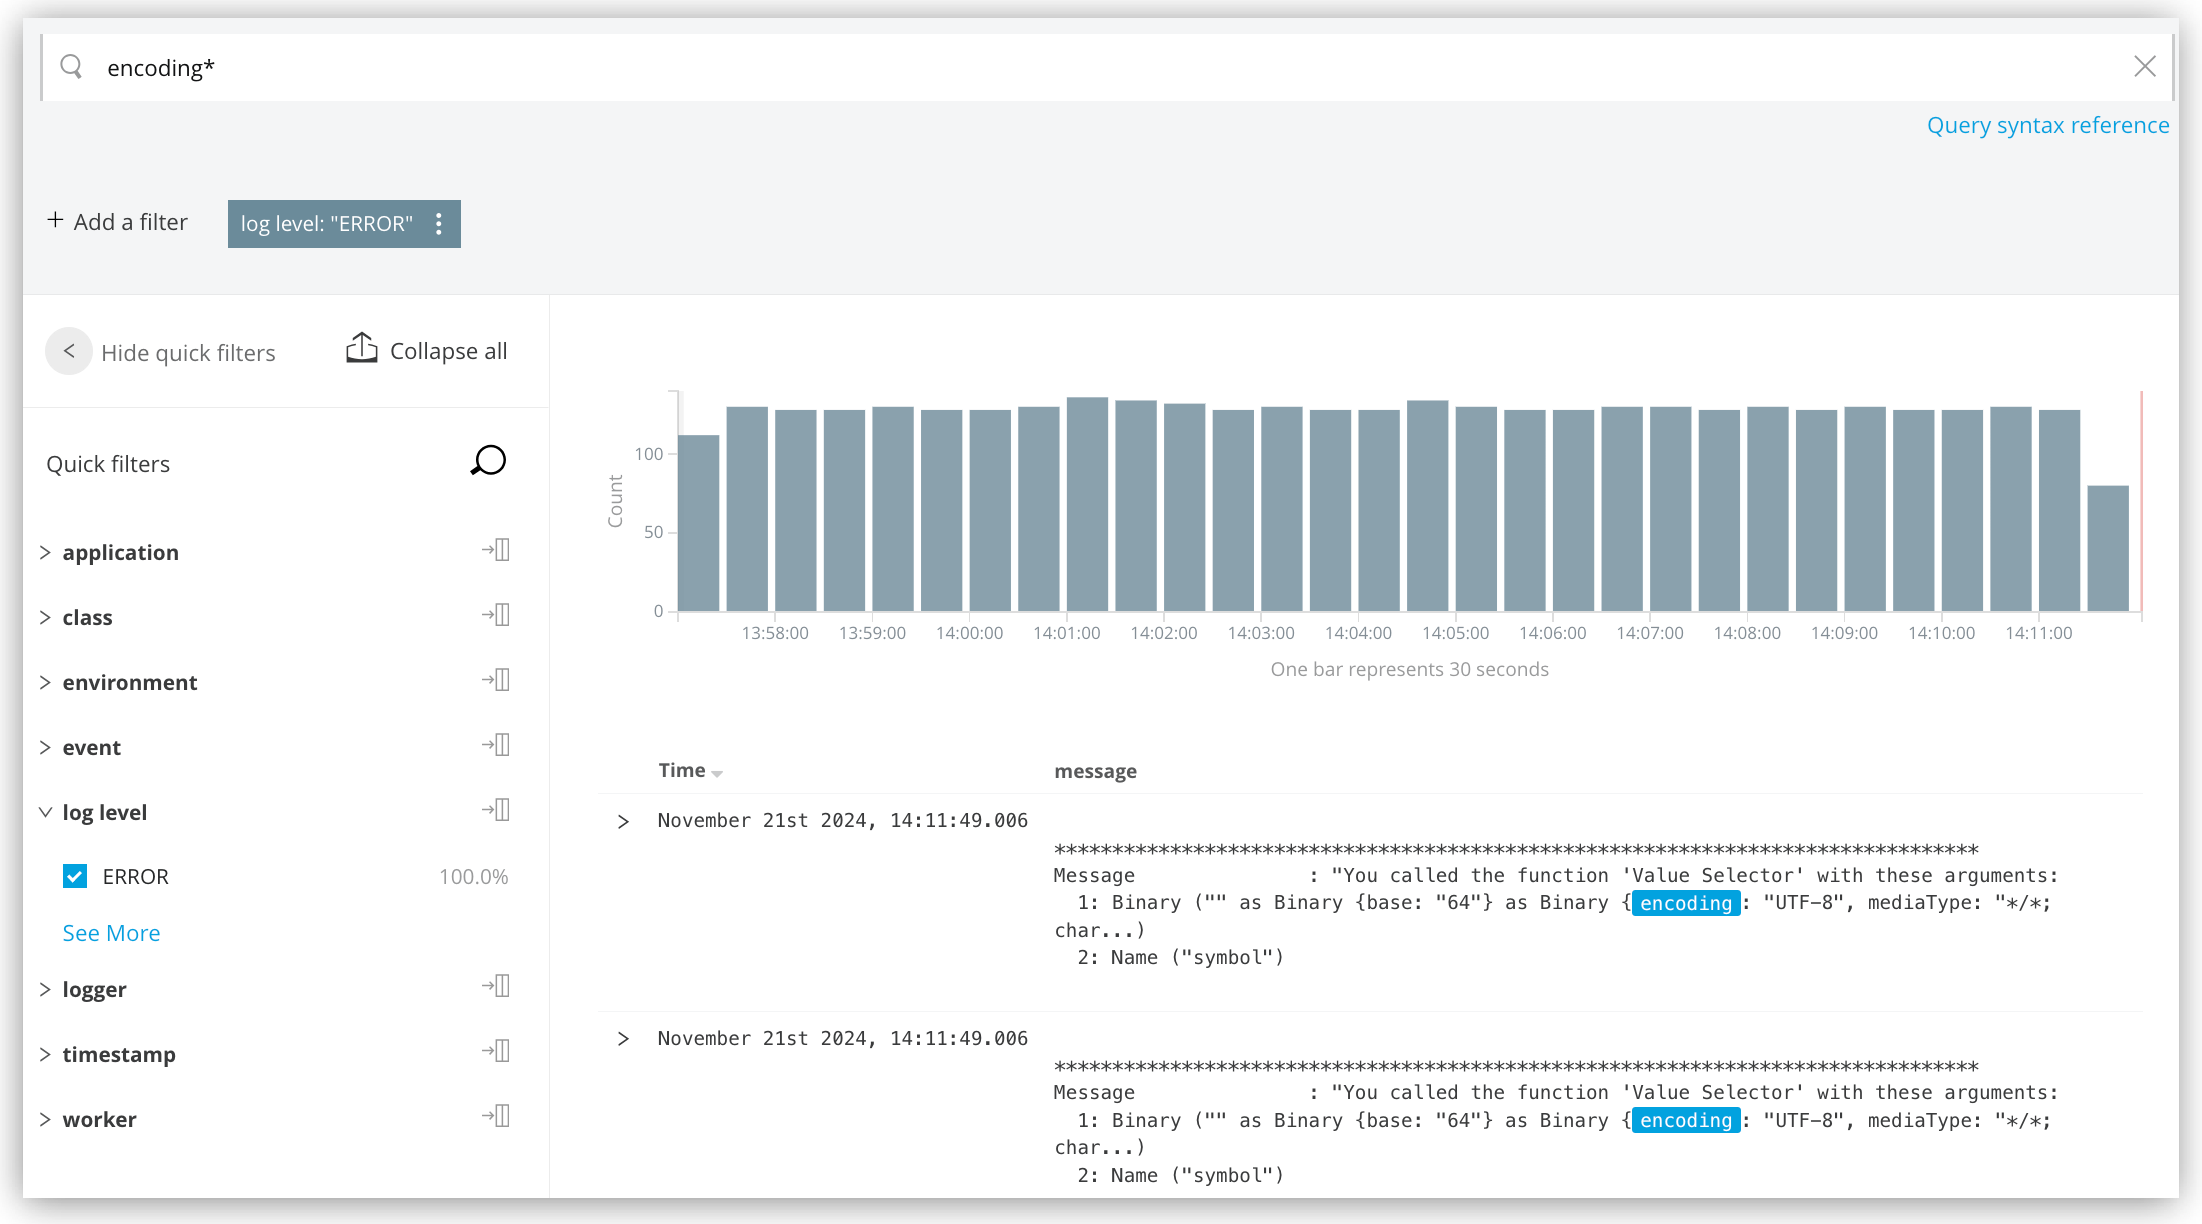
Anypoint Monitoring facilitates distributed log searches of raw log and event data from across the app network so that you can pinpoint the root cause of a problem.
The log aggregator system holds raw operational data and records events that occur in the operating system or the Mule app. Log aggregation compiles, organizes, and indexes log files to facilitate management, searching, and analysis. Aggregated logs compliment the monitoring system by helping you identify causes of operational issues and investigate failures.
Data Storage and Retention
Limits on data storage and retention are determined by your subscription level (Base or Titanium). All customers receive Anypoint Monitoring at the Base subscription level.
The Titanium subscription:
- Significantly increases the storage per vCore over the Base subscription.
- Provides a way for you to specify your data retention policy.
- Lets you store log and metric data in a selected geographic region, which can help you to meet data security and compliance requirements, run queries over geo-distributed runtimes without consequence, and limit the distance that your data travels when you run queries. These regions are available:
- US East (Ohio)
- US East (N. Virginia)
- US West (N. California)
- US West (Oregon)
- Asia Pacific (Seoul)
- Asia Pacific (Osaka-Local)
- Asia Pacific (Mumbai)
- Asia Pacific (Singapore)
- Asia Pacific (Sydney)
- Canada (Central)
- EU (Frankfurt)
- EU (Ireland)
- EU (London)
- EU (Paris)
You can monitor APIs in the Functional Monitoring section of Anypoint Monitoring, which you can access from the home page of Anypoint Platform.
To monitor an API means to monitor the performance of its response to requests that are sent to the resources at its endpoints. The Functional Monitoring section contains tools for creating a simple monitor (essentially a test suite that contains a test of one endpoint, running at intervals), for uploading a monitor (a test suite written in the Behavior Driven Development (BDD) test-writing language), and setting it to run at intervals.
Published at DZone with permission of Omer Farooq Ahmed Syed. See the original article here.
Opinions expressed by DZone contributors are their own.
Comments