Apache Doris for Log and Time Series Data Analysis
NetEase has replaced Elasticsearch and InfluxDB with Apache Doris, achieving 11X query performance and saving 70% of resources.
Join the DZone community and get the full member experience.
Join For FreeFor most people looking for a log management and analytics solution, Elasticsearch is the go-to choice. The same applies to InfluxDB for time series data analysis. These were exactly the choices of NetEase, one of the world's highest-yielding game companies but more than that. As NetEase expands its business horizons, the logs and time series data it receives explode, and problems like surging storage costs and declining stability come. As NetEase's pick among all big data components for platform upgrades, Apache Doris fits into both scenarios and brings much faster query performance.
We list the gains of NetEase after adopting Apache Doris in their monitoring platform and time series data platform and share their best practice with users who have similar needs.
Monitoring Platform: Elasticsearch -> Apache Doris
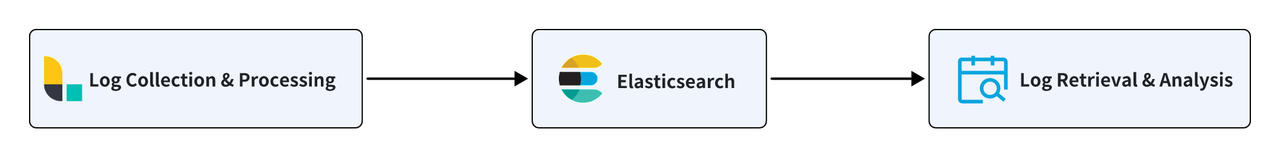
NetEase provides a collaborative workspace platform that combines email, calendar, cloud-based documents, instant messaging, and customer management, etc. To oversee its performance and availability, NetEase builds the Eagle monitoring platform, which collects logs for analysis. Eagle was supported by Elasticsearch and Logstash. The data pipeline was simple: Logstash gathers log data, cleans and transforms it, and then outputs it to Elasticsearch, which handles real-time log retrieval and analysis requests from users.
Due to NetEase's increasingly sizable log dataset, Elastisearch's index design, and limited hardware resources, the monitoring platform exhibits high latency in daily queries. Additionally, Elasticsearch maintains high data redundancy for forward indexes, inverted indexes, and columnar storage. This adds to cost pressure.
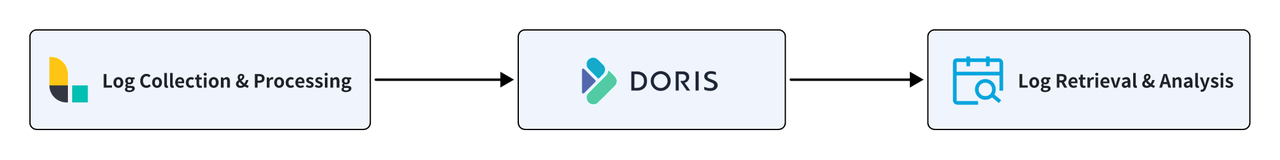
After migration to Apache Doris, NetEase achieves a 70% reduction in storage costs and an 11-fold increase in query speed.
- 70% reduction in storage costs: This means a dataset that takes up 100TB in Elasticsearch only requires 30TB in Apache Doris. Moreover, thanks to the much-reduced storage space usage, they can replace their HDDs with more expensive SSDs for hot data storage to achieve higher query performance while staying within the same budget.
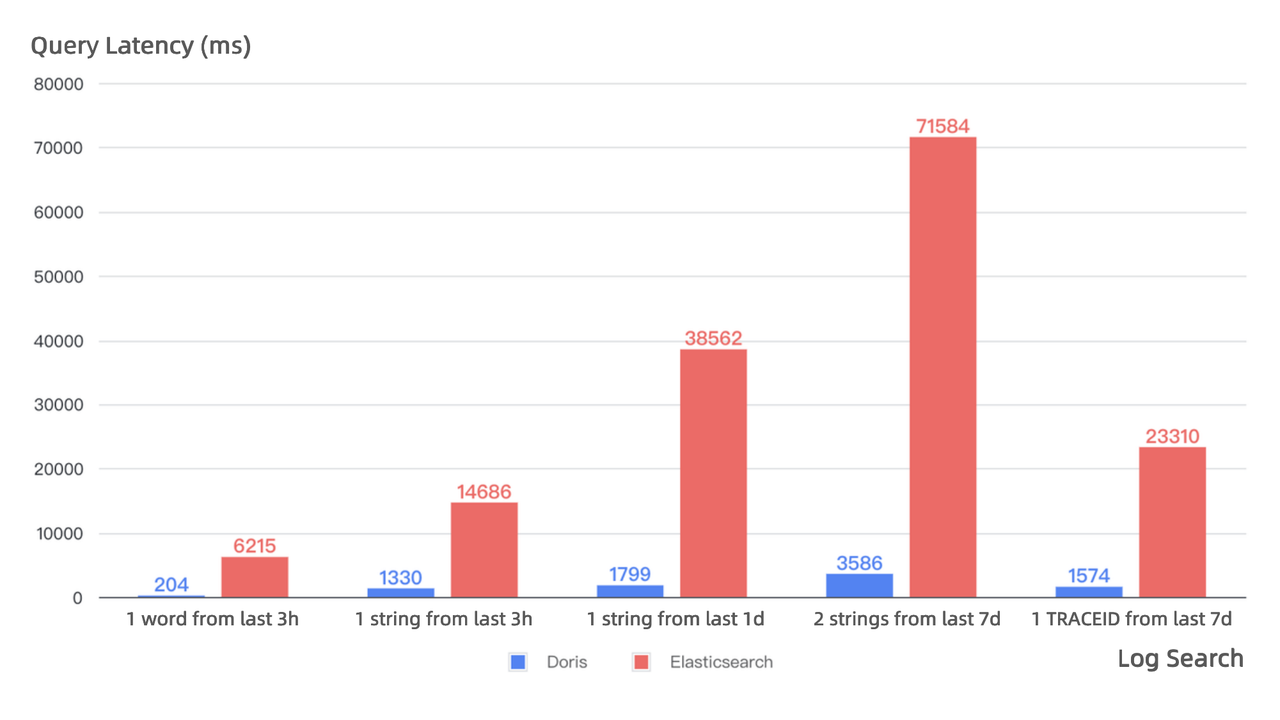
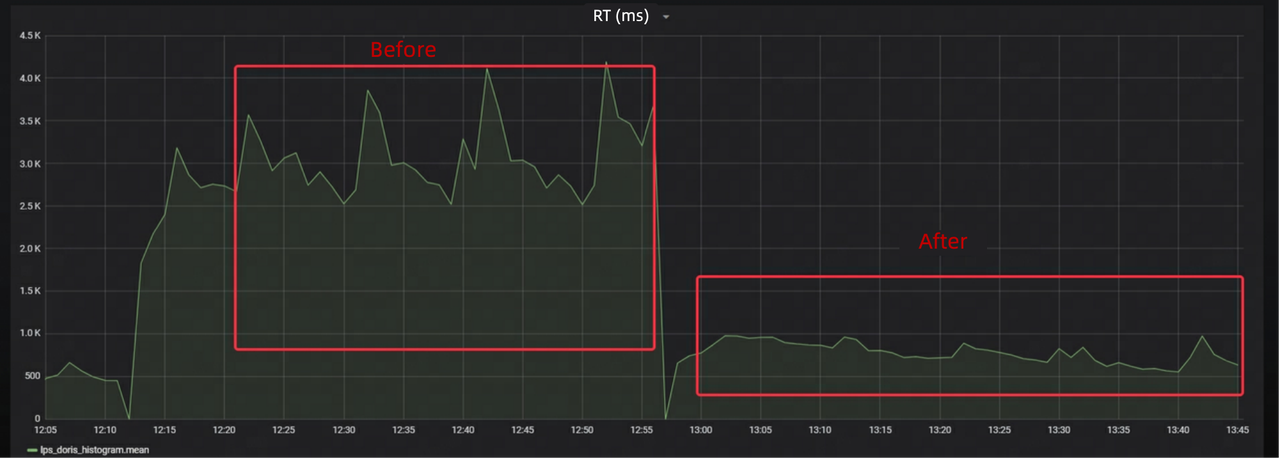
- 11-fold increase in query speed: Apache Doris can deliver faster queries while consuming less CPU resources than Elasticsearch. As shown below, Doris has reliably low latency in queries of various sizes, while Elasticsearch demonstrates longer latency and greater fluctuations, and the smallest speed difference is 11-fold.
Time Series Data Platform: InfluxDB -> Apache Doris
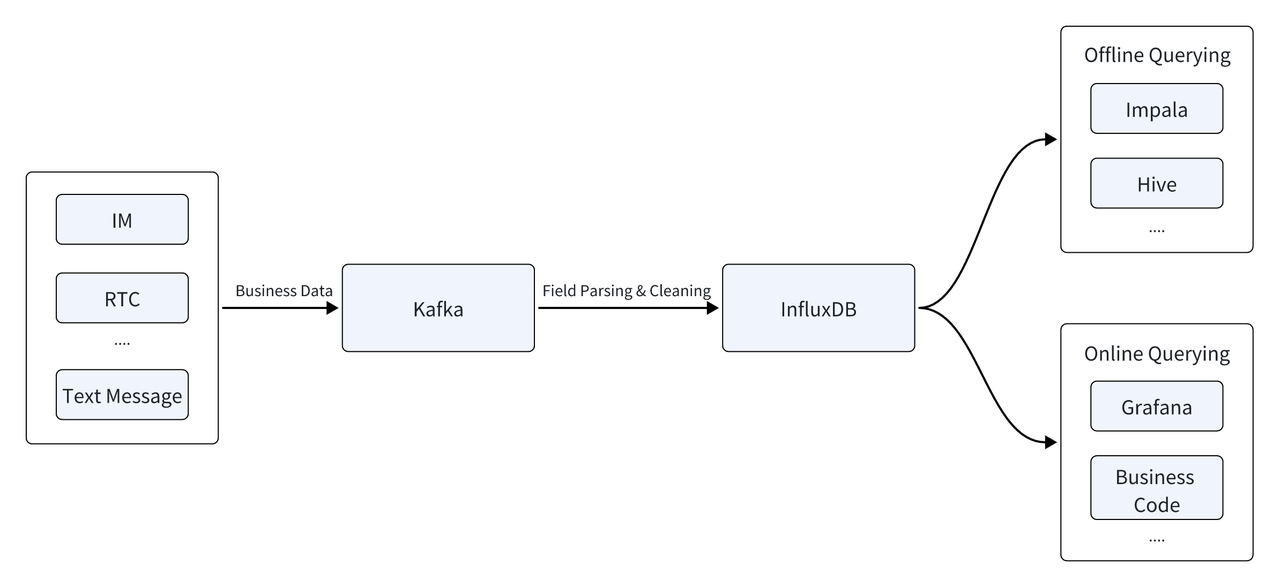
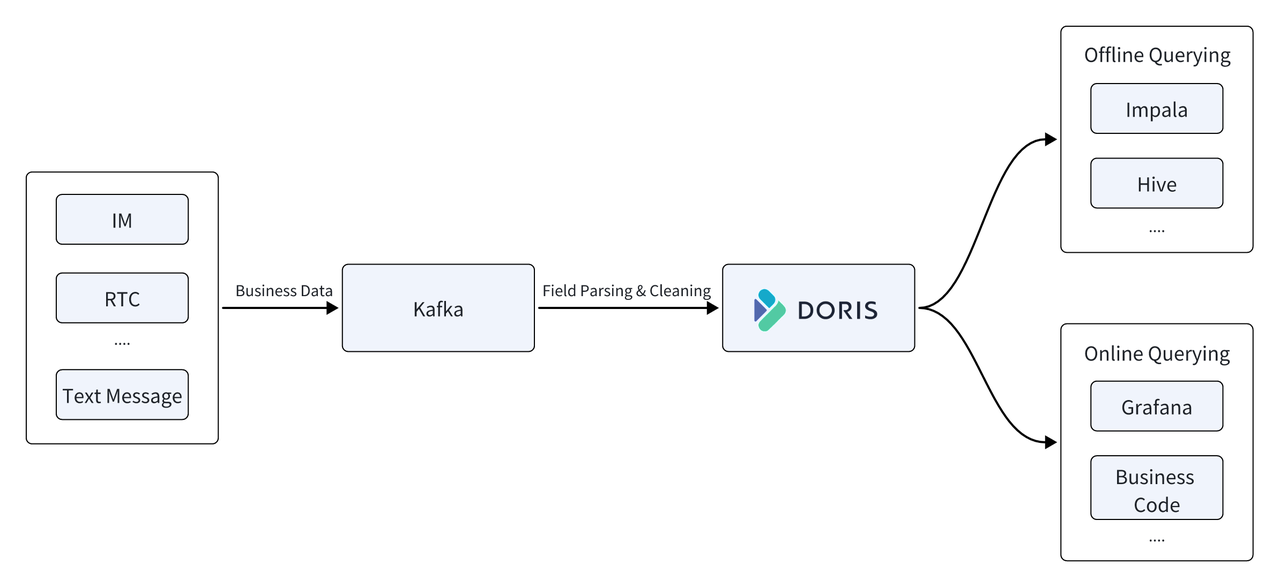
NetEase is also an instant messaging (IM) PaaS provider. To support this, it builds a data platform to analyze time series data from their IM services. The platform was built on InfluxDB, a time series database. Data flowed into a Kafka message queue. After the fields were parsed and cleaned, they arrived in InfluxDB, ready to be queried. InfluxDB responded to both online and offline queries. The former was to generate metric monitoring reports and bills in real-time, and the latter was to batch-analyze data from a day ago.
This platform was also challenged by the increasing data size and diversifying data sources.
- OOM: Offline data analysis across multiple data sources was putting InfluxDB under huge pressure and causing OOM errors.
- High storage costs: Cold data took up a large portion but it was stored the same way as hot data. That added up to huge expenditures.
Replacing InfluxDB with Apache Doris has brought higher cost efficiency to the data platform:
- Higher throughput: Apache Doris maintains a writing throughput of 500MB/s and achieves a peak writing throughput of 1GB/s. With InfluxDB, they used to require 22 servers for a CPU utilization rate of 50%. Now, with Doris, it only takes them 11 servers at the same CPU utilization rate. That means Doris helps cut down resource consumption by half.
- 67% less storage usage: The same dataset used 150TB of storage space with InfluxDB but only took up 50TB with Doris. Thus, Doris helps reduce storage costs by 67%.
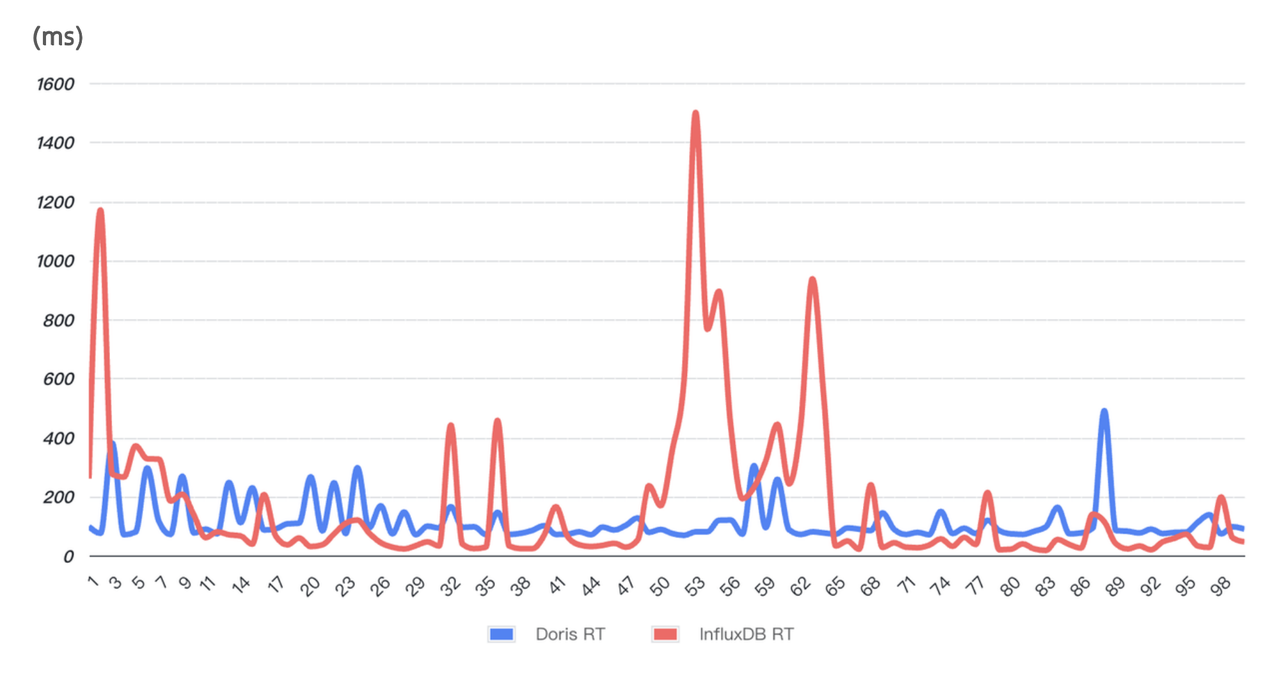
- Faster and more stable query performance: The performance test was to select a random online query SQL and run it 99 consecutive times. As is shown below, Doris delivers generally faster response time and maintains stability throughout the 99 queries.
Best Practice
Adopting a new product and putting it into a production environment is, after all, a big project. The NetEase engineers came across a few hiccups during the journey, and they are kind enough to share about how they solved these problems and saved other users some detours.
Table Creation
Table schema design has a significant impact on database performance, and this holds for log and time series data processing as well. Apache Doris provides optimization options for these scenarios. These are some recommendations provided by NetEase.
- Retrieval of the latest N logs: Using a
DATETIMEtype time field as the primary key can largely speed queries up. - Partitioning strategy: Use
PARTITION BY RANGEbased on a time field and enable dynamic partition. This allows for auto-management of data partitions. - Bucketing strategy: Adopt random bucketing and set the number of buckets to roughly three times the total number of disks in the cluster. (Apache Doris also provides an auto bucket feature to avoid performance loss caused by improper data sharding.)
- Indexing: Create indexes for frequently searched fields to improve query efficiency. Pay attention to the parser for the fields that require full-text searching, because it determines query accuracy.
- Compaction: Optimize the compaction strategies based on your own business needs.
- Data compression: Enable
ZSTDfor better a higher compression ratio.
CREATE TABLE log
(
    ts DATETIME,
    host VARCHAR(20),
    msg TEXT,
    status INT,
    size INT,
    INDEX idx_size (size) USING INVERTED,
    INDEX idx_status (status) USING INVERTED,
    INDEX idx_host (host) USING INVERTED,
    INDEX idx_msg (msg) USING INVERTED PROPERTIES("parser" = "unicode")
)
ENGINE = OLAP
DUPLICATE KEY(ts)
PARTITION BY RANGE(ts) ()
DISTRIBUTED BY RANDOM BUCKETS 250
PROPERTIES (
    "compression"="zstd",
    "compaction_policy" = "time_series",
    "dynamic_partition.enable" = "true",
    "dynamic_partition.create_history_partition" = "true",
    "dynamic_partition.time_unit" = "DAY",
    "dynamic_partition.start" = "-7",
    "dynamic_partition.end" = "3",
    "dynamic_partition.prefix" = "p",
    "dynamic_partition.buckets" = "250"
);
Cluster Configuration
Frontend (FE) Configuration# For higher data ingestion performance:
enable_single_replica_load = true
# For more balanced tablet distribution:
enable_round_robin_create_tablet = true
tablet_rebalancer_type = partition
# Memory optimization for frequent imports:
max_running_txn_num_per_db = 10000
streaming_label_keep_max_second = 300
label_clean_interval_second = 300Backend (BE) Configuration
write_buffer_size=1073741824
max_tablet_version_num = 20000
max_cumu_compaction_threads = 10 (Half of the total number of CPUs)
enable_write_index_searcher_cache = false
disable_storage_page_cache = true
enable_single_replica_load = true
streaming_load_json_max_mb=250
Stream Load Optimization
During peak times, the data platform is undertaking up to 1 million TPS and a writing throughput of 1GB/s. This is demanding for the system. Meanwhile, at peak time, a large number of concurrent write operations are loading data into lots of tables, but each individual write operation only involves a small amount of data. Thus, it takes a long time to accumulate a batch, which is contradictory to the data freshness requirement from the query side.
As a result, the data platform was bottlenecked by data backlogs in Apache Kafka. NetEase adopts the Stream Load method to ingest data from Kafka to Doris. So the key was to accelerate Stream Load. After talking to the Apache Doris developers, NetEase adopted two optimizations for their log and time series data analysis:
- Single replica data loading: Load one data replica and pull data from it to generate more replicas. This avoids the overhead of ranking and creating indexes for multiple replicas.
- Single tablet data loading (
load_to_single_tablet=true): Compared to writing data to multiple tablets, this reduces the I/O overhead and the number the small files generated during data loading.
The above measures are effective in improving data loading performance:
- 2X data consumption speed from Kafka
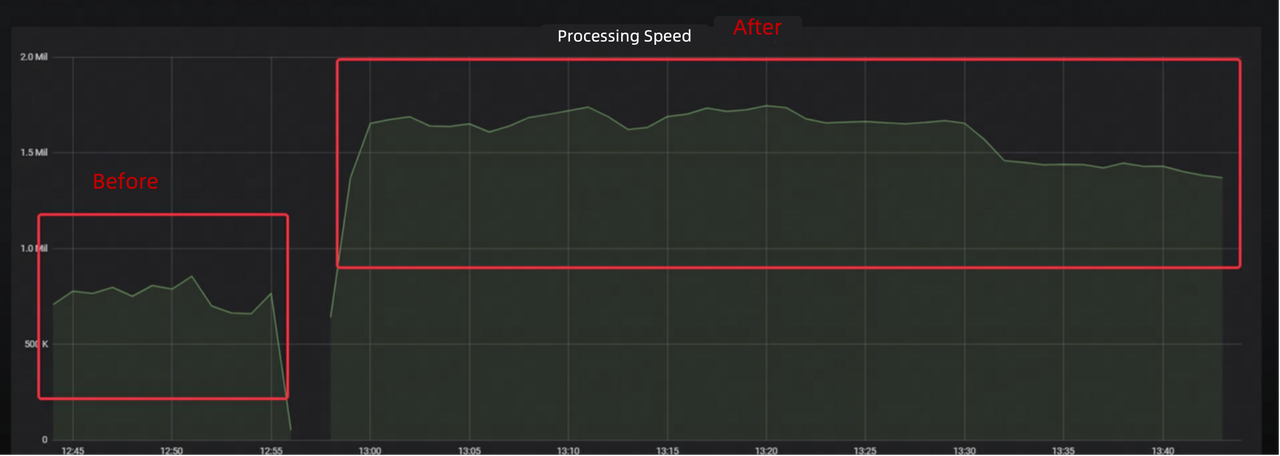
- 75% lower data latency
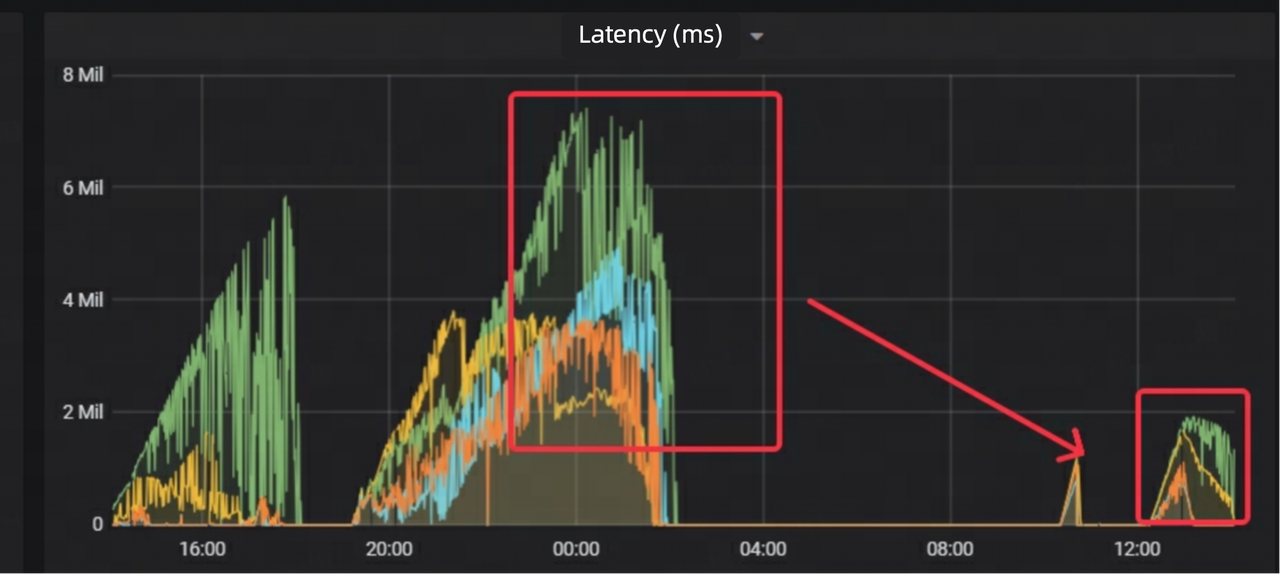
- 70% faster response of Stream Load
Before putting the upgraded data platform in their production environment, NetEase has conducted extensive stress testing and grayscale testing. This is their experience in tackling errors along the way.
1. Stream Load Timeout
The early stage of stress testing often reported frequent timeout errors during data import. Additionally, despite the processes and cluster status being normal, the monitoring system couldn't collect the correct BE metrics. The engineers obtained the Doris BE stack using Pstack and analyzed it with PT-PMT. They discovered that the root cause was the lack of HTTP chunked encoding or content-length settings when initiating requests. This led Doris to mistakenly consider the data transfer as incomplete, causing it to remain in a waiting state. The solution was to simply add a chunked encoding setting on the client side.
2. Data Size in a Single Stream Load Exceeding Threshold
The default limit is 100 MB. The solution was to increase streaming_load_json_max_mb to 250 MB.
3. Error: alive replica num 0 < quorum replica num 1
By the show backends command, it was discovered that one BE node was in OFFLINE state. A lookup in the be_custom configuration file revealed a broken_storage_path. Further inspection of the BE logs located an error message "too many open files," meaning the number of file handles opened by the BE process had exceeded the system's limit, and this caused I/O operations to fail. When Doris detected such an abnormality, it marked the disk as unavailable. Because the table was configured with one single replica, when the disk holding the only replica was unavailable, data writing failed.
The solution was to increase the maximum open file descriptor limit for the process to 1 million, delete the be_custom.conf file, and restart the BE node.
4. FE Memory Jitter
During grayscale testing, the FE could not be connected. The monitoring data showed that the JVM's 32 GB was exhausted, and the bdb directory under the FE's meta-directory had ballooned to 50 GB. Memory jitter occurred every hour, with peak memory usage reaching 80%
The root cause was improper parameter configuration. During high-concurrency Stream Load operations, the FE records the related Load information. Each import adds about 200 KB of information to the memory. The cleanup time for such information is controlled by the streaming_label_keep_max_second parameter, which by default is 12 hours. Reducing this to 5 minutes can prevent the FE memory from being exhausted. However, they didn't modify the label_clean_interval_second parameter, which controls the interval of the label cleanup thread. The default value of this parameter is 1 hour, which explains the hourly memory jitter.
The solution was to dial down label_clean_interval_second to 5 minutes.
Query
The engineers found results that did not match the filtering conditions in a query on the Eagle monitoring platform.
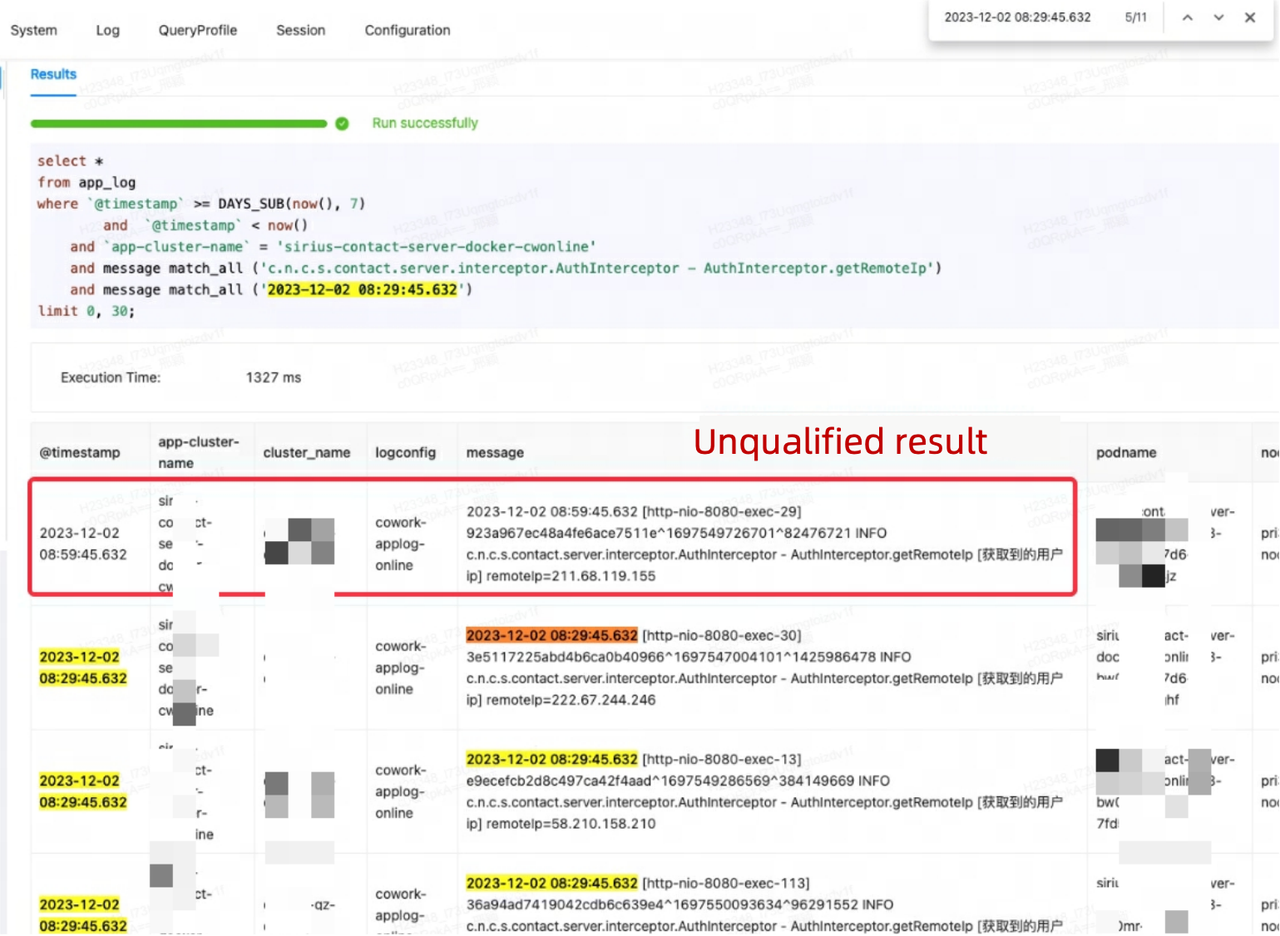
This was due to the engineers' misconception of match_all in Apache Doris. match_all identifies data records that include all the specified tokens while tokenization is based on space and punctuation marks. In the unqualified result, although the timestamp did not match, the message included "29", which compensated for the unmatched part in the timestamp. That's why this data record was included as a query result.
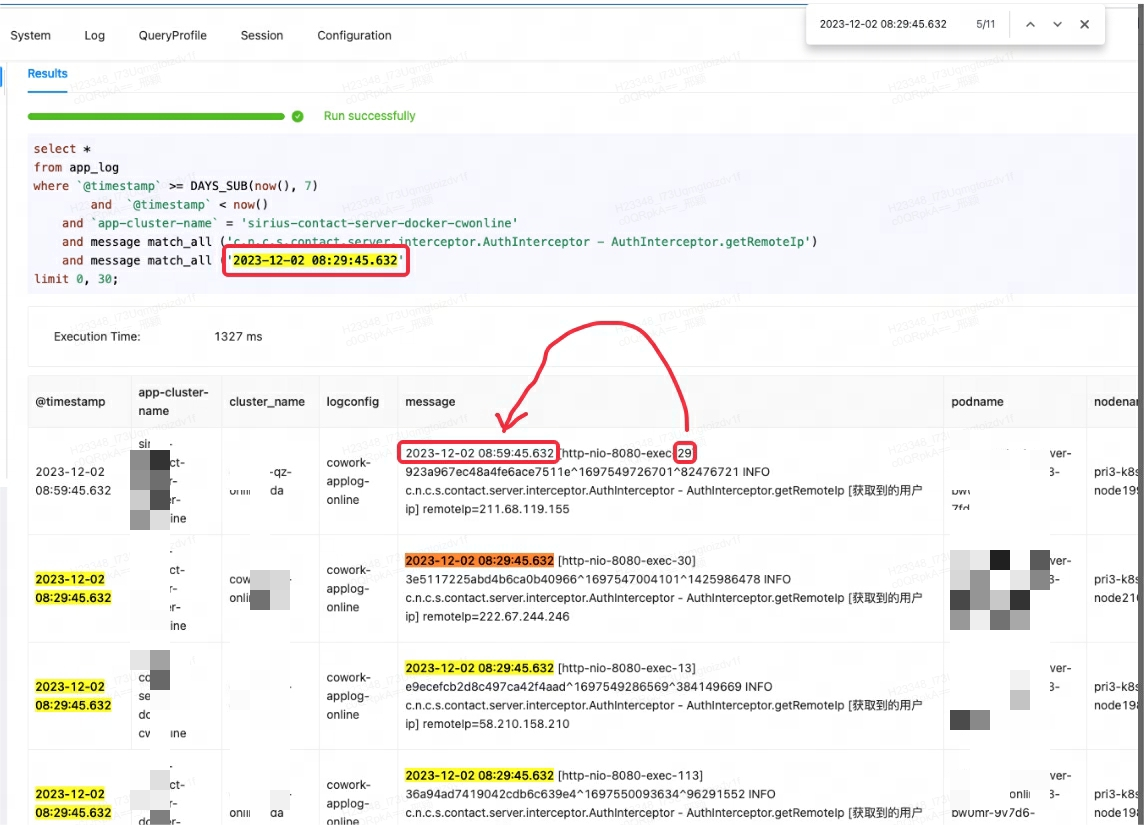
For Doris to produce what the engineers wanted in this query, MATCH_PHRASE should be used instead, because it also identifies the sequence of texts.
SELECT * FROM table_name WHERE logmsg MATCH_PHRASE 'keyword1 keyword2';MATCH_PHRASE, you should enable support_phrase during index creation. Otherwise, the system will perform a full table scan and a hard match, resulting in poor query efficiency.
INDEX idx_name4(column_name4) USING INVERTED PROPERTIES("parser" = "english", "support_phrase" = "true")If you want to enable support_phrase for existing tables that have already been populated with data, you can execute DROP INDEX and then ADD INDEX to replace the old index with a new one. This process is incremental and does not require rewriting the entire table.
This is another advantage of Doris compared to Elasticsearch: It supports more flexible index management and allows easy addition and removal of indexes.
Conclusion
Apache Doris supports the log and time series data analytic workloads of NetEase with higher query performance and less storage consumption. Beyond these, Apache Doris has other capabilities such as data lake analysis since it is designed as an all-in-one big data analytic platform. If you want a quick evaluation of whether Doris is right for your use case, come talk to the Doris makers on Slack.
Published at DZone with permission of Shirley H.. See the original article here.
Opinions expressed by DZone contributors are their own.
Comments