Leveraging Apache Flink Dashboard for Real-Time Data Processing in AWS Apache Flink Managed Service
Find out how to utilize the Apache Flink Dashboard for monitoring, optimizing, and managing real-time data processing applications within AWS-managed services.
Join the DZone community and get the full member experience.
Join For FreeThe Apache Flink Managed Service in AWS, offered through Amazon Kinesis data analytics for Apache Flink, allows developers to run Flink-based stream processing applications without the complexities of managing the underlying infrastructure. This fully managed service simplifies the deployment, scaling, and operation of real-time data processing pipelines, enabling users to concentrate on building applications rather than handling cluster setup and maintenance. With seamless integration into AWS services such as Kinesis and S3, it provides automatic scaling, monitoring, and fault tolerance, making it ideal for real-time analytics, event-driven applications, and large-scale data processing in the cloud.
This guide talks about how to use the Apache Flink dashboard for monitoring and managing real-time data processing applications within AWS-managed services, ensuring efficient and reliable stream processing.
The Apache Flink Dashboard
The Apache Flink dashboard offers an intuitive interface for managing real-time data services on AWS, enabling developers to monitor, debug, and optimize Flink applications effectively. AWS-managed services like Amazon Kinesis data analytics leverage the dashboard’s insights into job statuses, task performance, and resource usage, assisting developers in monitoring live data streams and assessing job health through metrics such as throughput, latency, and error rates.
The Flink dashboard facilitates real-time debugging and troubleshooting by providing access to logs and task execution metrics. This visibility is essential for identifying performance bottlenecks and errors, ensuring high availability and low latency for AWS-managed real-time data processing services. Overall, the dashboard equips users with the necessary transparency to maintain the health and efficiency of these services.
Accessing the Apache Flink Dashboard
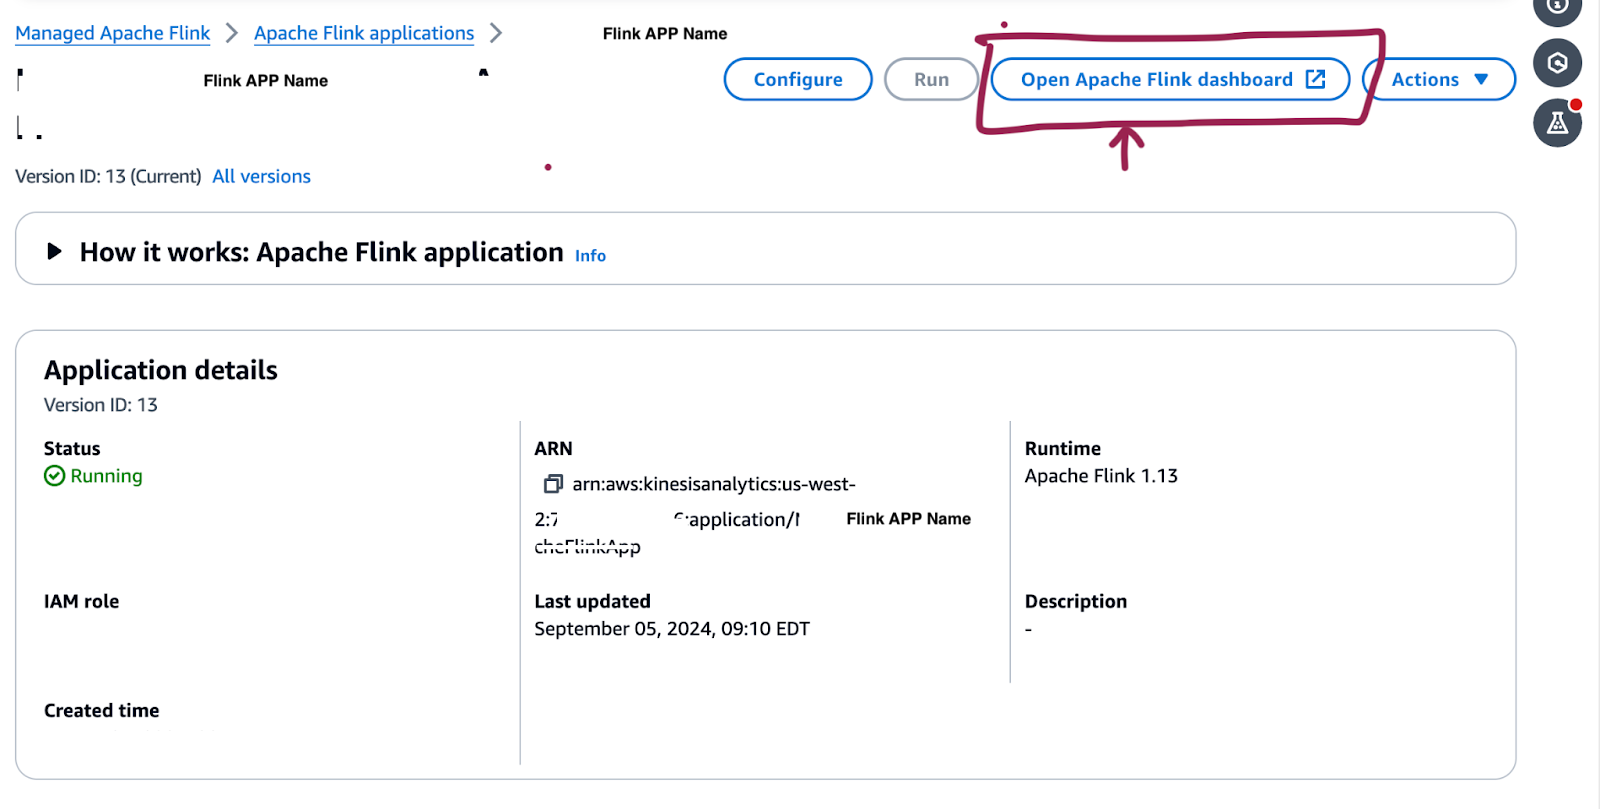
To begin analyzing Flink applications, access the Apache Flink dashboard, which provides real-time insights into job performance and health.
Code Example
Consider the following code snippet where an Apache Flink application processes streaming data from Amazon Kinesis using Flink’s data stream API:
DataStream<String> dataStream = env.addSource(new FlinkKinesisConsumer<>(
       INPUT_STREAM_NAME,
       new SimpleStringSchema(),
       setupInputStreamProperties(streamRole, streamRegion))
);

SingleOutputStreamOperator<ArrayList<TreeMap<String, TreeMap<String, Integer>>>> result = dataStream
       .map(Application::toRequestEventTuple)
       .returns(Types.TUPLE(Types.LIST(Types.STRING), Types.LIST(Types.STRING), Types.LIST(Types.INT)))
       .windowAll(TumblingProcessingTimeWindows.of(Time.minutes(5)))
       .aggregate(new EventObservationAggregator());

REGIONS.forEach(region -> {
   result.flatMap(new CountErrorsForRegion(region)).name("CountErrors(" + region + ")");
   result.flatMap(new CountFaultsForRegion(region)).name("CountFaults(" + region + ")");
});

env.execute("Kinesis Analytics Application Job");
This Apache Flink application processes real-time data from an Amazon Kinesis stream using Flink's data stream API. The execution environment is established, retrieving AWS-specific properties such as the role ARN and region to access the Kinesis stream. The data stream is consumed and deserialized as strings, which are then mapped to tuples for further processing. The application utilizes 5-minute tumbling windows to aggregate events, applying custom functions to count errors and faults for various AWS regions. The job is executed continuously, processing and analyzing real-time data from Kinesis to ensure scalable, region-specific error and fault tracking.
Summary
- Source: Reads data from a Kinesis stream, using a Flink Kinesis consumer with a specified region and role
- Transformation: The data is converted into tuples and aggregated in 5-minute windows.
- Counting: Errors and faults are counted for each AWS region.
- Execution: The job runs indefinitely, processing data in real-time as it streams from Kinesis.
Job Graph
The job graph in the Flink Dashboard visually represents the execution of an Apache Flink job, highlighting the data processing flow across different regions while tracking errors and faults.
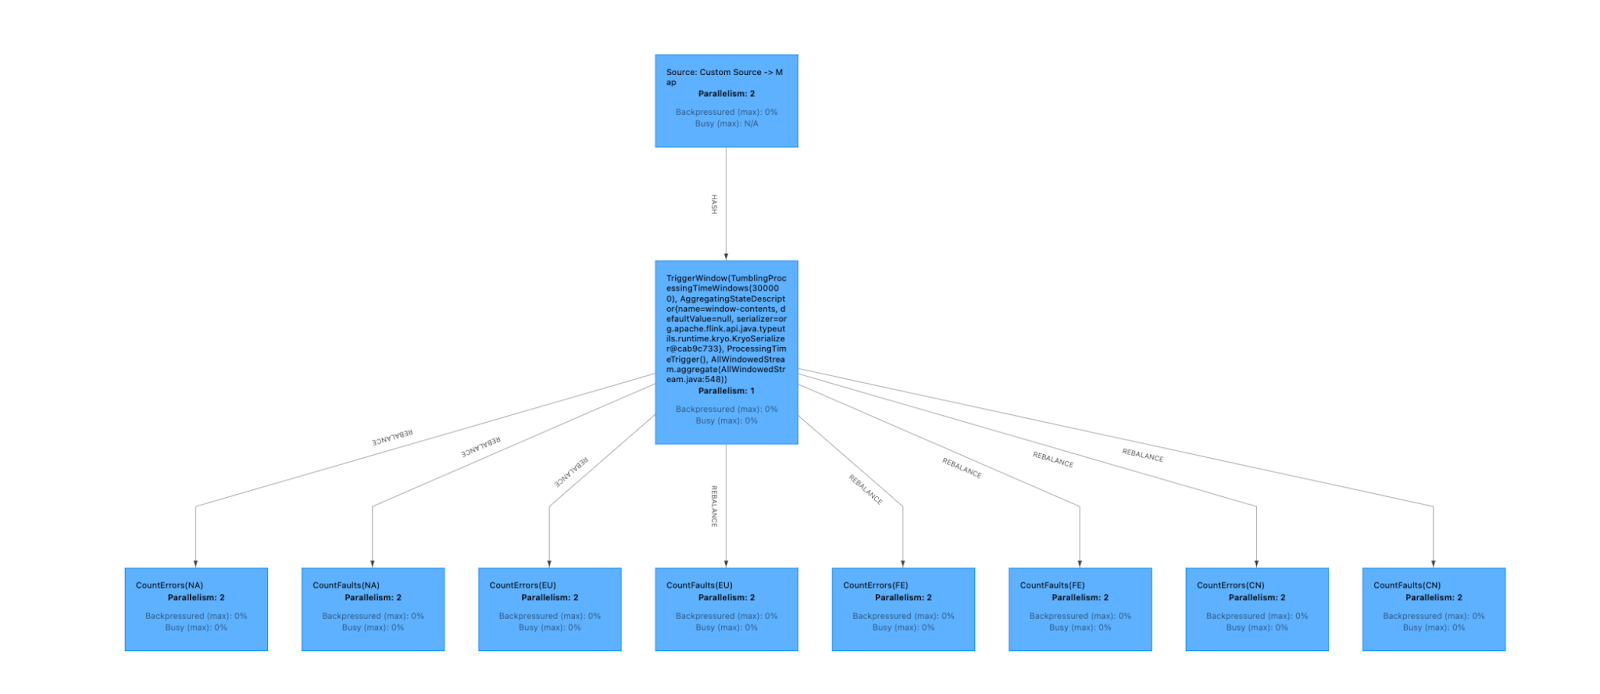
Explanation
- Source: Custom Source -> Map: The initial component is the source, where data is ingested from Amazon Kinesis. The custom source processes data in parallel with two tasks (as you see in image Parallelism: 2).
- Trigger window (
TumblingProcessingTimeWindows): The next step applies aTumblingWindowwith a 5-minute processing time; i.e., grouping incoming data into 5-minute intervals for batch-like processing of streaming data. The aggregation function combines data within each window (as represented byAllWindowedStream.aggregate()) with Parallelism: 1 indicating a single task performing this aggregation. - Regional processing (
CountErrors/CountFaults): Following window aggregation, the data is rebalanced and distributed across tasks responsible for processing different regions. Each region has two tasks responsible for counting errors and faults, each operating with Parallelism: 2, ensuring concurrent processing of each region's data.
Summary
The data flows from a custom source, is mapped and aggregated in 5-minute tumbling windows, and is processed to count errors and faults for different regions. The parallel processing of each region ensures efficient handling of real-time streaming data across regions, as depicted in the diagram.
Operator/Task Data Flow Information
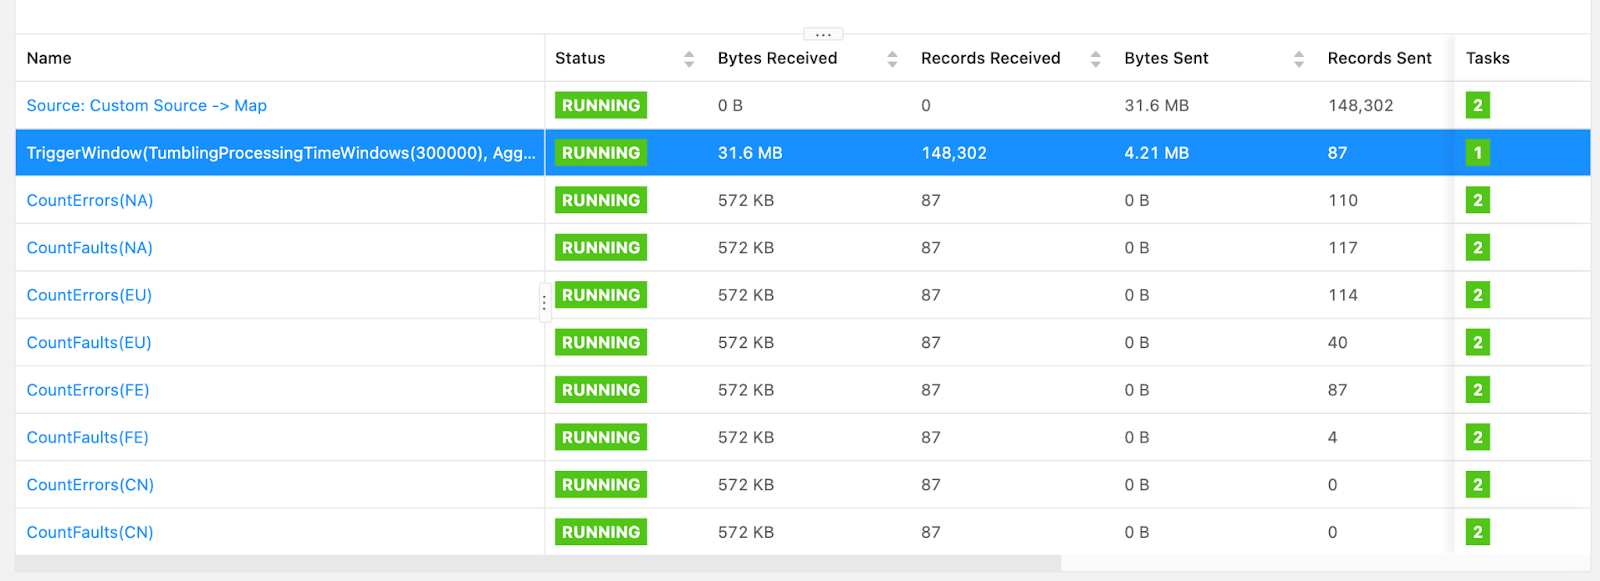
The dashboard provides a quick overview of the data flow within the Flink job, showcasing the processing status and data volume at each step. It displays information about various operators or tasks in the Flink job. Here’s a breakdown of what the table shows:
- Name: Lists operators or processing steps in the Flink job, such as "
Source: Custom Source -> Map," "TriggerWindow," and various "CountErrors" and "CountFaults" for different regions - Status: This displays the status of tasks. All listed operators are in "
RUNNING" status with green labels. - Bytes Received: Displays the amount of data received by each operator; for example, the "
TriggerWindow" operator receiving the 31.6 MB of data - Records Received: Indicates the number of records processed by each operator, again with the "
TriggerWindow" operator leading (148,302) - Bytes Sent: Shows the amount of data sent by each operator; for example: the "
Source: Custom Source -> Map" sending the most (31.6 MB) - Records Sent: Displays the number of records sent by each operator, with the "
Source: Custom Source -> Map" also sending the most (148,302) - Tasks: Indicates the number of parallel tasks for each operator; all tasks have parallelism 2 except the "
TriggerWindow" operator having 1 parallelism.
This configuration view provides insights into the Flink job manager setup, encompassing cluster behavior, Java options, and exception handling. Understanding and potentially adjusting these parameters is crucial for optimizing the Flink environment's behavior.
Conclusion
In this guide, we explored several key views of the Apache Flink Dashboard that enhance the understanding and management of data pipelines. These include the Job Graph, which visually represents data processing flow; the Operator/Task Data Flow Information Table, which provides detailed insights into the flow between tasks and operators; and the Configuration Tab, which offers control over job manager settings. The dashboard provides numerous additional features that help developers gain a deeper understanding of their Apache Flink applications, facilitating the monitoring, debugging, and optimization of real-time data processing pipelines within AWS-managed services.
Opinions expressed by DZone contributors are their own.
Comments