AppDynamics VS New Relic – Which Tool is Right For You? The Complete Guide
Join the DZone community and get the full member experience.
Join For Free
New Relic VS AppDynamics: All the performance features, integrations, installation procedures and pricing plans side by side to help you decide which tool to use
When thinking about performance, AppDynamics and New Relic are the main modern tools that come to mind. Both spawned from the same company, Wily Technology, who also dealt with performance monitoring and was acquired by CA back in 2006 - making way to new technology. New Relic is an anagram of Lew Cirne, its founder and CEO. AppDynamics was founded by Jyoti Bansal, who was a Lead Software Architect at the same Wily Technology, which was also founded by Lew. The main goal of this guide is to help you understand the similarities and differences between the two, so you can decide which one fits your company’s needs.
Table of Contents
- What is APM anyhow?
- Supported Languages and Environments
- Features - Backend Monitoring - Fronted & Mobile Monitoring
- How to Solve the Errors You Find
- Installation
- Dashboard and Usage
- Integrations and Plugins
- Pricing
1. What is APM anyhow?
It’s the only buzzword you’ll read in this article, promise. Well, maybe also DevOps, but that’s it. So application Performance Management has been around for a while, though it seems like many developers are not comfortable with it yet. APM provides us with analytics around our application’s performance - at the core this means timing how long it takes to execute different areas in the code and complete transactions - this is done either by instrumenting the code, monitoring logs, or including network / hardware metrics.On top of this basic concept, many different implementations exist - but there are a basic truths we can agree on: A modern solution should monitor production environments, so its overhead (in terms of CPU and throughput) becomes very important. Also, it should display what the web/mobile end users are experiencing, which was not part of traditional APMs.
What was once considered a luxury is becoming commonplace: Rapid new deployments in production mean more chances to introduce errors to your systems architecture, slow it down, and maybe even crash it. Let’s see what AppDynamics and New Relic have in store for us.
2. Supported Environments
AppDynamics: Java, Scala, .NET, PHP, Node.js, iOS and Android; including your favorite flavour of database and cloud platform. New Relic: Java, Scala, .NET, PHP, Node.js, Ruby and Python. Supported databases, cloud platforms and other plug-ins are available here. We’ll dig in deeper with extensions later on. On the user monitoring front, iOS, Android, and JavaScript support is included with both tools. Bottom line: Main difference here is New Relic’s Ruby and Python support, and different levels of support for various platforms.3. Features
Both New Relic and AppDynamics can be broken down into 6 different products, all reporting to a main dashboard interface. Let’s split these to backend, mobile and frontend to do a quick runthrough over the main offerings.Backend Monitoring
The bread and butter of performance management - reporting stats, graphs and insights of your applications performance under the hood. AppDynamics and NewRelic each offer 4 approaches here: Application Performance Management High level metrics with drill downs to code level data about how your application is performing. Must have metrics include transaction response time, error rate, throughput (Requests per Minute) on NewRelic and load (calls/min) on AppDynamics.

AppDynamics dashboard on the left, New Relic on the Right
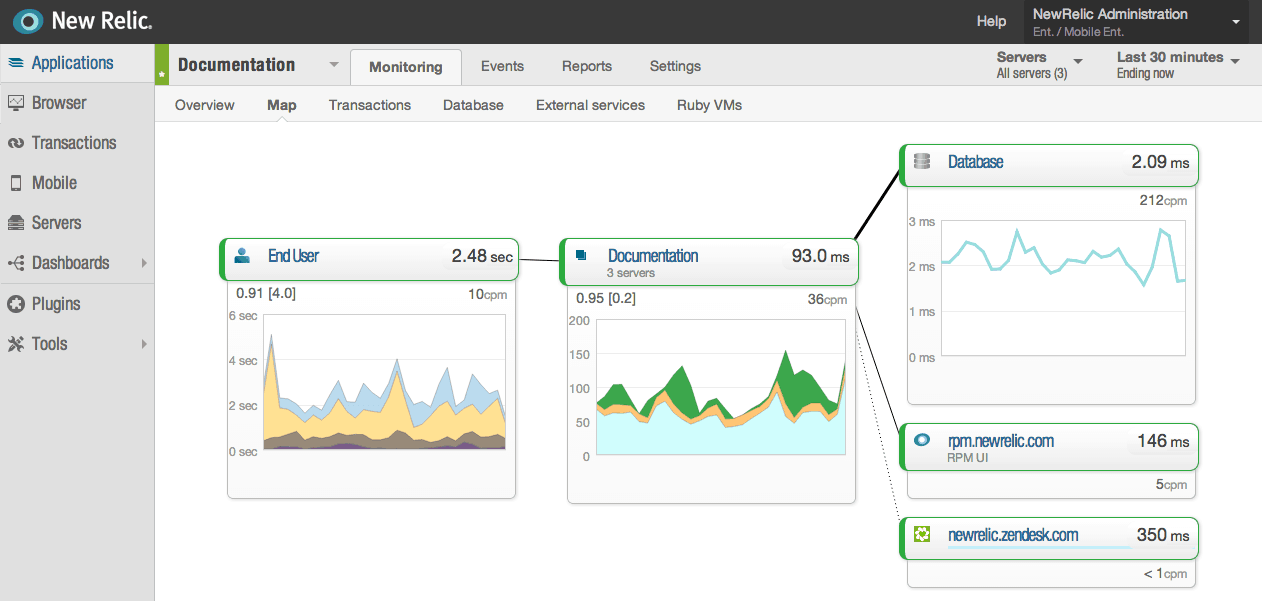
You’ve probably noticed the main screen at AppDynamics include a map of the services the application is using with their call loads and health index while NewRelic displays a response time graph. This might be a way to signal each tool’s monitoring priorities and AppDynamics inclination to larger enterprises. Anyhow, enough with this dev tool psychology, but it’s worth noting that a similar map is also available on New Relic:
One of the thorny issues here is alerting and reporting, with so many metrics and moving parts, it’s hard to identify which matters most. Is it a low error rate? Responsiveness? Throughput? AppDynamics and New Relic each took a different approach to distill these metrics into performance indicators. New Relic is using the Apdex score index, which uses a user defined response time threshold T to imply end-user satisfaction. Simply put, they require you to manually set the threshold. Here’s an example for the way this score is calculated:
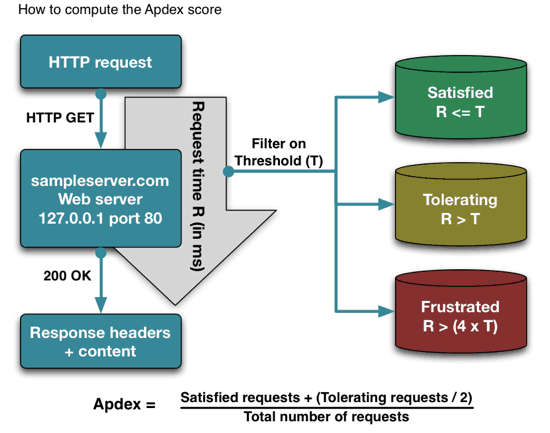
Calculating Apdex, now sum this over all requests for a given time and you’ll get the score
AppDynamics on the other hand, doesn’t believe in Apdex (as they explained in an article called ”Apdex is Fatally Flawed”). They’ve come up with a solution of their own that automatically creates a dynamic baseline for the apps performance which varies by time. For example, the definition of a slow transaction might vary under low and high loads on the system. Bottom line: We’re seeing that AppDynamics puts its priority on visualizing the stack from end to end, while NewRelic is focused on bottom line response times. We’ve also seen the difference in alerting with Apdex and a dynamic baselines. Server Monitoring Another monitoring capability offered by both tools focuses on the hardware your servers run on: specs, CPU usage, memory utilization, disk I/O and network IO.

AppDynamics on the left, New Relic on the right with some sample data
In this category, AppDynamics offers a few more features than New Relic, mostly around memory: heap size & utilization, garbage collection stats divided by gens and memory leak detection.
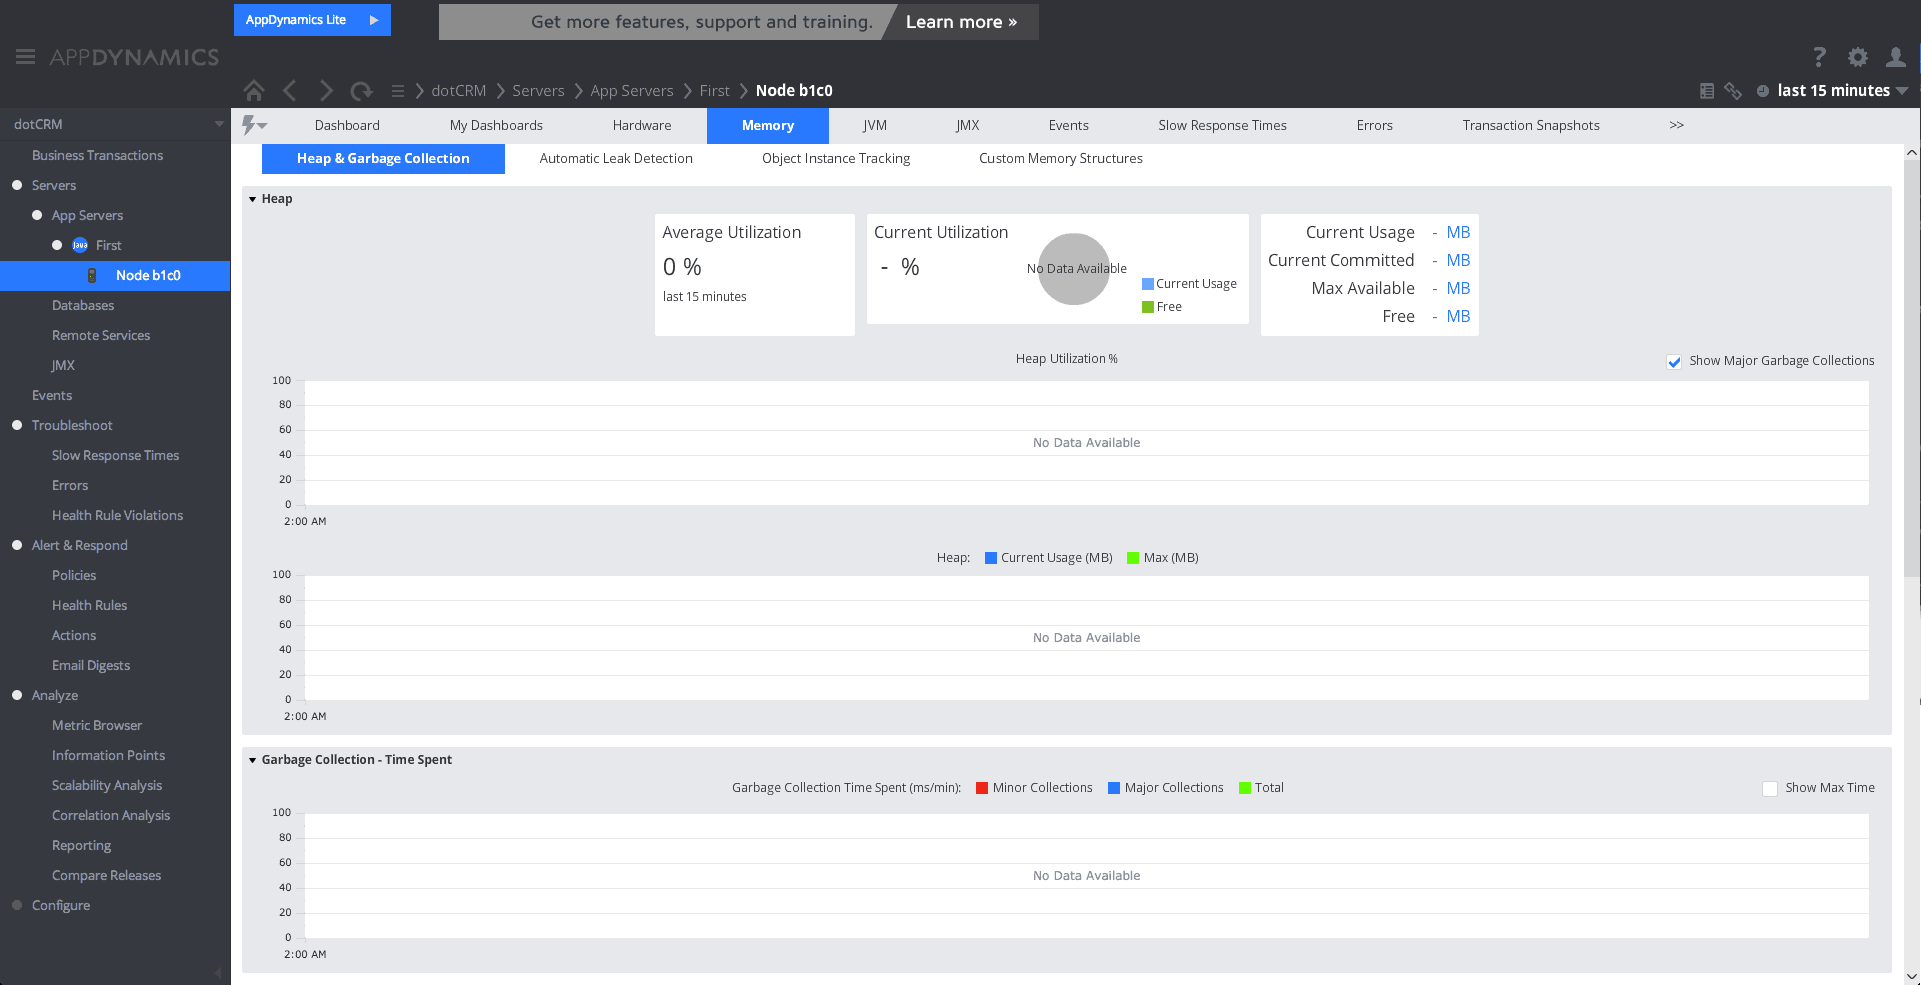
AppDynamics Server Monitoring - Memory features
Bottom line: AppDynamics provides deeper insights into garbage collection and memory leak detection beyond the standard metrics.
Database Monitoring
Moving on to other components in your stack, the first thing that comes to mind is the database. Here we have a greater distinction with a richer AppDynamics dashboard looking into things like resource consumption, wait states, user sessions, specific query calls and more. On New Relic’s end the situation is a bit different with the Database dashboard as part of the basic APM product. Both tools have specific database monitoring metrics available through plugins to view data from external services (we’ll talk a bit more about integrations later). Either way, both native and external feature sets here might be different depending on the database you use.

AppDynamics on the left with an Oracle DB, New Relic on the right with MySQL plugin
Bottom line: Beyond the shared database metrics that go a bit deeper with AppDynamics, it’s worth looking into the features available for your specific database within each tool.
Insights and Analytics
This one is a wildcard, going beyond traditional APM and opening up to business intelligence metrics. Since both New Relic and AppDynamics already have access to the messages that go through your application, they’ve built this opt-in additional database to store your stats and enable you to query them.

AppDynamics on the left, New Relic on the right with some sample data
Bottom line: If you don’t have a solution that already allows you to process such queries, it might be about time to get one.
Frontend & Mobile Monitoring
Switching seats from the backend, lets take a quick look at what we’re getting on the Real-User Monitoring front. Both AppDynamics and New Relic have a product targeting browsers and a product targeting mobile with iOS & Android support. On Mobile, the flagship features include insights on slowdowns and crashes, that are filtered through geographic regions, devices, operating systems and operator networks:

AppDynamics on the left, New Relic on the right - Mobile Real-User Monitoring
With end-user browser analytics, it feels like having the visibility you have on your browsers load times through Chrome dev tools available on the actual users of your app: 
AppDynamics on the left, New Relic on the right - Browser Real-User Monitroing
Bottom line: We’re seeing again how New Relic’s focus is on response time bottom lines while AppDynamics emphasizes the global picture.
4. How to Solve the errors you find
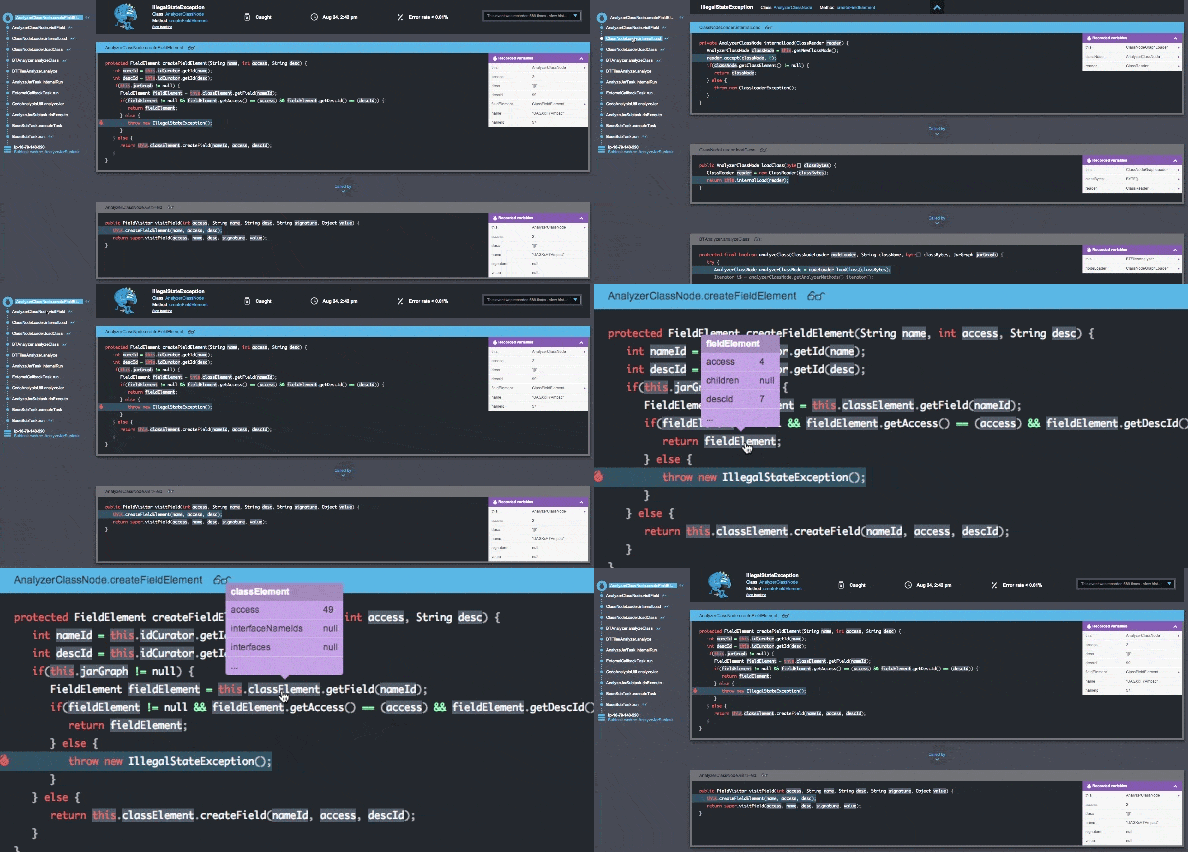
To go beyond the reporting and alerting of errors by AppDynamics and New Relic, many of our users add Takipi to their toolbox. This allows them not only to monitor server slowdowns and errors via New Relic or AppDynamics, but also to solve them using Takipi. Whenever a new exception is thrown or a log error occurs - Takipi captures it and shows you the variable state which caused it, across methods and machines. Takipi will overlay this over the actual code which executed at the moment of error – so you can analyze the exception as if you were there when it happened. The dashboard links each error to a recorded instance of all involved code when the bug happened, and includes the variable values that caused it:
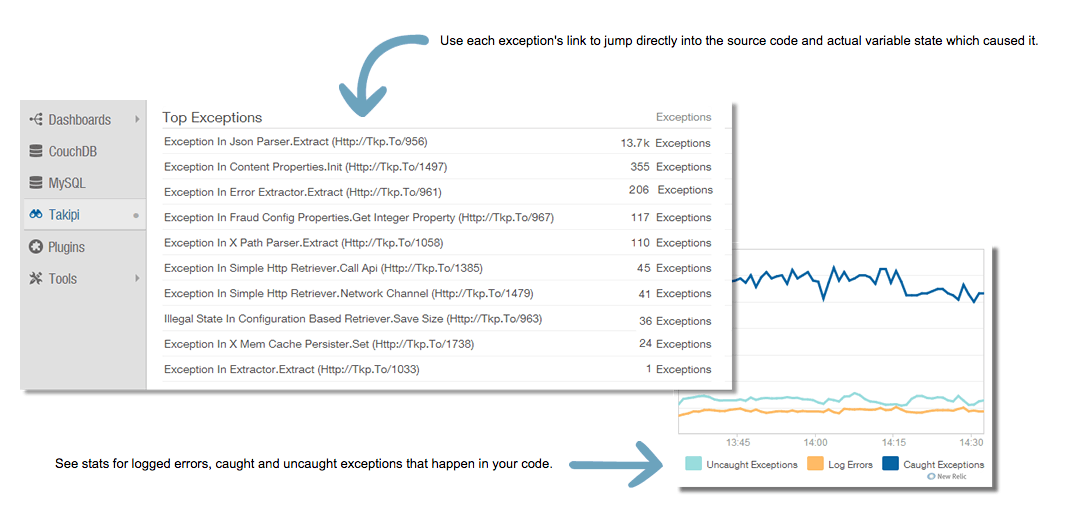
Takipi plays well with AppDynamics, and it also has a New Relic plug-in that displays an exception and log error dashboard:
Bottom line: It’s one thing to identify what’s stopping you down, but solving it, is a whole different issue. Java or Scala developers? Whether you're using an APM tool or not, try Takipi.
5. Dashboard and Usage
To get a better feel of each tool’s user experience and way of solving problems, I think it’s probably best to browse through a video. But before that, it’s worth noting that AppDynamics uses a dashboard based on Flash, yes… Flash, turns out it’s still out there. This felt like a drawback but its probably the best Flash application I’ve seen out there:
NewRelic at TypeSafe, a webinar that gives an overview of New Relic for Play (it’s a bit long but gives a nice overview if you browse through):
Bottom line: I still can’t believe the Flash didn’t scare me off completely. And it was ok actually. Both tools provide a nice experience, but still feel a bit cluttered.
6. Installation
SaaS/On-Premise: AppDynamics offers a few modes of operation - SaaS, on-premises and a hybrid approach, each with its installation instructions. New Relic is only available through SaaS.Agents: Monitoring your application becomes available through attaching language specific agents to your server. For example, with Java there are 2 possible ways to instrument your code with agents, either by using a Java agent or a native agent. New Relic and AppDynamics use a Java agent to collect the performance data they’re reporting. To gather the low-level data required not only to point to an error but to help solve it, Takipi uses a native agent.
Code and configuration changes: On the Real-User Monitoring front, project and configurations changes including introducing a few dependencies would be needed if you’d like to add monitoring capabilities to your web or mobile app. This includes adding JS agents to your website and native mobile agents to your mobile application.
Alerting: AppDynamics computes your response time thresholds by itself and might take some time to learn your system. New Relic relies on custom thresholds defined by you for its Apdex index. Bottom line: If you require an on-premise version, the answer is clearly AppDynamics. Otherwise, ease of installation is pretty much the same - mind the alerting though.
7. Integrations and Plugins
Branching out, AppDynamics and New Relic offer integrations and plug-ins to hundreds of services. Let’s start with NewRelic, we’ve already mentioned the Platform program earlier: a plug in platform with 116 (Last time I checked) plugins to services like Hadoop, RabbitMQ and Redis, that stream metrics of their data so you can view in on New Relic. On the integrations side of the table, there’s Connect, with 53 integrations with tools like Jira, HipChat, Takipi and pagerduty. AppDynamics Exchange offers 100 plugins and is also an open platform for developers to build plugins.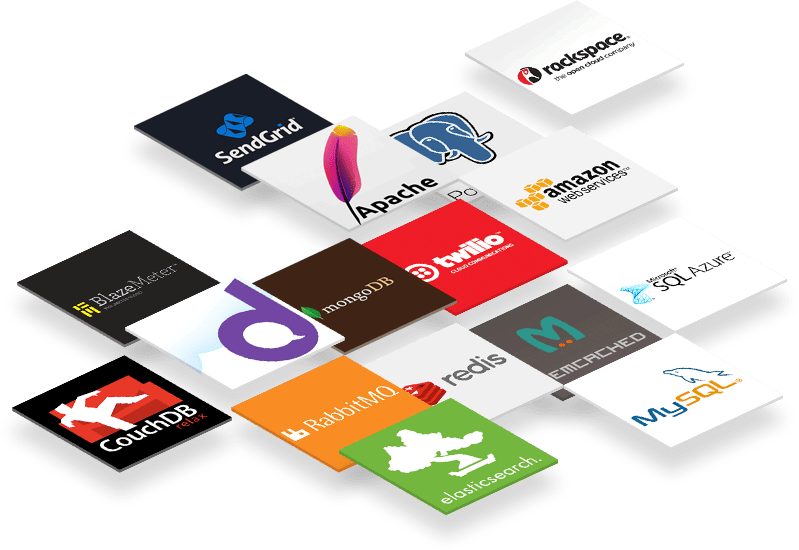
Bottom line: New Relic has richer integrations that feel friendlier, but any way you go it’s an individual decision to see where and how your tools of choice integrate better.
8. Pricing
Both tools have a free lite version with limited features across all products, including a 24hr data retention with pro trials of 14-30 days. Pricing with AppDynamics pro programs is more individual, you’ll have to contact sales to get a customized plan based on the number of agents you need. Mobile monitoring is a bit different when each agent is priced per 5000 Monthly Active Users.With New Relic, pro account pricing starts with with $199 per month per host ($149 on a yearly plan), this includes APM, Servers, Platfrom and Browser basics. Mobile monitoring costs $49 per month ($29 on a yearly plan) with 1 week of data retention. The Insights product start from $250 per month for up to 75 million events.
Bottom line: New Relic’s pricing caters more to startups and small-medium business while AppDynamics focus is on customizing solutions to enterprises. With that said, each tool ventures off to the other’s natural playground and this distinction today is not that clear as it was.
Conclusion
AppDynamics and New Relic are top of the line APM tools, each traditionally targeted a different type of developer, from enterprises to startups. But as both are stepping forward to their IPOs and after experiencing huge growth the lines are getting blurred. The choice is not clear, but you could not go wrong – On premise = AppDynamics, otherwise, it’s an individual call depends on which better fits your stack (and which of all these features are you actually thinking you’re going to use).
Opinions expressed by DZone contributors are their own.

Comments